INTRODUCTION
During the vegetative and early reproductive growth of wheat, assimilated carbon accumulates temporarily in the stem and leaf sheaths (LSs) as a reserve of carbohydrates, known as water-soluble carbohydrates (WSCs). Much of these carbohydrates can be remobilized and transported to the developing grain, and can make a significant contribution to final grain yield (Setter et al. Reference Setter, Anderson, Asseng, Barclay, Nagarajan, Singh and Tyagi1998). Under normal conditions this reserve mobilization could potentially contribute >0·20 of grain dry weight (Wardlaw & Willenbrink Reference Wardlaw and Willenbrink2000), though the proportion increases considerably under drought conditions (Ehdaie et al. Reference Ehdaie, Alloush and Waines2008 and references therein). The capacity of wheat to store WSCs in the stems and to remobilize these later to increase grain yield was observed to be higher in the internodes of cultivars tolerant to water deficit than those of sensitive ones, both under control and stress conditions (Gupta et al. Reference Gupta, Kaur and Kaur2011). Genotypic variation in the accumulation of WSCs in stems among wheat genotypes could potentially result from different physiological processes (Xue et al. Reference Xue, McIntyre, Jenkins, Glassop, Van Herwaarden and Shorter2008). Also, several morphological and anatomical traits are reported to be associated with stem reserve storage capacity (Scofield et al. Reference Scofield, Ruuska, Aoki, Lewis, Tabe and Jenkins2009; Saint-Pierre et al. Reference Saint- Pierre, Trethowan and Reynolds2010). The stem tissue in wheat is the predominant organ by weight at the stage of maximum WSCs (early phase of grain filling), which makes the stem an important carbon source for grain yield in wheat (Schnyder Reference Schnyder1993). More than 0·40 of total stem dry weight can consist of WSCs, with fructans representing 0·85 of the total WSCs in wheat stem internodes (Blacklow et al. Reference Blacklow, Darbyshire and Pheloung1984). Thus, a better understanding of the relationship between stem morphology and its capacity to store carbohydrates and grain yield is essential for the development of wheat better-adapted to terminal (post-anthesis) stress (Saint-Pierre et al. Reference Saint- Pierre, Trethowan and Reynolds2010). Theoretically, when photosynthesis is limited, genotypes with longer stems should be able to relocate more carbohydrates to the grain from stem reserves because of their greater storage capacity. However, the advantage of the tall genotype in stem reserve storage (source) was not always expressed as greater mobilization to the ear (sink) (Blum Reference Blum1998). Slewinski (Reference Slewinski2012) reported that storage and remobilization in wheat and other grasses depend to a large degree on transport mechanisms and metabolic processes within the stems.
In wheat, the stem comprises the peduncle (the uppermost internode), the penultimate internode (the internode below the peduncle) and the remaining internodes. The peduncle accounts for a considerable proportion of total stem length, from 0·33 in tall genotypes up to 0·47 in modern dwarf and semi-dwarf genotypes (Ehdaie et al. Reference Ehdaie, Alloush, Madore and Waines2006a ). Within the peduncle, excess WSCs are located in parenchyma cells that surround the vascular bundles, whose development is essential for transporting assimilates to the filling grain (Wardlaw Reference Wardlaw1990). At anthesis, the peduncle usually elongates considerably and part of it is exposed as it emerged from the flag LS. Thus, the peduncle of wheat consists of a lower unexposed heterotrophic part (i.e. enclosed by the flag LS) and an upper exposed autotrophic part. It seems that the enclosed region functions as a temporary vegetative sink tissue as fructan accumulates more in the enclosed region than in the photosynthetic exposed peduncle (Gebbing Reference Gebbing2003). The exposed part is reported to have anatomical, ultra-structural and physiological advantages for performing photosynthesis compared with not only the enclosed part, but also the flag leaf, especially in the later stages of grain-filling (Kong et al. Reference Kong, Wang, Feng, Li, Si and Zhang2010).
Spraying plots shortly after anthesis with chemicals that bleach the foliage but do not kill the plants (Blum et al. Reference Blum, Mayer and Golan1983; Regan et al. Reference Regan, Whan and Turner1993) forces them to rely on mobilizing stem reserves. In the present study, leaf blade defoliation was used as an alternative to chemical desiccation. The objectives were to: (i) evaluate the ability of contrasting wheat genotypes to accumulate and remobilize peduncle reserve carbohydrates under stress conditions during grain filling and their contribution to grain weight/spike (GWS); (ii) describe the association of peduncle morphological, anatomical and biochemical traits with GWS; and (iii) test how a selection programme has improved best F4:5 families compared with their parents, and identify whether any progress has been made.
MATERIALS AND METHODS
Genotypes
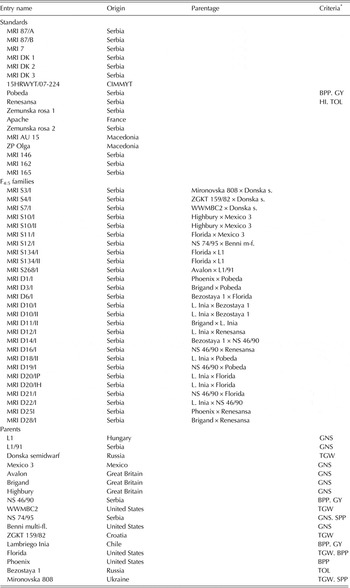
The experimental material comprised three groups of winter and facultative wheat (Triticum aestivum L.) cultivars and breeding lines: standard genotypes (consisting of 17 entries), F4:5 families (consisting of 27 entries) and parent genotypes used to make the F4:5 families (consisting of 17 entries). Standard genotypes (STA) represented cultivars or advanced breeding lines which are used by wheat breeders at the Maize Research Institute in Zemun Polje, Serbia (MRIZP) as standards for grain yield and other agronomic traits such as plant height, flowering time and disease resistance (in other words the current best-adapted varieties). Two of these genotypes, Pobeda and Renesansa, are also used by the Serbian Variety Commission as standards in official trials. F4:5 families (FAM) representing crosses made between genotypes selected on the basis of data on trait-increasing simple sequence repeat (SSR) alleles for markers associated with the three key yield components (spikes/plant, grains/spike and thousand grain weight) and traditional phenotypic breeding criteria (grain yield, plant biomass, harvest index and drought tolerance). Progenies of crosses were taken through to F4 (2010/11) and F5 (2011/12) generations, keeping only those lines that were phenotypically adapted on the basis of medium height, early/medium flowering date, large grains and good disease resistance. Parents (PAR) were genotypes used for crosses and were included only in the second year of the trials. Data for two genotypes, Pobeda and Renesansa, were included to calculate means for both STA and PAR groups as they are both wheat standards and parents for some crosses. Genotype names, origin, parentage and criteria for crosses are given as supplementary information (Table 1).
Identity (name and origin) of the 61 genotypes analysed along with parentage for F4:5 families and criteria for crosses

* Crosses were made between selected genotypes on the basis of initial marker locus-trait associations (SPP, spikes/plant; GNS, grains/spike; TGW, thousand grain weight) or traditional phenotypic breeding criteria (BPP, biomass per plant; HI, harvest index; GY, grain yield; TOL, tolerance to drought).
Field trials
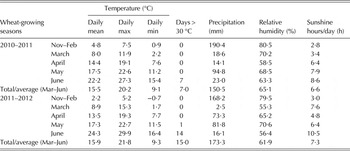
The trials were conducted at MRIZP experimental station, North Serbia (44°52′N and 20°19′E, 82 m a.s.l.) during two growing seasons (2010/11 and 2011/12). The site is of moderate continental climate, with cold winters and hot, dry summers. Summarized meteorological data for the winter wheat crop cycle in spring (March–June) is provided in Table 2). Daily maximum, minimum and mean temperatures, number of days with maximum temperature over 30 °C, precipitations, relative air humidity and sunshine hours/day were recorded from the nearest weather station of the Republic Hydrometeorological Service of Serbia (~5 km southwest of the experimental site). The soil was a haplic chernozem (CHha) (IUSS Working Group WRB 2014), with 30 g/kg organic matter and a pH of 7·0.
Climatic variables for two wheat-growing seasons, Zemun Polje, Serbia

Genotypes were planted in late October and harvested starting in late June the following year. This corresponded with the typical winter wheat season in the region. Each genotype was sown in two replicate plots consisting of ten 1-m-long rows, spaced at 20 cm, with a seeding rate of 450 seeds/m2. A completely randomized block design was applied. To prevent the reduction of reserve accumulation and storage capacity in stems, plants were additionally irrigated during March, April and early May (the end of stem elongation). Plots were irrigated manually when water in the top 0·75 m of soil had decreased to < 50% of field capacity. Defoliated plants (DP) had all leaf blades cut off 10 days after anthesis (10 DAA), around the start of the rapid grain filling phase (growth stage (GS)71–73, Zadoks et al. Reference Zadoks, Chang and Konzak1974). The treatment simulates a drought stress by inhibiting current assimilation (Blum et al. Reference Blum, Mayer and Golan1983). Control plants (CP) were left intact. Standard agronomic practices were used to provide adequate nutrition and keep plots free of pests, diseases and weeds.
Measurements
Along with GWS the genotypes were scored for anatomical, morphological and biochemical traits in the main stem peduncle and surrounding LS as follows: peduncle wall thickness (PWT), total number (small + large) of vascular bundles in the parenchyma (TBN), assimilation tissue share (ATS), area of parenchyma (APH), peduncle wall thickness index (WTI), area of intercellular pith (API), phloem area per peduncle section (PAP), lignified tissue as a proportion of total tissue (LTS), peduncle length (PDL), peduncle extrusion (PDE), peduncle as a proportion of stem length (PDS), water-soluble carbohydrate content (WSC) and water-soluble carbohydrate specific content (WSSC). Fifteen uniform plants flowering on the same day from interior rows within each replicate were tagged for sampling. Five tagged plants were sampled at 10 DAA and the remaining ten plants (five controls and five DP) at physiological maturity (when the maximum amount of dry matter had accumulated in the developing grain). At each harvest, the peduncle was separated into culm (C) and LS. Biochemical traits (WSC, WSSC) were measured in both tissues. The C sample consisted of both the lower unexposed (enclosed by the flag LS) part of the peduncle (EN) and the upper exposed part of the peduncle (EX). The C sample size was determined by cutting the peduncle half-way between the flag leaf ligule and flag leaf node at its lower end and half-way between the flag leaf ligule and the base of the spike at its upper end. Then 1 cm of C was cut from both the bottom of the EX end and from the top of the EN end for measuring anatomical traits in 2011. In 2012 anatomical traits were measured only in EX.
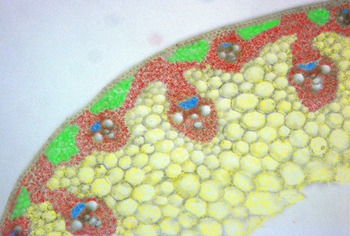
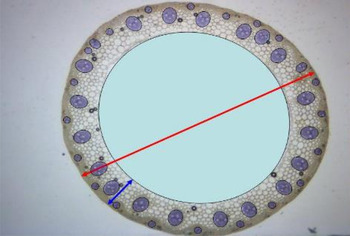
Anatomical traits were measured in the plants sampled at 10 DAA, when stem anatomy was assumed to be complete (Nátrová Reference Nátrová1991). The peduncle was cut into 10 mm suitable specimens, taken from EN and EX (as described above) and fixed in 50% ethanol. In the laboratory, C samples were transverse sectioned using razor blades, stained in 0·5% toluidine blue, and observed by a Leica 2000 light microscope. This process was completed on five EN and five EX sections per plant in 2011 and five EX sections per plant in 2012 and the most typical one was photographed at 25 × and 100 × magnification. The images were obtained by a Leica DC 300 digital camera and measurements of all anatomical parameters were completed using Leica IM1000 software. Peduncle diameter, peduncle section area, number of vascular bundles, API, assimilation tissue area and parenchyma area were measured on photographs obtained at 25 × magnification, while phloem area was measured from photographs obtained at 100 × magnification. Figures 1 and 2 show a typical peduncle cross section with all the anatomical traits identified on it.
Transversal section of wheat stem: blue, phloem area; yellow, parenchyma area; green, assimilation tissue area; red, lignified tissue area. (colour online.)

Transversal section of wheat stem: light blue, hollow pith cavity area; violet, vascular bundles; red arrow, peduncle diameter; blue arrow, peduncle wall thickness. (colour online.)

The peduncle section area was measured using a software option for measuring irregular surfaces on half of the section, and this value was multiplied by two. The software was also used for measuring the outer diameter of three peduncle sections. Outer diameter of peduncle was calculated based on three measurements per EN and EX sections and the average was used as peduncle diameter. Peduncle radius was taken to be half the diameter. The API was measured using the software option for the area of a circle, and based on this value the radius of the pith intercellular (hollow pith cavity) was calculated. The PWT was calculated as radius of C minus the radius of pith intercellular. The WTI was calculated as a ratio between PWT and peduncle diameter. The number of vascular bundles (TBN) was determined by counting small and big bundles in a cross-sectional area. The PAP was measured by the software option for irregular surfaces. Phloem areas of three big bundles per section were measured, and the average multiplied by total number of larger bundles per section. The same method was used for small vascular bundles, and the sum of phloem areas for big and small vascular bundles gave total phloem area per cross section. The APH was measured by software option for irregular surfaces on half the stem section, and area obtained was multiplied by two. Area of assimilation tissue was measured in the same way. Lignified tissue area was calculated as total cross section area without the area of pith intercellular minus sum of assimilation tissue, phloem area and APH. The ATS was calculated as the ratio of assimilation tissue area and peduncle section area without the API, and lignified tissue share in total tissue (LTS) as the ratio of lignified tissue area and peduncle section area without the API.
Peduncle (from flag leaf node to base of the ear) and extruded peduncle (from flag leaf ligule to base of the ear) lengths were measured at 10 DAA when peduncle, on average, attained its maximum length (Ehdaie et al. Reference Ehdaie, Alloush, Madore and Waines2006a ; Scofield et al. Reference Scofield, Ruuska, Aoki, Lewis, Tabe and Jenkins2009). Hence, data for these traits were combined from plants labelled to be control and defoliated. Peduncle share of total stem length was calculated as the ratio of its length to total stem length. Grain weight/spike was measured after harvesting plants at maturity. Yield per plant was not considered as defoliation did not significantly affect fertile ear number per plant (mean treatment difference 0·02 ears per plant).
Content of WSC in C and LS (as described above) was measured according to the method of Yang et al. (Reference Yang, Jing, Chang and Li2007) with some modifications. All samples were oven-dried at 70 °C within 2–3 h of harvesting until constant dry weight (Ruuska et al. Reference Ruuska, Rebetzke, Van Herwaarden, Richards, Fettell, Tabe and Jenkins2006). Prior to extraction, samples were cut into 1–2 mm pieces. Extractions were performed with 0·09–0·2 g dry material for each sample with three replications (three plants per genotype and treatment were analysed). Samples were boiled in 40 ml double distilled water for 40 min, and then filtered; filtrates were made up to a final volume of 50 ml by adding double distilled water. Total amounts of WSC (mg WSC/100 mg dry weight) were determined as fructose equivalents using the anthrone colorimetric assay (Yemm & Willis Reference Yemm and Willis1954) at 620 nm. Since peduncle WSC weight is a function of PDL, peduncle WSC weight was divided by length to determine peduncle WSC specific weight i.e. accumulation of WSC per unit length of peduncle (mg WSC/cm length). Storage increases with longer stems and greater specific weight (Blum et al. Reference Blum, Sinmena, Mayer, Golan and Shpiler1994).
The quantity of WSC mobilized from C and LS to the grain was estimated as the difference between C plus LS weight at 10 DAA and at physiological maturity (which was 37–42 DAA in the present study), when the green colour was about to disappear from the upper portion of the peduncle. Based on this, C and LS reserve contribution (RCO) to grain weight was estimated as the ratio of mobilized weight of C plus LS reserves to the grain weight. Peduncle C and LS reserve mobilization efficiency (RME) was estimated as the ratio of mobilized weight of C plus LS reserves to C plus LS weight at 10 DAA. The average grain filling rate (KFR) was estimated as the weight of WSC reserves mobilized to the grain weight at physiological maturity divided by duration (expressed as growing degree days). Cumulative growing degree-days, from 10 DAA to physiological maturity, were calculated as the sum of average daily temperatures [(max + min)/2] − base temperature. A base temperature of 0 °C was assumed for the grain filling period (Santiveri et al. Reference Santiveri, Royo and Romagosa2002).
Data analysis
Summary statistics such as mean, minimum and maximum values and coefficient of variation (CV) were used to describe the variability of the anatomical, morphological and biochemical traits in each treatment. Two-way analysis of variance (ANOVA) was applied for each trait to determine the effects of environment (treatment–year combination), genotype and their interaction. All sources of variation were considered as fixed. To ensure the validity of the model assumptions, residual and homogeneity variance analyses were performed for each of the traits as described in Zar (Reference Zar2010). Significant differences among means were determined by LSD at P < 0·05.
Due to the problem of the high degree of the multicollinearity among the predictors (as indicated by high variance inflation factor values) in the ordinary least square multiple linear regression model for GWS v. others traits it was decided to fit an alternative variable selection method known as Least Absolute Shrinkage and Selection Operator – LASSO (Tibshirani Reference Tibshirani1996). This process regularizes the least-squares fit and shrinks the effects of some of the traits to zero for a given value of the λ tuning parameter (Hastie et al. Reference Hastie, Tibshirani and Friedman2009). The LASSO solution was computed using the path-wise cyclical coordinate descent algorithm (Friedman et al. Reference Friedman, Hastie and Tibshirani2010). For each of the prediction models, the optimal value of the tuning parameter was estimated by fivefold cross-validation.
The correlation structure of the genotype by trait data table was visualized and interpreted by multivariate biplot techniques as described by Yan (Reference Yan2014). The interpretation of the biplot is based on the ‘inner-product’ principle (Kroonenberg Reference Kroonenberg1995). A positive correlation between two traits is represented by an acute angle between them and an obtuse angle represents a negative correlation, according to the following simple rules, e.g.: cosine 0° = 1 is a maximum positive correlation; cosine 180° = −1 is a maximum negative correlation and; cosine 90° = 0 is an absence of correlation. Separate biplots were constructed for CP and DP treatments.
All computations and data visualizations were accomplished within the R computing environment (R Development Core Team 2014).
RESULTS
General
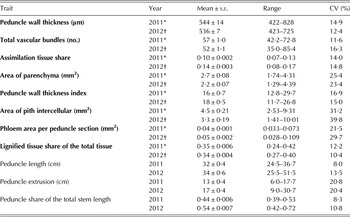
Descriptive statistics of the anatomical and morphological traits are shown in Table 3. Considering the CV, API had the highest variability (over 30%), followed by APH, PAP and PDE (all between 20 and 30%). Moderate variability (10–20%) was exhibited for PWT, TBN, ATS, PWT, LTS, PDL and PDS. For most of the traits, coefficients of variation were similar between years. However, variability of API, PAP and TBN were higher in 2012 when more genotypes were included (61 v. 44 in 2011).
Mean (±s.e. ), range and coefficient of variation (CV) for the peduncle anatomical (bold) and morphological (normal) traits for 44 and 61 genotypes in 2011 and 2012, respectively

Note: all traits are measured before leaf defoliation.
* Averaged across unexposed and exposed parts of the peduncle.
† Based on exposed part of the peduncle.
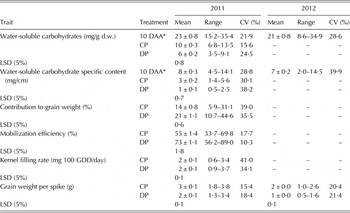
Descriptive statistics of WSC-related traits, estimated parameters and GWS are shown in Table 4. In general, variability of the traits was similar in CP and DP. Considerable variation (over 30%) was found for WSSC, RCO and KFR in both CP and DP. The other traits had moderate variability (10–20%). There was a significant difference (P < 0·05) between CP and DP means for all traits except KFR. The contribution of WSC reserves to GWS was on average significantly higher in DP (21·1%, range 10·7–44·6%) than in CP (13·7%, range 5·9–31·1%). Also, mobilization efficiency of WSC was significantly higher in DP (73·3%, range 56·2–89·0%) than in CP (54·4%, range 33·7–69·8%). Generally, obtained levels for WSC were lower compared with the results of other authors using either the same (Yang et al. Reference Yang, Jing, Chang and Li2007) or different (Scofield et al. Reference Scofield, Ruuska, Aoki, Lewis, Tabe and Jenkins2009) extraction methods. There could be several possible reasons for this, such as time of sampling and stem segment used for WSC determination. In addition, Ruuska et al. (Reference Ruuska, Rebetzke, Van Herwaarden, Richards, Fettell, Tabe and Jenkins2006) found that WSC content at anthesis was strongly influenced by environment, with values for each genotype generally varying by twofold across six environments. However, the current results are in very good agreement with the recent report of Li et al. (Reference Li, Zhang, Li, Chang and Jing2015), who determined WSC in 262 winter wheat accessions and obtained a range of 6–24 mg/g DW across different stem parts and plant developmental stages by different near-infrared reflectance spectroscopy regression models, which were developed for quantitative determination of WSC using modelling samples that were validated by the anthrone colorimetric assay.
Mean (±s.e. ), range and coefficient of variation (CV) for the grain weight and peduncle-related traits (averaged over culm and leaf sheath) for 44 and 61 genotypes in 2011 and 2012, respectively

DAA, days after anthesis; CP, control plants; d.w., dry weight; DP, defoliated plants; GDD, growing degree-days.
* Data are combined from both plants labelled to be control and defoliated.
Anatomical differences between the enclosed and exposed parts of the peduncle
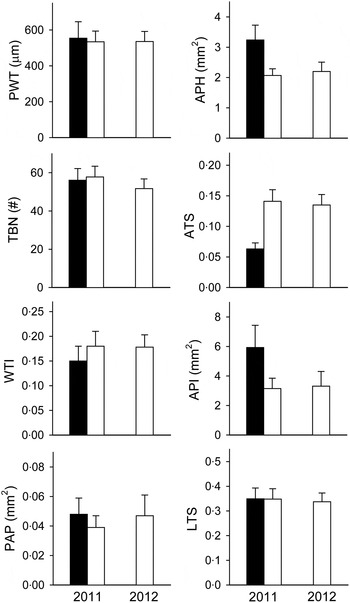
At 10 DAA exposed and enclosed peduncle segments differed significantly (P < 0·05) for ATS, APH, WTI, API and PAP (Fig. 3). The enclosed part had higher APH, API and PAP than the exposed part of the peduncle. The opposite was true for ATS and WTI. The only anatomical trait in the exposed part differing significantly (P < 0·05) between the 2 years was PAP. There was no measurement of anatomical traits in the enclosed part in 2012.
Performance of various anatomical traits at 10 DAA in the enclosed (black boxes) and exposed (white boxes) peduncle segments. Values are means from all 44 genotypes present in both seasons. Error bars represent standard deviation. Trait codes are as follows: PWT, peduncle wall thickness; APH, area of parenchyma; TBN, number of total (small + large) vascular bundles in parenchyma; ATS, assimilation tissue share; WTI, peduncle wall thickness index; API, area of pith intercellular; PAP, phloem area per peduncle section; LTS, lignified tissue share of the total tissue. Anatomical traits were not measured in the enclosed peduncle segment in 2012.

Water-soluble carbohydrate-related trait differences between the peduncle culm and leaf sheath
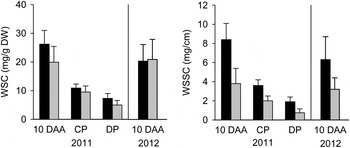
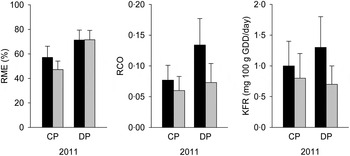
At 10 DAA, WSC and WSSC were significantly higher (P < 0·05) in LS than in C in 2011, while in 2012 only WSSC was significantly higher (P < 0·05) in LS than in C (Fig. 4). Trait means at 10 DAA in 2011 were significantly higher (P < 0·05) than in 2012, except for WSC in C (no significant difference). At physiological maturity WSC and WSSC were significantly lower in both LS and C, on average two- and threefold, than 10 DAA for both CP and DP, respectively (Fig. 4). The contribution to grain weight (RCO) in CP was higher for LS (0·077) than for C (0·060) (Fig. 5) and significantly higher (P < 0·05) in DP than in CP for both LS and C, but again a higher contribution to grain weight came from LS (0·138) than from C (0·073). The RME was significantly higher (P < 0·05) in DP than in CP for both LS and C. Estimates of RME were significantly higher (P < 0·05) for LS (59·2%) than for C (49·6%) in CP. However, in DP estimates of RME in both parts were similar (about 73%). Average filling rate per grain (KFR) was higher in DP than in CP (2·0 v. 1·8 mg WSC/100 GDD/day). Leaf sheath contributed more to KFR in both CP and DP than C (Fig. 5).
Water-soluble carbohydrate content (WSC) and specific content (WSSC) in peduncle leaf sheath (black boxes) and peduncle culm (grey boxes) at 10 DAA, and in control (CP) and defoliated (DP) plants at physiological maturity. Values are means from all 44 genotypes present in both 2011 and 2012. Error bars represent standard deviation.

Estimated contribution of mobilized reserves (RCO) to grain weight, reserve mobilization efficiency (RME) and average filling rate per grain (KFR) from peduncle leaf sheath (black boxes) and peduncle culm (grey boxes) in control (CP) and defoliated (DP) plants in 2011. Values are means for all 44 genotypes. Traits were not measured in 2012. Error bars represent standard deviation.

Relationship among traits
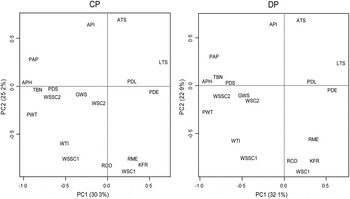
Genotype × trait biplots (Fig. 6) show the associations among the 19 traits across 44 genotypes in 2011. They explained about 55% of the total variation of the standardized data in both CP and DP. As the biplots explained a sufficient amount (⩾50%) of the total variation, a correlation coefficient between any two traits can be approximated by the cosine of the angle between their vectors (Yan Reference Yan2014). In general, both defoliated and non-DP gave similar patterns of trait correlations. Anatomical traits such as TBN, APH, PWT, PAP and WTI were positively associated with GWS (indicated by acute angles between vectors for those traits and GWS), while LTS was negatively associated with GWS, as shown by obtuse angles between their vectors. The only anatomical trait positively related to KFR was WTI, while ATS and API had strong negative associations with KFR. Average filling rate per grain was neither positively nor negatively related with GWS (indicated by the near perpendicular vectors). Peduncle reserve mobilization and efficiency had a strong effect to KFR, but not to GWS. Peduncle morphological traits had no effect on RCO and RME, but a strong either positive (PDS) or negative (PDL and PDE) effect on GWS.
Genotype by trait biplot showing the interrelationship among traits in controlled (CP) and defoliated (DP) plants based on mean values for 44 genotypes in 2011 (when all traits were measured). Trait codes: PWT, peduncle wall thickness; APH, area of parenchyma; TBN, number of total (small + large) vascular bundles in parenchyma; ATS, assimilation tissue share; WTI, peduncle wall thickness index; API, area of pith intercellular; PAP, phloem area per peduncle section; LTS, lignified tissue share in total tissue; PDL, peduncle length; PDS, peduncle share; PDE, peduncle extrusion; GWS, grain weight per spike; RCO, reserve contribution to GWS; RME, reserve mobilization efficiency; KFR, grain filling rate; WSC, water-soluble carbohydrate content; WSSC, water-soluble carbohydrate specific content; 1 = at 10 days after flowering, 2 = at physiological maturity. Data for anatomical traits are averaged across exposed and enclosed peduncle segments. Data for WSC, WSSC, RCO, RME and KFR are averaged across the peduncle culm and peduncle leaf sheath.

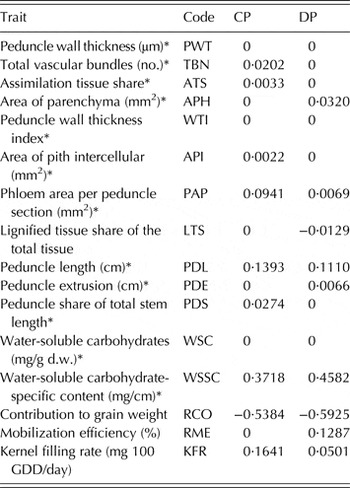
To further analyse the relationships between traits, the penalized regression method based on the LASSO was used for simultaneous variable selection and coefficient estimation. The LASSO estimates of the most significant contributors to GWS in CP and DP among the 16 anatomical, morphological and biochemical traits are presented in Table 5. The number of non-zero coefficients was nine in both CP and DP. In CP, RCO had the highest regression coefficient followed by WSSC at 10 DAA, GFR and PDL. Other traits that had effects on GWS in CP were PAP, PDE, TBN, ATS and API. In DP, RCO was also found to have the highest regression coefficient followed by WSSC at 10 DAA, RME and PDL. Smaller coefficients were observed for GFR, APH, LTS and PAP. Only PWT, WTI and WSC were found to have zero regression coefficients in both CP and DP.
Coefficients from Least Absolute Shrinkage and Selection Operator (LASSO) for grain weight/spike (based on data from 44 genotypes in 2011)

d.w., dry weight; CP, control plants; DP, defoliated plants.
* Data recorded at 10 DAA (before defoliation). Data for anatomical traits are averaged across exposed and enclosed peduncle segment. Data for WSC, WSSC, RCO, RME and KFR were averaged across peduncle culm and peduncle leaf sheath.
Differences between genotype groups for anatomical and water-soluble carbohydrate-related traits (at 10 DAA)
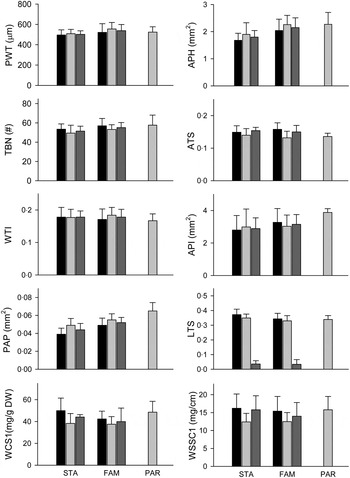
Genotype groups differed significantly (P < 0·05) at least in one season for all anatomical and WSC-related traits, except for ATS (Fig. 7). In both seasons FAM had significantly higher (P < 0·05) PWT and APH, and lower LTS, compared with STA. These two groups did not differ in any season for ATS, WTI, APH, API and WSSC. In 2012, PAR had a significantly higher (P < 0·05) API and both WSC-related traits than the other two groups. The PWT was higher for FAM than for the other two groups, while APH in STA was significantly lower (P < 0·05) than for the other two groups.
Performance of standard genotypes (STA), F4:5 families (FAM) and parental genotypes (PAR) across control (CP) and defoliated (DP) plants in 2011 (black boxes), 2012 (pale grey boxes) and 2011/12 (dark grey boxes). Anatomical traits were averaged over unexposed and exposed parts of the peduncle, and WSC traits were averaged over the peduncle culm and leaf sheath. Error bars represent standard deviation. APH, area of parenchyma; TBN, number of total (small + large) vascular bundles in parenchyma; ATS, assimilation tissue share; WTI, peduncle wall thickness index; API, area of pith intercellular; PAP, phloem area per peduncle section; LTS, lignified tissue share in total tissue; WSC, water-soluble carbohydrate content at 10 DAA; WSSC, water-soluble carbohydrate specific content at 10 DAA.

Differences between standard genotypes and families for traits measured at maturity
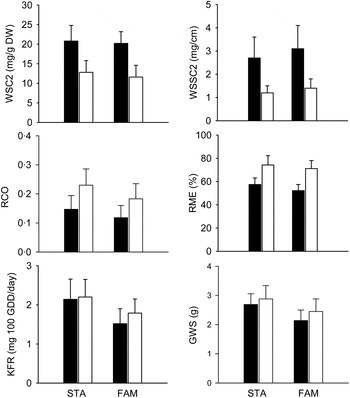
A comparison of STA and FAM for six traits measured at physiological maturity in 2011 is presented in Fig. 8. Control plants and DP differed significantly (P < 0·05) for all traits in both FAM and STA, with the exception of KFR in STA. Water-soluble carbohydrate-related traits and GWS were decreased by defoliation, while RCO, RME and KFR were increased in stressed plants. In CP, the two genotype groups differed significantly (P < 0·05) only in KFR (being greater in STA). In DP, GWS was significantly higher (P < 0·05) in FAM (than in STA).
Performance of standard genotypes (STA) and F4:5 families (FAM) in control (black boxes) and defoliated (white boxes) plants in 2011. Traits (except GWS) were averaged over peduncle culm and leaf sheath. Error bars represent standard deviation. WSC, water-soluble carbohydrate content at physiological maturity; WSSC, water-soluble carbohydrate specific content at physiological maturity; RCO, reserve contribution to GWS; RME, reserve mobilization efficiency; KFR, grain filling rate; GWS, grain weight/spike.

DISCUSSION
The peduncle accounts for a considerable proportion of total stem length in wheat (from 0·42 to 0·72 in the present study) and is thus an important organ for carbohydrate storage (Saint-Pierre et al. Reference Saint- Pierre, Trethowan and Reynolds2010). Water-soluble carbohydrates in grass stems are located in storage parenchyma cells that surround the vascular bundles located within internode tissues (Slewinski Reference Slewinski2012). Although the peduncle C of the wheat plant is a single continuous tissue, the lower part is enclosed by the flag LS (thus not exposed to light) and hence photosynthetic activity of these tissues is low or negligible (Wardlaw Reference Wardlaw1965). The upper region (below the ear) is exposed to light (autotrophic) and thus may contribute to the photosynthesis of the stem (Gebbing Reference Gebbing2003). Based on Cruz-Aguado et al. (Reference Cruz-Aguado, RodÉs, PÉrez and Dorado2000), the current authors postulated that the major destiny of the WSC depleted from the peduncle between 10 DAA and physiological maturity (which was 37–42 DAA in used genotypes) should be the grains. It was estimated that photosynthate in the peduncle C (including the enclosed and exposed parts) and flag LS contributed 0·137 and 0·211 of grain weight in CP and DP, respectively. This is consistent with results from Wang et al. (Reference Wang, Wei and Zheng2001), who suggested that the exposed peduncle and flag LS contributed about 9–12% to grain dry mass in 26 wheat genotypes. However, in the present study with 44 genotypes, variation of the RCO was rather higher, ranging between 0·059 and 0·311 in CP and 0·107–0·446 in DP, respectively. Mobilization efficiency of the peduncle sample (C + flag LS) was also higher in DP than in CP, by about 19%, a little higher than the previously reported 13% difference in WSC mobilization efficiency of wheat peduncle between drought and well-watered plants (Ehdaie et al. Reference Ehdaie, Alloush, Madore and Waines2006b ). The increase of RME due to terminal drought was higher in C (24·3%) than in LS (14·2%). The CV for RCO, as well as for RME and KFR, was very high, between 30 and 40% regardless of the treatment. This suggests a high genetic capacity of the peduncle to contribute to grain weight, even within the relatively small number of genotypes used in the present study.
In the present study, LS had significantly higher WSC than C at 10 DAA in the first season, while in the second season the difference in WSC at 10 DAA between these two parts of the peduncle sample was not significant. The main site of fructan storage has been reported to be influenced by growth conditions (Schnyder Reference Schnyder1993; Wardlaw & Willenbrink Reference Wardlaw and Willenbrink1994), which may explain the season to season differences observed in the present study. If concurrent growth is restricted for some reason, the mature LSs of temperate cereals and grasses, including wheat, can accumulate a substantial amount of fructan if high rates of photosynthesis are maintained (Pollock & Jones Reference Pollock and Jones1979; Schnyder Reference Kirby, Curtis, Rajaram and Gómez Macpherson1993). However, WSSC (linear content) at 10 DAA was significantly higher in LS than C in both seasons in the present study. The importance of WSSC in genotypic accumulation and mobilization of stem reserves in wheat was shown by Ehdaie et al. (Reference Ehdaie, Alloush, Madore and Waines2006b ), and was confirmed in the present study. Namely, WSSC content at 10 DAA, as well as WSC at 10 DAA, had a high positive effect on RCO, RME and KFR in both CP and DP. As expected, defoliation increased RCO, RME and KFR from both peduncle parts. Estimated RCO was significantly higher from LS than from C in both CP (by 1·7%) and DP (by 6·1%). Interestingly, mobilization efficiency of LS was significantly higher than that of C (by 10%) only in CP, while in DP RME for both part of peduncle was similar. Thus, at least in DP, factor(s) other than RME were responsible for the higher contribution of LS than C to grain weight, for example photosynthetic activity. Across all genotypes, the proportion of the enclosed part of the peduncle was between 0·55 and 0·60 of the total PDL (varying from 0·48 to 0·79 and from 0·38 to 0·67 in 2011 and 2012, respectively). Thus, a large proportion of the peduncle C could be heterotrophic, acting as a carbon sink rather than a photosynthetic source. On the other hand, the flag LS is exposed to irradiance and thus develops leaf-like autotrophic carbohydrate metabolism along its whole length (which was on average longer than the exposed part of the C). This would have been particularly true for DP as solar radiation would have penetrated deeper into the canopy (no shade from leaf blades).
As already mentioned, the peduncle C consists of two regions: the lower (unexposed) region which functions as a temporary vegetative sink tissue, and the upper region (exposed) considered to be heterotrophic sink tissue (Scofield et al. Reference Scofield, Ruuska, Aoki, Lewis, Tabe and Jenkins2009). In addition, the outer diameter of the peduncle decreases from the lower to the upper region (Gebbing Reference Gebbing2003). In the present study, the outer diameter of the peduncle was also (significantly) lower in EX than in EN (data not shown), while WTI was significantly higher in EX than in EN as PWT differed little between the two parts of the peduncle. Due to the ‘leaf-like’ autotrophic character of EX (more assimilation tissues, i.e. chlorenchyma) and decreased peduncle section area compared with EN (data not shown), ATS was also significantly higher in EX. Contrary to WTI and ATS, API, APH and PAP were significantly lower in EX. No significant difference between EX and EN for TBN was expected, as vascular bundles are arranged around the internode and run its full length (Kirby Reference Kirby, Curtis, Rajaram and Gómez Macpherson2002). However, PAP was 19% lower in EX than in EN. Studies in citrus fruits showed that the transport in phloem is generally much lower than its capacity. Removing a large part of the phloem in pedicels (even up to 90%) would be compensated by increasing the efficiency of the rest of the phloem, without negative effects on fruit growth (Bustan et al. Reference Bustan, Erner and Goldschmidt1995; Garcia-Luis et al. Reference Garcia-Luis, Oliveira, Bordon, Siqueira, Tominaga and Guardiola2002). This indicates that the phloem reduction of <20% in EX in the present study should not be a limiting factor for grain filling. Lignified tissue share was similar in both EN and EX, which means that lignified tissue area decreased proportionally with decreasing stem diameter. Lignified tissue share was around 0·35, which corresponds well with findings of Grenet (Reference Grenet, Vercauteren, Chèze and Triaud1996) that at heading stage lignified tissue accounted for 0·38 in wheat stems.
The various aspects of peduncle morphology have been related to grain yield and drought tolerance in wheat (Wardlaw & Willenbrink Reference Wardlaw and Willenbrink1994; Villegas et al. Reference Villegas, GarcÍa Del Moral, Rharrabti, Martos and Royo2007; Li et al. Reference Li, Chen and Wu2011; Dodig et al. Reference Dodig, Zorić, Kobiljski, Savić, Kandić, Quarrie and Barnes2012). Although among three segments of the wheat main stem (peduncle, the internode below the peduncle, i.e. penultimate internode and the lower internodes) the penultimate internode and the lower internodes are often reported as the major source for dry matter and carbohydrate mobilization during grain filling (Willenbrink et al. Reference Willenbrink, Bonnett, Willenbrink and Wardlaw1998; Ehdaie et al. Reference Ehdaie, Alloush, Madore and Waines2006a , Reference Ehdaie, Alloush, Madore and Waines b ; Abdoli et al. Reference Abdoli, Saeidi, Jalali-Honarmand, Mansourifar and Ghobadi2013), the peduncle was found to be a useful trait as it has a diversity of critical roles in determining crop yield (Kong et al. Reference Kong, Wang, Feng, Li, Si and Zhang2010). In addition, the exposed peduncle has several advantages (e.g. higher stomatal density and higher activity of heat-tolerant phosphoenolpyruvate carboxylase (PEPCase)) over the flag leaf for performing photosynthesis, particularly in the later stages of grain-filling (Kong et al. Reference Kong, Wang, Feng, Li, Si and Zhang2010). In the present study, none of the three peduncle morphology traits was related to WSC at 10 DAA and estimated parameters (RCO, RME and GFR) either in CP or DP. However, PDS had a positive effect on GWS, while PDL and PDE were negatively associated with GWS in both CP and DP. It seems that the peduncle has a broader role in crop productivity than mere carbohydrate accumulation, as suggested by Kong et al. (Reference Kong, Wang, Feng, Li, Si and Zhang2010). Although genotypes used in the present study differed in their time to anthesis by up to 14 days and stem height by up to 35 cm (data not shown), these were not related to variation in WSC, which means that selection for WSC could be conducted without significantly affecting height and phenology in wheat breeding programmes. Findings from the present study correspond well with the results of Ehdaie et al. (Reference Ehdaie, Alloush, Madore and Waines2006a , Reference Ehdaie, Alloush, Madore and Waines b ) in that differences in WSC were not significantly associated with earliness or plant height. In contrast to morphology, associations of anatomy traits with grain yield and drought tolerance in wheat have been much less investigated. The associations between anatomical traits and GWS showed similar patterns in CP and DP. Most of the anatomical traits had either positive (TBN, APH, PAP, PWT and WTI) or negative (LTS) associations with GWS, with API and ATS being neutral. At the same time most of the anatomical traits were negatively associated with peduncle-related traits PDL and PDE. The opposite was true for PDS. Interestingly, apart from the negative effect of API and ATS on WSC at 10 DAA, other anatomical traits were not associated with this trait, though anatomical traits related to PWT were associated with WSSC at 10 DAA. However, due to the issue of multicollinearity between anatomical, morphological and biochemical traits it was decided to fit the alternative variable selection method, LASSO.
The LASSO regression method for variable selection indicated RCO and WSSC at 10 DAA to be the most important for GWS among all traits in both CP and DP. The next most important traits for GWS in CP after RCO and linear carbohydrate content were GFR and PDL, while in DP they were RME and also PDL. Thus, these results were somewhat different from the interrelationship analysis and GFR, PDL and PDE now showed positive effects on GWS. This is in agreement with Dodig et al. (Reference Dodig, Barnes, Kobiljski and Quarrie2011) who found that a considerable variation in ability to maintain yield in DP of 96 diverse wheat genotypes was associated mainly with grain growth rate and peduncle traits. The anatomical traits had a weaker association with GWS than morphological and biochemical traits in both CP and DP. The reason for this could be because the final spike productivity is subjected to climatic factors well after anthesis, long after the formation of the stem/peduncle anatomy had been completed. Among anatomical traits, the most important for GWS were PAP and TBN in CP and APH and LTS in DP. Although a high WSC in the stem around anthesis was proposed to be desirable because grain yield is likely to be improved under terminal drought (Blum Reference Blum1998; Ehdaie et al. Reference Ehdaie, Alloush, Madore and Waines2006b ; Ruuska et al. Reference Ruuska, Rebetzke, Van Herwaarden, Richards, Fettell, Tabe and Jenkins2006), there was no association between WSC and GWS, neither in DP nor in CP. However, it seems more promising for wheat breeders to select for high WSSC as this trait had a positive association (by both genotype by trait biplot and regression analysis) with GWS in both CP and DP. Ehdaie et al. (Reference Ehdaie, Alloush, Madore and Waines2006b ) hypothesized that genetic gain in grain yield of modern spring bread wheat cultivars was partially associated with WSSC and WSC concentration in the stem as compensation for shorter plant stature.
Based on previous reports (Ehdaie et al. Reference Ehdaie, Alloush, Madore and Waines2006a , Reference Ehdaie, Alloush, Madore and Waines b ; Foulkes et al. Reference Foulkes, Sylvester- Bradley, Weightman and Snape2007; Álvaro et al. Reference Álvaro, Royo, Garcia del Moral and Villegas2008), a positive association was expected between RCO and GWS, but LASSO analysis indicated that genotypes with a higher contribution of WSC from the peduncle to GWS were less productive. Indeed, literature reports on the relationship between RCO and grain yield are not consistent. For example, Zamani et al. (Reference Zamani, Nabipour and Meskarbashee2014) found no significant relation between stem reserve remobilization and grain yield under heat stress during grain filling. The inconsistencies for WSC and RCO could be due partly not only to the large sensitivity of the accumulation of reserves to environmental conditions but also to sink strength, i.e. grain weight and number of grains per spike (Evans & Wardlaw Reference Evans, Wardlaw, Zamski and Schaffer1996; Ehdaie et al. Reference Ehdaie, Alloush, Madore and Waines2006a ; Dreccer et al. Reference Dreccer, Van Herwaarden and Chapman2009). As explained by Slafer & Araus (Reference Slafer, Araus and Slinkard1998), the strategy for selecting increased capacity to remobilize stored assimilates to the grains may be counterproductive for grain yield. Namely, accumulated assimilates in the stems before anthesis could reduce spike weight at anthesis, thereby reducing yield potential. Indeed, in the year when it was estimated RCO there was a negative effect of WSC in both C and LS on spike weight at 10 DAA (data not shown). Also in the present study, current assimilates continued to be provided by the green parts (including spike with awns) of DP. As reported by Maydup et al. (Reference Maydup, Antonietta, Guiamet, Graciano, López and Tambussi2010), the spike and awns may help maintain yield under both non-stress and water deficit conditions, contributing up to 0·33 and 0·45 to the grain yield, respectively. The contribution of spike photosynthesis increased more in defoliated than in intact plants. Furthermore, Saeidi et al. (Reference Saeidi, Moradi and Jalali- Honarmand2012) suggested that the role of spike photosynthesis is more important than carbohydrate remobilization and leaf photosynthesis in grain yield formation. Thus, it may be that spike photosynthesis contributed more than peduncle reserves to genotypes with high GWS in the present study.
Mobilization efficiency of the peduncle was related to GWS only in DP and could be regarded as an adaptive rather than constitutive trait. Namely, drought is reported to improve mobilization efficiency by 33% if based on WSC (Ehdaie et al. Reference Ehdaie, Alloush, Madore and Waines2006b ) or by 65% if based on dry matter (Ehdaie et al. Reference Ehdaie, Alloush, Madore and Waines2006a ) in the peduncle. Increases in mobilization efficiency in penultimate and lower internodes were far lower. Other important traits for GWS in DP but not CP were PDE, APH and LTS, while the opposite was true for PDS, TBN, ATS and API. Wheat stems store excess carbohydrates in the storage parenchyma cells, so an increase of APH and/or decrease of LTS will increase storage capacity in the stem internodes. This means a higher capacity to buffer source–sink relations during different stages of growth and in varying environmental conditions (Slewinski Reference Slewinski2012). Namely, not only storage capacity but also the sink size (GWS and grain number per spike) and its capacity to utilize the loaded carbon from the stem is also important for filling developing grains under water stress conditions (Gupta et al. Reference Gupta, Kaur and Kaur2011).
Finally, F4:5 families (FAM) were compared, which had been crossed to combine typical breeding traits such as biomass and yield components, with their PAR and STA. Regarding anatomical characteristics, PWT and its share in total peduncle diameter were the only traits significantly higher in FAM compared with PAR, while the opposite was true for API. Thus, it seems that the peduncle in FAM was more solid than in PAR. However, LASSO analysis showed no association between PWT or WTI with GWS in CP and DP across all genotypes, which is in agreement (Saint-Pierre et al. Reference Saint- Pierre, Trethowan and Reynolds2010). Also, despite higher PWT and lower API in FAM compared with PAR, along similar values for APH and LTS, WSC and WSSC at 10 DAA was significantly lower in FAM than in PAR. Nevertheless, F4:5 families had higher GWS than their parents, although not significantly (Dodig et al. Reference Dodig, Savić, Kandić, Zorić, Radović Vucelić, Popović and Quarrie2016). Unfortunately, due to sampling problems in the second year (when PAR was trialled), there were no estimates for RCO, RME and KFR to compare FAM and PAR. However, comparison between FAM and STA for those parameters could be done based on the first season. Despite WSC at 10 DAA being significantly higher in STA than in FAM, as well as estimated parameters RCO, RME and KFR (although not significantly), FAM still had significantly higher GWS than STA in DP.
Development of the conducting tissues in the peduncle is of great importance for transporting assimilates to the developing grain (Wardlaw Reference Wardlaw1990). F4:5 families showed higher (averaged across 2 years) PAP and TBN than STA, and both traits had a positive effect on GWS. Thus, higher transport capacity and lower RCO of newly developed breeding lines compared with standards may suggest higher contribution to grain yield from current photosynthesis (green parts of LSs and exposed peduncle) than from peduncle reserves. In our previous work, it was reported that targeted crosses made were successful in improving total biomass (and thereby grain yield) and showed better yield tolerance under mild or moderate stress during grain filling than standards and parents (Dodig et al. Reference Dodig, Savić, Kandić, Zorić, Radović Vucelić, Popović and Quarrie2016). The present study showed that higher total biomass of F4:5 families is not followed by increased WSC related traits, which may help to further improve yield under (severe) post-anthesis stress. Fortunately, biomass and increased WSC are not necessarily mutually exclusive and could produce a cumulative effect when combined in the same genotype (Saint-Pierre et al. Reference Saint- Pierre, Trethowan and Reynolds2010).
It is now several decades since stem reserves were recognized as an important source for grain filling when current photosynthesis is inhibited by stress. Theoretically, storage is increased with longer stems and greater WSC concentration (WSC content/stem weight). However, in modern bread wheat cultivars plant height has been reduced, implying a greater importance of WSC content per unit of length and translocation efficiency to compensate for shorter plant stature. Along with mobilization efficiency, a longer EX and larger C storage capacity (through higher parenchyma and/or lower lignified area) were of particular benefit for grain maintenance in DP. On the other hand, higher WSSC, grain filling rate and phloem area, as well as longer peduncle, should benefit grain yield under both stressed and non-stressed environments. It seems that improved biomass in the targeted crosses (Dodig et al. Reference Dodig, Savić, Kandić, Zorić, Radović Vucelić, Popović and Quarrie2016) was accompanied with higher transport capacity but without any improvement in WSC-related traits compared with best standards. Therefore, further improvement could be seen in combining high biomass with good transport capacity and high WSC in a common background.
This work was supported by the Serbian Ministry of Education, Science and Technological Development under Grant TR 31005 and by the EU FP7 project, Grant Agreement No. 316004 (REGPOT-AREA). The authors would like to thank Mrs Nancy Borchetta for her help with English grammar and vocabulary.