INTRODUCTION
Current and proposed regulations across the world, including New Zealand (NZ), are increasing the pressure on intensive pastoral dairy farming to adopt systems and technologies that increase productivity to maintain economic viability, while reducing environmental impacts, including nitrogen (N) leaching (Monaghan et al. Reference Monaghan, Hedley, Di, McDowell, Cameron and Ledgard2007, Reference Monaghan, De Klein and Muirhead2008; Graeme Reference Graeme2012). In NZ, pasture-based dairy farms employ a rotational grazing system throughout the year, with each paddock being grazed approximately ten times per year (Pembleton et al. Reference Pembleton, Rawnsley and Burkitt2013). Traditionally, NZ dairy systems have utilized N fixation through grass/clover swards to provide most of their forage. However, the last 15 years has seen an increase in N fertilizer use under dairying (Eckard et al. Reference Eckard, Chapman and White2007; Shepherd Reference Shepherd, Currie and Lindsay2009; Gourley et al. Reference Gourley, Dougherty, Weaver, Aarons, Awty, Gibson, Hannah, Smith and Peverill2012). Application rates vary but typically are 150–200 kg N/ha per annum on dairy farms stocked at 3 cows/ha (Shepherd Reference Shepherd, Currie and Lindsay2009), applied typically in four to five splits. In a few cases, rates of up to 400 kg N/ha per annum are used to sustain 4–5 cows/ha on irrigated pastures.
The efficiency of N fertilization in grazed pasture systems is influenced by environmental and management practices. Generally, N efficiency decreases as N fertilizer inputs increase (Feyter et al. Reference Feyter, O'Connor and Addison1985), and N losses to the environment increase with increasing N inputs, including imported feed and fixed N, into the system (Rotz et al. Reference Rotz, Taube, Russelle, Oenema, Sanderson and Wachendorf2005; Ledgard et al. Reference Ledgard, Schils, Eriksen and Luo2009). The main source for N losses in grazed pastures is leaching from urine patches (Decau et al. Reference Decau, Simon and Jacquet2003; Oenema et al. Reference Oenema, Wrage, Velthof, Van Groenigen, Dolfing and Kuikman2005; Ledgard et al. Reference Ledgard, Schils, Eriksen and Luo2009). Nitrogen fertilizer inputs affect this indirectly by providing more forage, enabling higher stocking rates, higher consumption and thus more N excretion. The amount of N excreted can be further exacerbated if the total plant N concentration is increased due to N fertilizer application (Hopkins et al. Reference Hopkins, Gilbey, Dibb, Bowling and Murray1990; Hoekstra et al. Reference Hoekstra, Struik, Amburgh, Lantinga and Schulte2008). Luxury uptake of N by pasture grasses in the first few weeks following N application, which exceeds the rate of N used by plants to produce growth, results in an accumulation of nitrogenous compounds, including nitrate N, in herbage (Keating & O'Kiely Reference Keating and O'Kiely2000; Jacobs et al. Reference Jacobs, Mckenzie and Kearney2002). The typical range of N in NZ's dairy pasture plants of 3·4–3·9% (Wheeler, Reference Wheeler2012) already exceeds the protein requirement by lactating cows grazing on temperate fresh forages, which equate to an N concentration of 3% (Pacheco & Waghorn Reference Pacheco and Waghorn2008). Further increasing this mismatch by N fertilization increases not only the amount of N consumed by the animal, but also the proportion of excretal N that occurs as urine (Whitehead Reference Whitehead1995). The increase in pasture N concentration (which is defined here as the N concentration in the pasture plant), however, depends on many factors, including season (growing conditions), rate of fertilizer N and period between application and grazing (Shepherd & Lucci Reference Shepherd and Lucci2013).
As well as these indirect impacts of N fertilizer use on increased risk of N leaching from urine patches, poorly timed N fertilizer application can also increase direct losses by leaching. While the synchronization of pasture N requirements and supply in both time and space – also termed synlocation (Jarvis et al. Reference Jarvis, Hutchings, Brentrup, Olesen, Van De Hoek, Sutton, Howard, Erisman, Billen, Bleeker, Grennfelt, Van Grinsven and Grizzetti2010) – is the most effective way to increase N response and reduce N losses, this is not easily achieved in practice due to substantial variation in plant N demand and soil N supply across years and within fields (Zebarth et al. Reference Zebarth, Drury, Tremblay and Cambouris2009). Variation in fertilizer N application rates and timing, soil type, climate and year-to-year variation in weather all affect N leaching (Di & Cameron Reference Di and Cameron2002; Buczko et al. Reference Buczko, Kuchenbuch and Lennartz2010; Cichota et al. Reference Cichota, Snow, Vogeler, Wheeler and Shepherd2012). In a field study under dairying Ledgard et al. (Reference Ledgard, Steele and Feyter1988) located only 0·80 of the 50 kg N/ha applied (as 15N) in autumn and attributed the missing N to leaching. Similarly Cookson et al. (Reference Cookson, Rowarth and Cameron2001) measured losses of 9–23% of applied N and concluded that autumn application to the pasture was the greatest risk. However, the risk of direct N leaching from fertilizers is likely to vary with soil-type, growing conditions and the amount of drainage after application.
The use of models to assess the performance of farming systems and to understand consequences of fertilizer management strategies on biophysical systems is increasing rapidly (McCown Reference McCown2002; Moore et al. Reference Moore, Holzworth, Herrmann, Huth and Robertson2007), with various models developed to simulate biological and physical processes in farming systems (Berntsen et al. Reference Berntsen, Petersen, Jacobsen, Olesen and Hutchings2003; Bryant & Snow Reference Bryant and Snow2008; Johnson et al. Reference Johnson, Chapman, Snow, Eckard, Parsons, Lambert and Cullen2008). A biophysical model that incorporates a detailed pasture model as well as a soil N and water model is required to assess the impact of farm management on N leaching. One such model is the Agricultural Production Systems Simulator (APSIM; Keating et al. Reference Keating, Carberry, Hammer, Probert, Robertson, Holzworth, Huth, Hargreaves, Meinke, Hochman, Mclean, Verburg, Snow, Dimes, Silburn, Wang, Brown, Bristow, Asseng, Chapman, McCown, Freebairn and Smith2003), a biophysical model which has been validated in many environments and systems. In NZ, it has been validated against drainage (Cichota et al. Reference Cichota, Vogeler, Snow and Webb2013) and N leaching under urine-patch conditions (Cichota et al. Reference Cichota, Vogeler, Snow, Shepherd and Thom2010). Pasture growth is simulated using AgPasture (Li & Snow Reference Li, Snow, Currie and Lindsay2010; Li et al. Reference Li, Snow and Holzworth2011), an adaptation of the pasture model from EcoMod and DairyMod, which has been validated previously for a range of conditions in Australia (Johnson et al. Reference Johnson, Chapman, Snow, Eckard, Parsons, Lambert and Cullen2008; White et al. Reference White, Johnson and Snow2008). While the APSIM model with AgPasture has been shown to simulate overall annual average net herbage accumulation across NZ well, discrepancies were identified for some regions, partly due to the models’ high sensitivity to temperature on pasture growth (Li et al. Reference Li, Snow and Holzworth2011). Thus before the model can be used for identifying best N fertilizer management practices, the model needs to be tested for seasonal pasture growth rates as well as for pasture N concentrations.
The objective of the present study was to estimate the relative importance of both the direct and indirect effects of N fertilizer application on the risk of N leaching. This assessment was based on a combination of experiments and subsequent deterministic modelling to test a range of scenarios. The effect of N fertilization rate and timing on (i) pasture yield, herbage N concentration and risk of direct loss of fertilizer N by leaching, and (ii) fate of the consumed herbage N and consequences for indirect leaching was investigated. The hypothesis was that:
-
1. Direct N leaching is small but can be large in situations of high drainage and poor N utilization.
-
2. Indirect N leaching is increased by fertilizer N due to increased pasture production and increased pasture N concentration.
MATERIALS AND METHODS
Overview of approach
Four N response experiments were established in the 2010/11 dairy production season at AgResearch's Tokanui Research Dairy Farm, in the Waikato region of NZ. The aim was to investigate the effect of N fertilizer rate and season of application on pasture dry matter (DM) production and to test the variation between paddocks on the same farm. Previous work at this farm had shown that N response of individual paddocks could be variable (Ghani et al. Reference Ghani, Shepherd, Rajendram, Rollo and Waller2011). Data from these experiments were used to calibrate the biophysical, process-based model, APSIM. Simulations were then run for a 20-year period to assess the implications of N fertilizer applications on N leaching risk. Simulations were also undertaken to estimate the effects on urinary N concentration and consequences for indirect N leaching via the urine patch.
Study site description
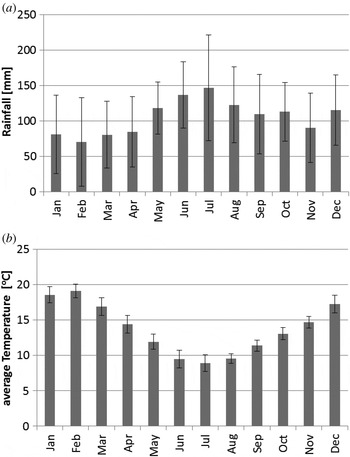
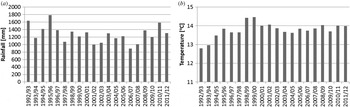
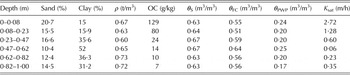
The average annual rainfall at the site is 1200 mm, with highest rainfall in the winter months (Fig. 1). The average annual average temperature is 13·6 °C. Climatic conditions are, however, very variable from year to year (Figs 1 and 2); in the period 1992/93–2011/12, annual rainfall varied between 890 and 1780 mm, and average annual temperature varied between 12·6 and 14·8 °C. The soil was an Otorohanga silt loam according to the Nationally Significant Soils Database (http://www.nlrc.org.nz/resources/datasets/national-soils-portal); a well-drained soil of volcanic origin, typical for the Waikato area. Key properties of the soil are given in Table 1; these were obtained from the AgResearch's Tokanui research farm (D. Houldbrooke, personal communication) and complemented with data from the National Soils Database (Wilde Reference Wilde2003), with further details given in Vogeler et al. (Reference Vogeler, Cichota and Snow2013).
Monthly distribution of (a) rainfall and (b) average temperature for the Tokanui experimental site for a period of 21 years (1992–2013). Error bars denote 1 s.d..

(a) Annual rainfall and (b) average temperature for the Tokanui experimental site for 20 years (June to May each year).

Key properties of the Otorohanga soil, where ρ is the bulk density; OC is the organic carbon; θ S, θ FC, θ PWP are the volumetric water contents at saturation, field capacity (100 cm), and permanent wilting point; and K sat is the saturated hydraulic conductivity

Experimental setup
Nitrogen response experiments were established in four paddocks on the Tokanui farm. Each experiment included a range of urea fertilizer application rates: 0 (control), 25, 35 and 55 kg N/ha in a randomized block design. Application rates reflected typical farm practice (Shepherd Reference Shepherd, Currie and Lindsay2009). The swards comprised perennial ryegrass (Lolium perenne L.) and white clover (Trifolium repens L.), with two paddocks high in clover (0·30–0·60) and two low (<0·10).
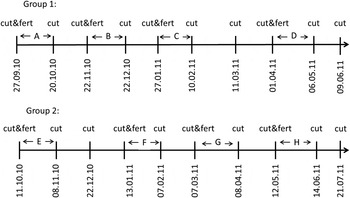
The plot size was 4 × 1·5 m and fertilizer N was applied four times throughout the season at the rates given above, with two or three harvests of the pasture between each application. Two of the paddocks (Group 1) received fertilizer applications on the same dates in September, November, January and April. Application to the second group (Group 2) was delayed and they received fertilizer in November, January, March and May. This gave a total of eight different fertilizer application timings (Fig. 3) covering spring (September, October and November), summer (early and late January) and autumn (March, April and May).
Experimental cutting and fertilization schemes for the two different groups with two paddocks each, with A to H indicating the cuts used for the measurement of pasture N concentrations.

Grazing animals were excluded from the experimental areas throughout (including a period before the experiments were established) so as to minimize the effects of residual urine and dung patches. Prior to each fertilizer application, the pasture was cut with a mower to a typical ‘post grazing’ residual pasture height equivalent to c. 1700 kg DM/ha. The aim was then to harvest the fertilized pasture when it reached a target of c. 2700 kg DM/ha in the 35 kg N/ha treatments, as estimated by routine rising plate meter measurements. To ensure that all paddocks in a group were cut on the same day some compromises had to be made, with pasture cover at cutting being ±0·3 t/ha from the target cover. Subsequent second and third harvests (‘residual cuts’) after N application were made at c. 3–5-week intervals. This allowed any carryover, or residual effect of N from the original fertilizer application, to be captured. After these two cuts, soil mineral N was measured to confirm that the soil N concentrations were about the same. For the next N application, the N treatments were then re-randomized across all plots.
Each plot was harvested by mower from an area in the centre of each plot (harvest area 3·6 m2). The clippings were collected on an individual plot basis, weighed and a sub-sample taken for drying and determination of moisture content. This allowed calculation of DM yield. Dried sub-samples were bulked by N rate for analysis of total N by Near InfraRed Spectroscopy (NIRS: Corson et al. Reference Corson, Waghorn, Ulyatt and Lee1999).
Model setup
All simulations were conducted using the APSIM modelling framework (Keating et al. Reference Keating, Carberry, Hammer, Probert, Robertson, Holzworth, Huth, Hargreaves, Meinke, Hochman, Mclean, Verburg, Snow, Dimes, Silburn, Wang, Brown, Bristow, Asseng, Chapman, McCown, Freebairn and Smith2003), version 7.2. This biophysical, process-based model is maintained by the APSIM Initiative; further details and related publications can be found at http://www.apsim.info (accessed February 2015). The primary modules used in the simulation for the present study included the soil module soil water infiltration and movement (SWIM; Verburg et al. Reference Verburg, Ross and Bristow1996), based on Richards’ equation for water flow and the convection–dispersion equation for solute transport; the SurfaceOM and SoilN (Probert et al. Reference Probert, Dimes, Keating, Dalal and Strong1998, Reference Probert, Delve, Kimani and Dimes2005) modules for soil carbon (C) and N transformations; AgPasture (Li et al. Reference Li, Snow and Holzworth2011) for pasture growth and N uptake; and the Micromet module (Snow & Huth Reference Snow and Huth2004) for computing evapotranspiration and energy partition. Ion adsorption for ammonium (NH4 +) was assumed to obey a Freundlich isotherm, with its parameters estimated from a pedo-transfer function (Vogeler et al. Reference Vogeler, Cichota, Snow, Dutton and Daly2011). Also included was a module accounting for volatilization from applied fertilizer, which is based on the approach by Génermont & Cellier (Reference Génermont and Cellier1997) and dependent on the equilibrium between ammonium and ammonia, pH, aqueous–gaseous equilibrium of ammonia and the gradient between the gaseous concentration in the soil and atmosphere.
Daily weather data from the Tokanui site (38°4′S, 175°19′E) of the Virtual Climate Station database of the National Institute of Water and Atmospheric Research was used (Tait & Turner Reference Tait and Turner2005). The APSIM simulations were set up with the Otorohanga silt loam. A base simulation with a ryegrass/white clover sward (L. perenne/T. repens) was set up, harvesting either according to the experimental setup or as described below for long-term modelling. For most model parameters default values were used, as these are generally based on experimental observations done at the scale of the relevant mechanism (Thornley & Johnson Reference Thornley and Johnson2000). However, since different plant species have specific optimum growing conditions and responses to available water and nutrient requirements, the water stress factor in AgPasture was set to 0·5 and the maximum temperature for growth to 35 °C, within the maximum range suggested by Berger et al. (Reference Berger, Machado, Agnusdei and Cullen2013). With these settings, appropriate model behaviour with the experimental data described in the present study was obtained. All simulations were initialized 6 months before the experiment to allow the simulation variables to adjust to environmental conditions, thus reducing effects of the initial conditions. In those 6 months, N fertilizer was applied at a rate of 20 kg N/ha/month from September to June. The outputs from those 6 months were discarded. All the simulations used in the present study, both to test the model based on the experimental results described below and those for the long-term modelling, were derived from the base simulation.
Model testing
This simulation was set up to simulate the fate of N following fertilizer application to a mixed-species pasture. The base simulation was modified by varying either the time or rate of fertilizer application. In total, eight different fertilizer timings with concurrent cuttings, as shown in Fig. 3(a–h), and four different fertilizer rates (0, 25, 35 and 55 kg N/ha) were set up, resulting in a total of 32 simulations. In line with the experimental setup, no fertilizer was applied in the 2 months prior to the fertilization application date in the experiment.
Scenario testing
Scenario testing was done to investigate the effect of year-to-year variability and N fertilization management (rate and timing) on pasture growth, N fertilizer response and risk of direct and indirect N leaching.
Environmental variations were obtained by running the model, in separate simulations, for 20 years, from the 1992/93 to 2011/12 season. The ryegrass/white clover sward was harvested at an interval of either 21 or 22 days, to obtain the same cutting days each year, to a standing DM of 1700 kg/ha. The fertilization rates were set to either 35 or 55 kg N/ha applied in January, April, July and October, on the same days as cutting occurred. A treatment with no fertilizer application was also simulated. Each fertilizer application rate was simulated in a separate model run, which resulted in a total of 60 simulations for the 20 different years. Nitrogen leaching was defined as the amount of N leached past a depth of 1 m in the farming year (1 June to 31 May) after application.
Indirect leaching from urine patches was estimated based on the results from the simulations described above. Further details and assumptions are described in the Results section under ‘Indirect N leaching’.
Statistical analysis
As a measure of model performance the Nash–Sutcliff efficiency (NSE) was used:
 $${\rm NSE} = 1 - \displaystyle{{\mathop \sum \nolimits_{i = 1}^n {{\left( {{\,p_i} - {o_i}} \right)}^2}} \over {\mathop \sum \nolimits_{i = 1}^n {{\left( {{o_i} - \bar o} \right)}^2}}}$$
where o
i
is the ith observed value,
 $\bar o$
is the mean of the observations, and p
i
is the ith predicted value. The NSE compares the model mean square error with the variance of the observations, and its value can vary from −∞ to +1, with NSE of 1 being the optimal value. Values between 0·0 and 1·0 are generally viewed as acceptable levels of performance (Moriasi et al.
Reference Moriasi, Arnold, Van Liew, Bingner, Harmel and Veith2007).
RESULTS AND DISCUSSION
Experimental observations: pasture yield and nitrogen fertilizer response
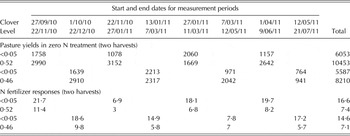
The two paddocks with high clover content showed the highest annual yields in the absence of fertilizer with 10·4 and 8·2 t DM/ha (Table 2), compared with c. 6 t DM/ha for the paddocks with low clover content. As expected, pasture showed highly significant increases in growth after each fertilizer addition (P < 0·001). However, the N response (defined as the additional pasture grown with N fertilizer [kg/ha] divided by the fertilization rate [kg/ha]) was variable across the season and between paddocks, when summarized as the yield from the two harvests after each N application (Table 2). The two high-clover paddocks showed the lowest N fertilizer response (7 kg DM/kg N) as an average of all three N rates and N applications, compared with an average N response rate (NR) of c. 15 kg DM/kg N with low clover levels. It was difficult to discern a consistent seasonal effect on N NR, although there was an indication that NR was higher in spring. This was more noticeable in the high-clover paddocks (Table 2). The largest NR is expected in mid-spring (October, November), lowest in winter (May, June) and intermediate in autumn (April, May) (Dairy Reference Dairy2012). Summer responses are considered highly variable, depending primarily on soil moisture status (Dairy Reference Dairy2012). In line with this, Feyter et al. (Reference Feyter, O'Connor and Addison1985) measured lower responses to N in the first harvests from May and June applications, and greatest responses to those from August; total responses after five harvests were generally twice as high from June to August applications, with NR ranging from 8·8 to 15·7 kg DM/kg N, compared with those from applications in March to May with NR ranging from 4·2 to 10·2 kg DM/kg N. Feyter et al. (Reference Feyter, O'Connor and Addison1985) also noticed that while pasture production in the first two harvests was increased, a decrease in clover content reduced the fourth and fifth harvests. In a study conducted on the East Coast of NZ, Korte (Reference Korte1988) found higher NR from fertilizer applications from June to August (ranging in average from 11·6 to 12·3 DM/kg N) compared with those from applications from either March to May or September (ranging in average from 3·8 to 8·6 DM/kg N).
Measured pasture yield from the nil N treatment (kg DM/ha) and responses to N fertilizer (kg DM/kg N applied) in the two harvests after fertilizer application. Data are grouped by fertilizer application date and low or high clover levels

Pasture nitrogen concentrations
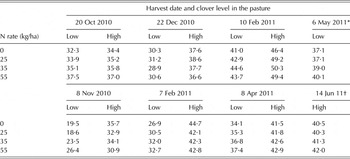
Measured pasture N concentrations varied between paddocks and between seasons (Table 3), most likely to due to different growth rates and the effects of dilution of plant N. Pasture N concentrations were consistently higher in the high-clover paddocks, in agreement with Morton & Risk (Reference Morton and Risk1994), and due to a higher crude protein concentration in clover compared with grass (Waghorn et al. Reference Waghorn, Burke, Kolver, Rattray, Brooks and Nicol2007). Across all harvests, fertilization increased pasture N concentrations in the low-clover swards with averages of 31·6, 32·8, 34·3 and 35·5 g/kg at rates of 0, 25, 35 and 55 kg N/ha. This increase was not significantly different, but different to the N concentration in the high-clover swards with concentrations of 40·1, 40·0, 40·6 and 40·2 g/kg at the different fertilizer rates. This lack of response to N fertilization in the pastures with high clover content is probably due to due to the buffering effect of N fixation. Shepherd & Lucci (Reference Shepherd and Lucci2013) suggest that the effect of N fertilization on N concentration in grass/white clover swards is, on average, quite small with a ±5% change in pasture N concentration with a 50 kg N/ha fertilizer application, depending on season of application. In the current experiment, the mean effect of 55 kg N/ha was a nil change in pasture %N in the high-clover swards (range −14 to +8% change), but a 14% increase in pasture %N in the low-clover swards (range 1–35% increase).
Summary of pasture N concentration (g/kg) in the first harvest after N fertilizer application, as affected by N fertilizer rate, season and clover level. Samples were bulked by treatment for analysis

* Only low-clover paddock monitored.
† Only high-clover paddock monitored.
Nutrient concentrations in plant tissues vary for several reasons, including seasonal influences (Bolland & Paynter Reference Bolland and Paynter1994; Wheeler Reference Wheeler2012; Shepherd & Lucci Reference Shepherd and Lucci2013), stage of plant maturity (Walworth & Sumner Reference Walworth and Sumner1988; Mengel & Kirkby Reference Mengel and Kirkby2001), species composition of the pasture sward, growth rate, soil fertility and the fertilizer application rate. Pasture N concentrations measured on dairy farms in NZ range from 2·8 to 5%, with an average of 3·7% estimated by Wheeler (Reference Wheeler2012). Sanches et al. (Reference Sanches, Tuohy, Hedley and Mackay2013) measured N concentrations in NZ pastures under both dairy, and sheep and beef farming, ranging from 1·2 to 5%, with an average of 3·5%. Cornforth & Sinclair (Reference Cornforth and Sinclair1984) suggested optimum N concentrations of 4·5–5% for ryegrass and 4·8–5·5 % for white clover (T. repens). Johnson et al. (Reference Johnson, Chapman, Snow, Eckard, Parsons, Lambert and Cullen2008) assumed an optimum N concentration of 4% for ryegrass within the DairyMod model.
Comparison: experimental data and model simulations
The variability in DM production and response to applied N fertilizer between replicate experiment paddocks was generally quite high, mainly due to differences in clover content as described above. The DM production in the high-clover plots at fertilization rates of 0, 25, 35 and 55 kg N/ha was on average 60, 36, 34 and 23 % higher compared with those measured in the low-clover plots. The N fertilizer responses at fertilization rates of 25, 35 and 55 kg N/ha were higher for the low-clover plots with averages of 11, 10 and 8·3 kg DM/kg N applied, compared with NR of 5·8, 5·7 and 4·2 kg DM/kg N applied for the high-clover plots.
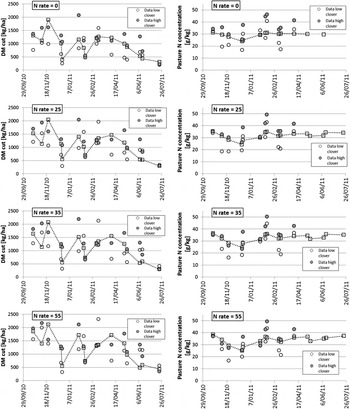
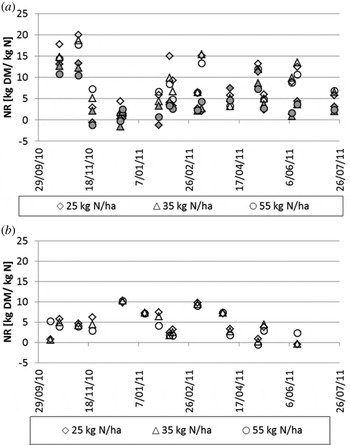
The APSIM model simulated pasture growth and N fertilizer response across the season reasonably well compared with the experimental data (Fig. 4). Nash–Sutcliff efficiency (NSE) values, a measure of the model performance, for DM were 0·46, 0·35, 0·32 and 0·33 for the different fertilization rates of 0, 25, 35 and 55 kg N/ha. Nitrogen response ranged from −4 to 15 kg DM/ha/kg N applied for experimental data and from 0·7 to 10·5 kg DM/ha/kg N applied for the APSIM simulations (Fig. 5). The data and simulations suggest a high importance of environmental conditions on NR, but, as discussed earlier, there was no clear effect of season. The APSIM simulations of pasture N concentrations agreed reasonably well with the measured values and the seasonal variation, with NSE values of 0·09, 0·43, 0·49 and 0·48 for the different fertilization rates of 0, 25, 35 and 55 kg N/ha. Simulated concentrations, however, showed a lower range of 24 to 39 g/kg compared to measured ranges of 16–45 g/kg for the low-clover paddocks and 24–50 g/kg for the high-clover paddocks. This is partly due to the dynamic modelling of the sward composition, with temporal changes in the clover-to-ryegrass ratio driven by environmental factors (mainly N supply from the soil). The experimental paddocks had quite different sward compositions (with two of the paddocks having low clover contents of <0·10, and the other two clover contents of 0·30–0·60). In the model, however clover content is driven by soil properties, temporarily varying and largely dependent upon the soil N content. Soil properties used for the modelling were those typical for the Otorohanga soil, and the reason for the observed variability in clover content between the paddocks is not known.
Measured and simulated, based on APSIM DM production (left) and pasture N concentrations (right) in the first cut after N fertilizer applications ranging from 0 to 55 kg N/ha to a ryegrass clover pasture in the Waikato region of NZ. Open and filled circles are those from a sward with low and high clover content, and open squares and dotted lines show model simulation results.

Pasture yield responses (NR) calculated from (a) experimental data, and (b) APSIM modelling (right) for different N application rates and timings to a ryegrass clover pasture in the Waikato region of New Zealand. Open and filled symbols are those from a sward with low and high clover contents.

In general, APSIM could simulate pasture growth and pasture N concentrations across the various N fertilizer treatments with different N rates and application timings reasonably well, with positive NSE values (ranging from 0·32 to 0·46) justifying the use of the model to extrapolate to other years with different climatic conditions and for other scenarios.
Modelling implications for nitrogen management
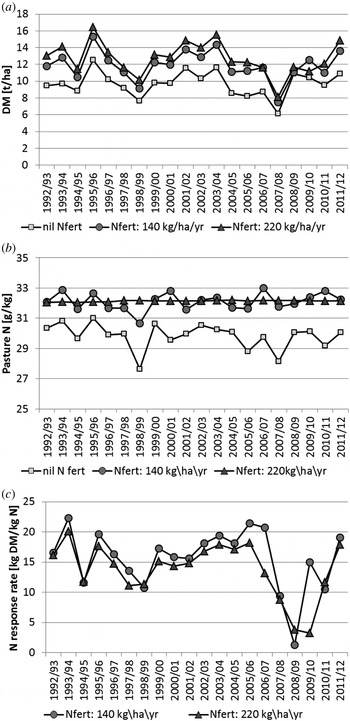
To assess the response of pasture to timing and rate of fertilizer application in the long term, over different climatic conditions, APSIM simulations were carried out for a period of 20 years. Average annual pasture yields, as simulated with APSIM, showed large variations between different years (Fig. 6(a)), as expected from the variation in rainfall and temperature (Fig. 1). Annual pasture production without fertilization ranged from 6·2 to 12·5 t DM/ha, and fertilization increased annual pasture yield up to 15·2 and 16·4 t DM/ha under annual fertilization of 140 and 220 kg N/ha. These ranges are within reported average yields for the same region of NZ of 12·9 and 14·6 DM/ha/year for a cutting trial and a grazed dairy farm (Romera et al. Reference Romera, McCall, Lee and Agnusdei2009) and 14·2 t DM/ha/year for grazed pasture (Glassey et al. Reference Glassey, Roach, Strahan and McLean2010). An average annual fertilizer application of 140 kg N/ha increased annual pasture yield by 2·2 t DM/ha, and application of 220 kg by 3 t DM/ha. While additional fertilizer application increased pasture yield the NR was decreased from 15·6 to 13·8 kg DM/kg N (Fig. 6(c)). Average annual pasture N concentration varied slightly, ranging from 28 to 31 g/kg with no fertilization, from 31 to 33 g/kg and from 32 to 33 g/kg under fertilization of 140 and 220 kg N/ha (Fig. 6(b)).
(a) Annual DM production, (b) average pasture N concentration and (c) N NR simulated by APSIM for 20 different years with different N fertilizer application rates, applied in even splits in January, April, July and October to a ryegrass clover pasture in the Waikato region of New Zealand.

To assess the effect of season and N rate on pasture yield and pasture N concentration, four harvests after fertilizer application were considered using the simulations described above. Under the cutting regime implemented in the model, the four harvests spanned a range of 12 weeks. This was done to consider the longer-term effect on fertilization as observed by Feyter et al. (Reference Feyter, O'Connor and Addison1985).
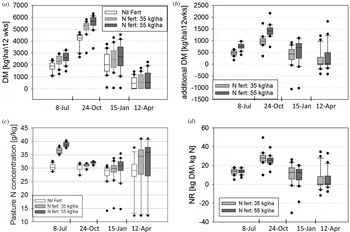
As in the experimental study and modelling described above, the highest pasture growth occurred in spring (October) and lowest in autumn (April; Fig. 7(a)). Simulations show high year-to-year variability, reflecting variability in climatic conditions. Pasture response to N fertilization was highest in spring (October) and lowest in April (Fig. 7(b and d)). Nitrogen response in later winter/early spring (July) was also good with NR of c. 14 kg DM/kg N applied (Fig. 7(d)), justifying fertilization application during this time. Higher fertilization rates increased pasture yield further and NR remained almost the same, apart from the application in October, when NR decreased with increasing rate of N fertilization.
(a) APSIM simulated DM production, (b) additional DM grown, (c) pasture N concentration and (d) nitrogen NR in the 12 weeks following fertilizer application at a rate of 0, 35 or 55 kg/ha in July, October, January or April to a ryegrass clover pasture in the Waikato region. The boxes show the 25th, 50th and 75th percentiles, and the whiskers the 5th and 95th percentiles from simulations over 20 years (June 1992 to May 2012).

As with the experimental data, pasture N concentrations showed a clear seasonal effect (Fig. 4), with lower N concentrations without fertilization in summer (January) and autumn (April) and higher concentrations in winter/early spring (July) and spring (October; Fig. 7(c)). Fertilizer application increased N concentrations throughout the season. The largest increases occurred following the July applications, increasing on average by 20 and 27% under application of 35 and 55 kg/ha. This is on top of an already high N concentration, which increases the risk of indirect N leaching as described below. While fertilization increased DM production in January and October, the effect on the N concentration was low, due to high pasture growth rates and dilution effects. The increase in N concentration of about 10% in April is in line with findings by Shepherd & Lucci (Reference Shepherd and Lucci2013).
Direct nitrogen leaching risk
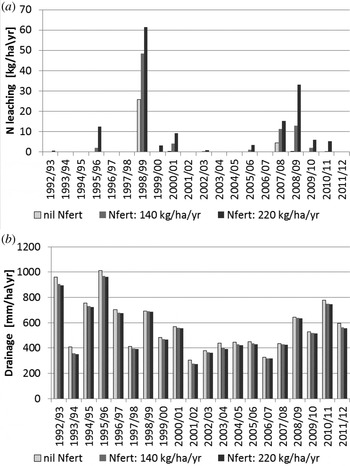
The risk of direct N leaching from the applied fertilizer was, in general, small over the 20 years simulated, based on fertilizer N applications made in July, October, January and April (Fig. 8). However, in some years substantial N leaching was simulated, with highest values obtained for the 1998/99 period: 26, 48 and 61 kg N/ha with increasing rate of N fertilization. This is a combined effect of low pasture growth in the 1998/1999 period (Fig. 6(a)), leading to accumulation of N in the soil, and high rainfall of nearly 200 mm following fertilizer application in July 1998. This high amount of rainfall results in increased drainage water, carrying the applied fertilizer beyond the pasture roots. The highest N leaching did not occur in the period with the highest rainfall, but instead when a high rainfall event occurred a few days after fertilization. This highlights that rainfall pattern and pasture growth are important factors influencing the risk of N leaching. The high loss of fertilizer N applied in autumn of 9–23% observed by Cookson et al. (Reference Cookson, Rowarth and Cameron2001) was not found in the present study because the model simulations did not model high fertilizer application in these periods, since it is considered poor agricultural practice. This confirms that the direct effects of N on leaching from pasture are generally small and can generally be mitigated by avoiding winter applications. However, the results suggest that the winter–spring ‘shoulder’ months (July/August) can still be a challenge given the need to apply N to meet early spring feed demands when there is still risk of leaching. Applying less N in a single application might decrease this risk.
APSIM simulated annual drainage (a) and direct nitrate leaching (b) at a depth of 1 m following fertilizer application at a rate of 0, 35 or 55 kg/ha in July, October, January or April to a ryegrass clover pasture in the Waikato region.

Indirect nitrogen leaching
To estimate the probable effect of N fertilization on indirect leaching, a simple calculation based on the results from the long-term modelling was done. The following assumptions were made:
-
• The 20-year average DM yield in the 12 weeks following fertilizer application was divided by four to obtain the DM yield for one grazing event, based on a rotational grazing length of 3 weeks.
-
• Assuming a DM intake of 15 kg/cow (Vibart et al. Reference Vibart, Koolaard, Barrett and Pacheco2009), the carrying capacity of a grazed paddock was calculated for the different fertilizer rates and seasons. This, with a rotational length of 3 weeks also provides the farm-scale carrying capacity, as stock units/ha (SU/ha).
-
• The mechanistic and dynamic model for N partitioning from dairy cows by Kebreab et al. (Reference Kebreab, France, Mills, Allison and Dijkstra2002) and tested by Vibart et al. (Reference Vibart, Li, Vogeler and Cichota2013) for dairy cows on fresh ryegrass-based diets was used to quantify the amount of N secreted in milk, urine, dung and retained in body tissues. A constant milk yield of 20 litres/cow/day (Vibart et al. Reference Vibart, Koolaard, Barrett and Pacheco2009), and a milk protein content of 35 g/kg were assumed. This, with the carrying capacity, provided the N return via excreta onto the paddock, both the total and the partitioning between dung and urine. The total amount of excreta returned during a grazing event is thus the sum of urine and dung N excreted by the number of cows/ha during the grazing event.
-
• Assuming urination frequency of 10 events/day, and urine patch area of 0·35 m2, the urine patch load (kg/ha) was calculated, and based on the carrying capacity the percentage area receiving a urine patch was calculated.
-
• Alternatively, as urine patch areas ranging from 0·2 to 0·5 m2 have been reported (Doak Reference Doak1952; Pleasants et al. Reference Pleasants, Shorten and Wake2007; Orwin et al. Reference Orwin, Bertram, Clough, Condron, Sherlock and O'Callaghan2009), urine patch loads and the area receiving urine patches was also calculated for these conditions.
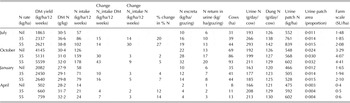
These calculations indicate that, on average, N fertilizer applications increase DM production and thereby potential carrying capacity of the grazed paddock (cows/ha), N intake and subsequent N excreta return via dung and urine (Tables 4 and 5). For estimating N leaching the N returned as dung was ignored because of the relatively slow release of NH4 from the organic N in dung, and therefore the minor importance of this source to N leaching losses (De Klein & Eckard Reference De Klein and Eckard2008). The driver of indirect leaching via the urine patch is thus the urinary N.
Effect of N fertilization rate at different times of the year on pasture DM yield in the 12 weeks following fertilization, pasture N concentration, N intake, change in N intake due to increased DM production and pasture N concentration, estimated N excreta return based on the carrying capacity with the respecting DM yield and a rotational length of 3 weeks, and the Kebreab model for partitioning N intake into milk products and excreta and assuming uniform return

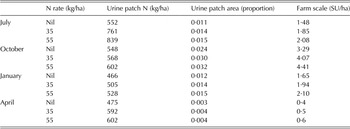
Effect of the N fertilization rate at different times of the year on N return as urine assuming a urine patch area of 0·35 m2, the proportion of area covered by urine patches, and the farm scale stocking unit (SU)

The increase in urinary N load with N fertilizer rate (Table 4) is due to two separate but linked factors; the increase in N intake due to the extra DM produced (changeNintake DM [kg/ha]) and the extra N intake because of the elevated N concentration of the pasture (changeNintake N [kg/ha]). An attempt to separate the two component contributions to the overall N intake and the urinary N excretion has been made in Table 4 using the following equations:
 $${\rm change}\,{{\rm N}_{{\rm intake}}}\,{\rm DM} =\left( {{\rm D}{{\rm M}_{{\rm fert}}}{\rm -} {\rm D}{{\rm M}_{\rm 0}}} \right){{\rm N}_{\rm 0}}$$
 $${\rm change}{{\rm N}_{{\rm intake}}}\,{\rm N = \; D}{{\rm M}_{{\rm fert}}}\left( {{{\rm N}_{{\rm fert}}}{\rm -} {{\rm N}_{\rm 0}}} \right){\rm \;} $$
where DM0 and DMfert are the pasture yields without and with fertilization (kg/ha), and N0 and Nfert the pasture N concentrations (g/kg) without and with fertilization. A similar calculation can be made for urinary N; the results are given in Table 4.
The calculations indicate that the effect of fertilizer N on pasture N concentration is on average generally small. An application of 35 kg N/ha increases N concentration in October, January and April by 4–14%, an increase that is in line with the <10% increase in N concentration observed for NZ pasture data by Shepherd & Lucci (Reference Shepherd and Lucci2013). In spring/summer months, Shepherd & Lucci (Reference Shepherd and Lucci2013) even found a decrease in N concentration due to fertilizer, attributed to the N uptake being diluted by fresh growth. The resultant increase in the proportion of excretal N as urinary N in these months is therefore also quite small (Table 4), given that N concentration in the diet drives partitioning into urine and faeces. Based on the equations above, it is estimated for these periods that the main contribution to extra N intake and urinary N is the increase in DM production, rather than the elevated N concentration in the pasture. This results in an increase in the area affected by urination (Table 5).
The exception to this pattern is the July application, where N fertilization resulted in elevated pasture N concentration as well as increased yield. In this case, there was an equal contribution to increased N intake and subsequent urinary N load from extra DM production and elevated N concentration.
In terms of the estimated N loading to an individual urine patch, the highest loads were estimated following N fertilization in July, increasing from c. 550 with no N fertilization to 840 kg N/ha within the urine patch area with a fertilization rate of 55 kg N/ha. This was the worst-case scenario; in other months, the effects on urine patch N load were smaller. To highlight how fertilization can affect urine patch load and thus the risk of indirect leaching from fertilizer, a few scenarios are presented here for July applications:
-
• Considering only the first cut after fertilization at a rate of 55 kg N/ha (instead of the average of 12 weeks as in Tables 4 and 5), with a simulated maximum pasture N concentration of 41·7 g/kg, results in a urine patch load of c. 940 kg N/ha. Thus in the first grazing after fertilization, the urine patch load would be even higher than the average from four grazing events.
-
• Assuming that the urine patch area is only 0·2 m2 would increase the range in urine patch load to 815–1467 kg N/ha.
-
• A larger urine patch area of 0·5 m2 would decrease the range to 326–587 kg N/ha.
As shown in various studies, N leaching from urine patches increases exponentially with increasing N load, and therefore determination of the urine patch area is important for leaching estimates. In a simulation study under the same climatic conditions as the current paper, Vogeler et al. (Reference Vogeler, Cichota and Snow2013) found that, on average, 0·25 of a urine patch load of 750 kg N/ha was leached. With a typical stocking rate of 3 cows/ha, c. 0·25 of the paddock area receives urination over a year (Pleasants et al. Reference Pleasants, Shorten and Wake2007; Snow et al. Reference Snow, Johnson and Parsons2009). Not accounting for the often-observed exponential increase of N leaching with N load of the urine patch, and simply assuming a 25% N leaching from the urine patch area and an annual urine patch coverage of 0·25, indirect leaching from urine would equate to 32, 38 and 40 kg N/ha for the three different annual application rates of 0, 140 and 220 kg/ha. Thus, by increasing the pasture N concentration, indirect leaching increases. This simple calculation accounts neither for the highly variable leaching between years, nor for the effect of the timing of urine deposition on the risk of N leaching (Shepherd et al. Reference Shepherd, Phillips, Snow, Currie and Lindsay2011; Cichota et al. Reference Cichota, Snow, Vogeler, Wheeler and Shepherd2012; Vogeler et al. Reference Vogeler, Cichota and Snow2013). It also does not account for the possible effect of nitrate adsorption to the allophanic Otorohanga soil, which has been shown previously to affect N leaching and uptake in the allophanic Horotiu soil from the same region in NZ (Giltrap et al. Reference Giltrap, Cichota, Vogeler, Shepherd, Currie and Christensen2014); however they found that accounting for nitrate adsorption in the APSIM model did not improve the overall performance of the N balance of the model.
Apart from increasing the N load in the urine patch area, the proportion of a paddock affected by urine patches also increases with increasing fertilization rate, due to higher pasture yield and thus carrying capacity. The values are in line with reported values of urine patch area coverage of 0·25 per year or 0·02 per grazing event at a similar stocking rate given by Snow et al. (Reference Snow, Johnson and Parsons2009) and Vogeler et al. (Reference Vogeler, Cichota and Snow2013). Thus apart from the direct leaching of fertilizer applied N, which is only significant in some years, this indirect leaching from urine patches also needs attention when deciding on best management practices for N fertilization. These indirect leaching amounts of c. 30 to 40 kg/N/ha at a stocking rate of 3 cows/ha are only a simple estimation, and further experimentation and modelling are required to better understand the effect of N fertilization on the combined direct and indirect leaching of N. The stage of lactation, which has been shown to significantly affect the partitioning of N into milk and total excreta, with mean estimates of N in milk of 122, 115 and 78 g/day for early, mid and late lactating cows (Vibart et al. Reference Vibart, Li, Vogeler and Cichota2013), was also not considered in the calculation for estimating indirect N leaching.
CONCLUSIONS
Experimental data demonstrated the effect of clover content and N fertilizer rate on seasonal DM production, pasture N concentration and fertilizer N response. The APSIM model was able to represent the experimental data reasonably well with positive NSE values (ranging from 0·32 to 0·46 for DM and 0·09 to 0·49 for pasture N concentration with N fertilization rates of 0, 25, 35 and 55 kg/ha). Running APSIM for 20 years demonstrated the variation in yield and also N leaching risk of ‘direct N leaching’ from applied fertilizer. The ‘direct N leaching’ risk was generally low because of the timing of applications according to good management practices. Where losses did occur, this was due to extreme events, with low pasture growth rates before fertilizer application and a high rainfall event, a few days after fertilizer application. This suggests that ‘direct losses’ of fertilizer N can be minimized by good agricultural practice, e.g. by avoiding late autumn or early winter applications. The highest risk of N loss is from indirect leaching due to higher pasture growth rates, enabling higher stocking rates and thus increasing numbers of urine patches. Modelling suggests that the main effect of fertilizer on indirect leaching is via increased amounts of pasture grown, whereas the increased pasture N concentration makes a lesser contribution. Although the risk of direct N fertilizer leaching can be minimized by good practice (avoiding N fertilizer in winter and in periods of low growth rates in dry spells), the challenge remains in minimizing loss of N via the urine patches.
This work was conducted through the Pastoral 21 Environment Programme (C10X1117), jointly funded by the Ministry for Business Industry and Enterprise, DairyNZ, Fonterra and Beef + Lamb NZ.