INTRODUCTION
In this world of rapid development, global energy demand rises rapidly due to economic and population growth. Liquid fuels play a significant role in transportation and economic growth. In Poland, like in other European countries, the transportation sector contributes to increased energy consumption (Krištof and Kožar Logar Reference Krištof and Kožar Logar2013). As fossil fuel resources produce chemicals and energy, this made them known as the driving force behind the development of the world’s lifestyle and economy (Krištof and Kožar Logar Reference Krištof and Kožar Logar2017).
In nature, there are three carbon isotopes. 12C and 13C are stable carbon isotopes with abundances of 98.89 and 1.11%, respectively (Wagner et al. Reference Wagner, Magill and Herrle2016). Moreover, in the upper atmosphere a cosmogenic 14C isotope is produced by the reaction of cosmic ray neutrons with nitrogen (14N), followed by oxidization with oxygen in the atmosphere to form CO2 (Hajdas et al. Reference Hajdas, Pearson, Quarta, Kirsty, Spalding and Yoneda2021). The fraction of 14C in contemporary nature is ca. 10−10 % relative to stable carbon isotopes. During sample preparation and measurement, isotopic fractionation occurs. Isotope-ratio mass spectrometry (IRMS) verifies the fractionation processes that affect relative isotopic abundances in the given liquid fuel samples. IRMS plays a significant role in stable isotope analyses by measuring isotopic variation observed from fractionations of mass-dependent isotopes in natural systems (Maruccio et al. Reference Maruccio, Quarta, Braione and Calcagnile2017).
The extreme age of fossil fuels means they no longer contain 14C, though the current biosphere does contain this isotope. Because of that, European Union member states are encouraged to increase the use of energy from renewable resources. Moreover, they decrease biocomponent taxes due to higher production costs as compared to fossil fuels (Dijs et al. Reference Dijs, van der Windt, Kaihola and van der Borg2006; Krištof and Kožar Logar Reference Krištof and Kožar Logar2017; Karaaslan and Gezen Reference Karaaslan and Gezen2022; Usman and Balsalobre-Lorente Reference Usman and Balsalobre-Lorente2022).
In addition, environmental changes due to greenhouse gas emissions have been observed. Previously, fossil fuel use in the transport sector or for energy production increased CO2 levels in the atmosphere. Combustion of fossil fuels for transport, energy, and heating is the primary source of CO2 emission from human activities in Poland (Piotrowska et al. Reference Piotrowska, Pazdur, Pawełczyk, Rakowski, Sensuła and Tudyka2020). One way to reduce CO2 emissions comes from using renewable (biogenic) sources (Krištof Reference Krištof2015). Several accurate and reliable testing methods are being used to confirm the eligibility of reimbursed taxes by controlling the content of bio components in fuels. Biocomponent fractions reflect 14C content, and numerous studies prove the suitability and robustness of 14C dating for liquid fuels (Reddy et al. Reference Reddy, Demello, Carmichael, Peacock, Xu and Arey2008; Krištof and Kožar Logar Reference Krištof and Kožar Logar2013; Culp et al. Reference Culp, Cherkinsky and Ravi Prasad2014; Santos Arévalo et al. Reference Santos Arévalo, Gómez Martínez, Agulló García, Reina Maldonado and García León2015; Krajcar Bronić et al. Reference Krajcar Bronić, Barešić, Horvatinčić and Sironić2017; Krištof and Kožar Logar Reference Krištof and Kožar Logar2017).
Accelerator mass spectrometry (AMS) and liquid scintillation counting (LSC) are among the techniques used to determine 14C content in liquid fuels. AMS requires graphite, as sample graphitization is standard for 14C measurements by high-precision accelerator mass spectrometry. To get the graphite, sample combustion by elemental analysis (EA) followed by CO2 graphitization with H2 on a catalyst (commonly iron powder).
During this process, the transfer of CO2 from EA to the graphitization reactors occurs using a zeolite trap (Němec et al. Reference Němec, Wacker and Gäggeler2010; Wacker et al. Reference Wacker, Němec and Bourquin2010). Sample preparation for LSC requires several procedures. In the carbamate method, also known as the LSC-A method (Horvatinčić et al. Reference Horvatinčić, Barešić, Bronić and Obelić2004), the determination of 14C is based on CO2 preparation by combusting a sample in a controlled environment. The second is the benzene method (LSC-B; Horvatinčić et al. Reference Horvatinčić, Barešić, Bronić and Obelić2004), where 14C determination occurs after sample conversion to benzene by forming carbide followed by hydrolyzation to acetylene and the trimerization to get benzene (Horvatinčić et al. Reference Horvatinčić, Barešić, Bronić and Obelić2004; Krištof and Kožar Logar Reference Krištof and Kožar Logar2017). Another procedure avoids sample pretreatment altogether (LSC-C), and involves simply mixing an appropriate scintillation cocktail with the sample (Norton et al. Reference Norton, Cline and Thompson2012; Culp et al. Reference Culp, Cherkinsky and Ravi Prasad2014; Krištof Reference Krištof2015; Doll et al. Reference Doll, Wright, Morley and Wright2017; Krajcar Bronić et al. Reference Krajcar Bronić, Barešić, Horvatinčić and Sironić2017; Doll et al. Reference Doll, Plymale, Cooper, Kutnyakov, Swita, Lemmon, Olarte and Wang2021).
This work aimed to test and verify the methodology of determining 14C content in liquid fuels at the Gliwice Radiocarbon and Mass Spectrometry Laboratory. Based on presented isotope studies, the biocarbon contents in liquid fuels may be determined. In addition, this study tested the accuracy of those methods for quantifying biocarbon in liquid fuels. This work moves towards accreditation for tested methods in the Radiocarbon and Mass Spectrometry Laboratory.
MATERIALS AND METHODS
To adapt the sample preparation methods and measurements to the conditions in Gliwice Laboratory, the determination of 14C in liquid fuels was investigated using LSC and AMS.
Tested Sample Materials
Several archived samples of liquid fuels with the following expected biocontents were used in this study:
-
ON/UF-BC/GdA-5623: 0%, background sample,
-
SN-204: 7–8%,
-
Diesel BP: unknown,
-
B30: 30%,
-
B37: 37%,
-
Hydrotreated vegetable oil (HVO): 100%.
Place of Realization
In this project, all samples were prepared at the Gliwice Radiocarbon and Mass Spectrometry Laboratory Institute of Physics – Centre for Science and Education, Division of Geochronology and Environment Isotopes. Graphite targets were prepared for AMS at the Gliwice Laboratory (Piotrowska Reference Piotrowska2013). The targets accompanied by references were submitted to the Poznan Radiocarbon Laboratory for AMS measurements (Goslar et al. Reference Goslar, Czernik and Goslar2004). Stable isotopes analysis using IRMS was conducted at Gliwice as well.
Sample Preparation for AMS
Accelerator mass spectrometry precisely measures rare isotopic ratios. Ratios of 14C/12C and 13C/12C are needed to determine biocarbon contents. The method does quantitatively determine biocarbon contents but requires extensive sample treatment and expensive equipment. Normally, for 14C AMS measurements, we need graphite (Wacker et al. Reference Wacker, Němec and Bourquin2010). To perform AMS measurements, a batch of liquid fuel samples was prepared. There was no chemical processing of samples before combustion. Liquid fuels were directly placed into tin capsules for liquid samples (0.04 mL) using an adjustable micropipette (0.1–2 µL) and sealed using a sealing press. At the Gliwice Laboratory, 2 µL of each liquid fuel type was subsampled and weighed on a Sartorius microbalance (precision = 0.001 mg) to get the mass of samples for combustion. The expected sample mass for 2 µL was 1.3 mg and the assumed percentage of carbon (% C) was 86%.
The samples were combusted in EA with 50 s of oxygen dosing and CO2 was transferred from the EA to the reactors for graphitization with H2 and an iron powder catalyst. Calculating the concentration of elements such as carbon in the sample, the system first measured the absolute elemental content, the concentration of that element was then calculated by the following formula:
 $$C = {{a \cdot 100 \cdot f} \over w}$$
C is the concentration of element in [%], a is the computed absolute elemental content in (mg), f is the daily factor, and w is the sample weight in (mg). To determine the daily factor, reference samples were analyzed along with unknowns. The ratio of known elemental concentrations of reference samples and the actual elemental concentration computed (CHNOS Elemental Analyzer manual 2013).
Sealing via capsule press was unchallenging and speedy. The only observed problem was the small size of the capsule for the liquid sample concerning the pipette tip, which kept some amount of the sample from sealing completely. A similar problem was reported previously (Santos Arévalo et al. Reference Santos Arévalo, Gómez Martínez, Agulló García, Reina Maldonado and García León2015). This amount should evaporate in time, so experiments to test the evaporative effects of the samples were made. First, the samples were combusted directly after sealing, considering only the calculated mass of 1.3 mg, assumed from the expected carbon content and the 2 μL volume (experiment 1). Second, all samples were weighed after 24 hr in their sealed capsules to determine their evaporations rates (experiment 2). Finally, to verify the evaporation of sample residues over time, the samples were sealed in capsules for 48 hr before EA combustion (experiment 3). Blanks contained no liquid samples.
Sample Preparation for LSC Measurements
Liquid scintillation spectrometry measures radioactivity and is used primarily for β-emitting isotopes such as 14C (Krištof and Kožar Logar Reference Krištof and Kožar Logar2017). Determining bicomponent content in liquid fuels using this method compares the counting rate for both fossil and modern origin samples. Gliwice Laboratory is equipped with two ultralow level liquid scintillation alpha and beta spectrometers (Quantulus1220). We used the LSC-B method (Pazdur et al. Reference Pazdur, Michczyński, Pawlyta and Spahiu2000, Reference Pazdur, Fogtman, Michczyński and Pawlyta2003; Horvatinčić et al. Reference Horvatinčić, Barešić, Bronić and Obelić2004).
To get the benzene sample for the LSC method, liquid fuels were prepared after mixing with purified preheated (500°C, 12 hr) sand using a benzene synthesis line. This process involved the use of 7 g of liquid fuels that reacted with 10.5 g of lithium at 700°C to form lithium carbide (Li2C2). Hydrolysis of Li2C2 produced acetylene (C2H2), which was purified by running through a mixture of potassium dichromate (K2Cr2O7) and sulfuric acid. Trimerization at room temperature converted acetylene into benzene using a preheated (at 600°C) chromium catalyst on silica gel.
Benzene samples were stored over sodium metal for 24 hr to remove water, followed by sublimation. For most of the liquid fuel samples, two subsamples of benzene were prepared. The first one was kept for 30 days in a laboratory freezer (–20°C) to remove radon contamination and the second one used in the resublimation procedure described below.
Resublimation Method for Radon Removal
In the Gliwice Laboratory, benzene preparation is the fundamental step for LSC measurements. However, radon (222Rn) inevitably contaminates these samples and can artificially inflate the biocarbon content. To remove 222Rn from the benzene samples before measurements without waiting 30 days, the resublimation method was used (Tudyka et al. Reference Tudyka, Pawełczyk and Michczyński2021). The key point of this method was to test the effectiveness of rapid radon removal. 222 Rn was removed in three different benzene samples (ON/UF-BC, SN-204, and B30) via four resublimation steps using a mixture of alcohol and dry ice at –79°C or NaCl and ice at –20°C. The performance of this procedure was confirmed by comparison to the background activity sample.
δ 13 C Determination by IRMS
IRMS sought to verify isotope fractionation that occurred during preparation and measurement processes. To provide accurate and precise 14C determinations, it was important to correct for isotopic fractionation.
The 13C/12C ratio, expressed as δ13C, was used for this correction. For each benzene sample, ∼5 μL was combusted in a glass tube with copper oxide (CuO), followed by CO2 purification and subsampling with a syringe. CO2 was introduced into a Multiflow device for IRMS measurements using an Isoprime continuous-flow mass spectrometer. Two standards, ANU-sucrose and NBS-22 were used to deduce the linear regression from which different δ13C values were calculated.
The values of 14C concentration were corrected for isotope fractionations using measured δ13C according to equation (Stuiver and Polach Reference Stuiver and Polach1977):
 $${A_{SN}} = {A_S}\left[ {1 - {{2\left( {25 + {{\rm{\delta }}^{13}}{\rm{C}}} \right)} \over {1000}}} \right]$$
A SN is the corrected 14C sample concentration, A S is the measured 14C concentration of the sample.
RESULTS AND DISCUSSION
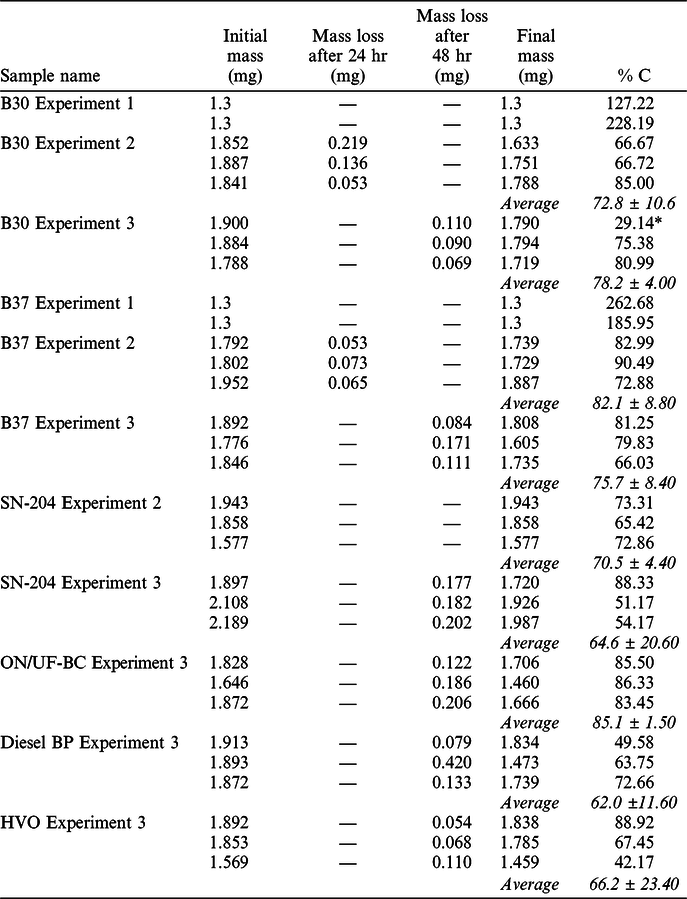
To decide samples for graphitization, six different liquid fuels were subjected to EA combustion to test their carbon compositions. Table 1 gives the carbon concentration data obtained after combusting samples of different masses in three experiments.
Results (% C) of liquid fuels combustion in EA in various experiments (see text). *Result disregarded in average calculations.
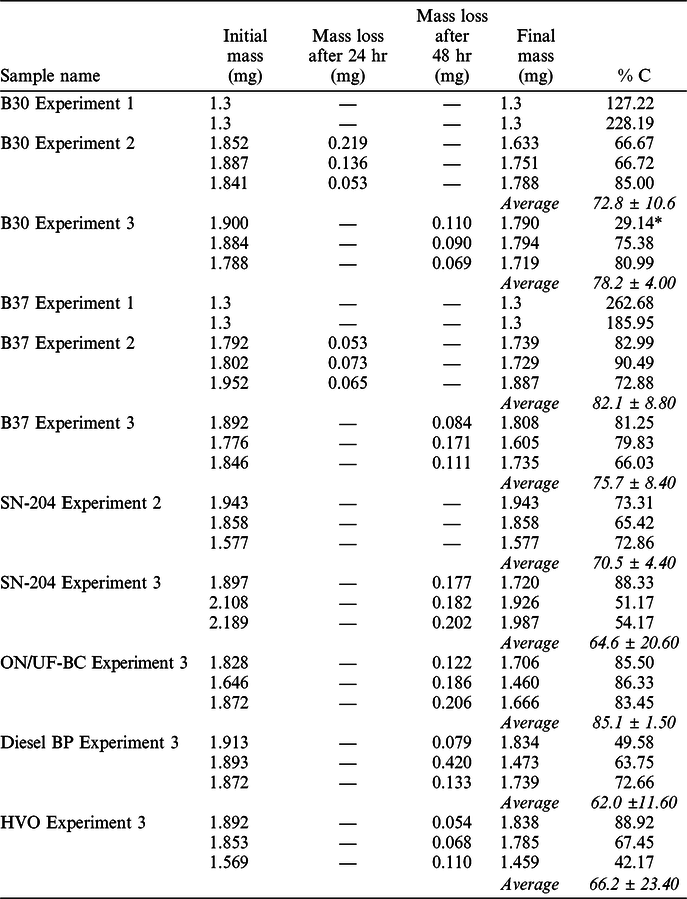
Firstly, experiments were conducted considering the calculated mass. Thus, those carbon concentration results surpassed 100% for all subsamples used in experiment 1, which confirmed those results were not relevant. Based on this, we considered only the weighted mass of the samples. Secondly, fuel samples were combusted by considering the mass of each subsample directly after weighing. Those results showed carbon concentrations of <100% for all samples.
Even so, it did not significantly affect the expected range of sample carbon concentrations, but the calculated concentrations were inconsistent due to weight changes caused by sample residues lost because of small capsule size relative to the point of the pipette used in this subsampling procedure.
Despite the ease of sealing, it was tested to check sample mass changes over time. Different samples kept in the laboratory 24 hr after sealing in tin capsules showed their masses varied by up to 22% (see Table 1) (Santos Arévalo et al. Reference Santos Arévalo, Gómez Martínez, Agulló García, Reina Maldonado and García León2015) reported similar testing procedures. Results for all subsamples showed carbon concentrations of less than 100%. Additionally, there is no relation between the change of mass (evaporated fuel after 24 hr) and measured carbon concentration. The same results occurred for samples kept for 48 hr before EA combustion. Therefore, it was not necessary to monitor sample evaporation but controlling EA cross-contamination by running empty analyses (“RunIn”) and increasing the number of sub-samples was important.
The carbon concentration averages (Experiment 2) were 72.8%, 82.1%, and 70.5% for B30, B37, and SN-204, respectively. The calculated carbon concentrations for experiment 3 were 78.2%, 75.7%, 64.6%, 85.1%, 62.0%, and 66.2% for B30, B37, SN-204, ON/UF-BC, Diesel BP, and HVO, respectively.
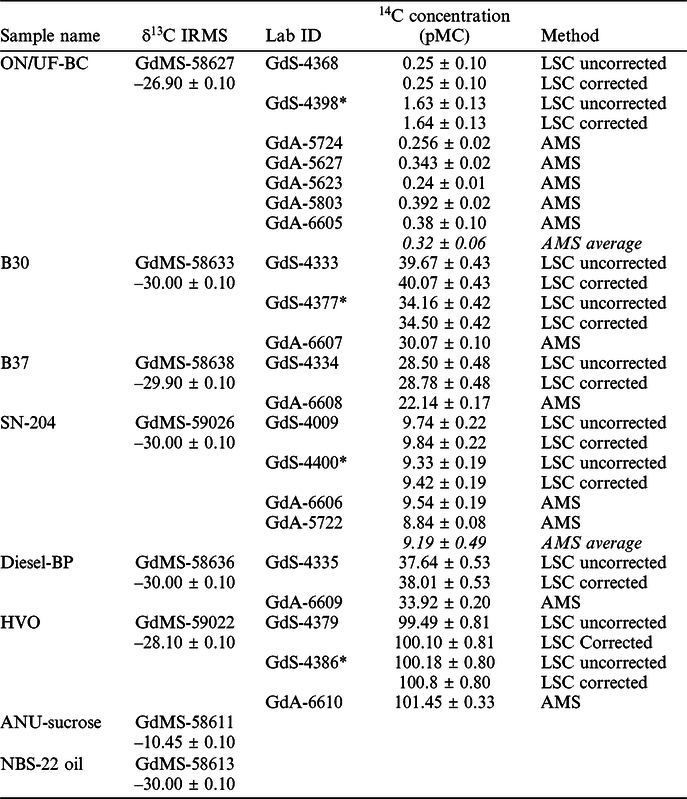
Testing the measurement methods for 14C content were conducted on different liquid fuel samples. Measurements of the (δ13C) isotopic ratio using stable isotopes 13C and 12C for both ANU-sucrose and NBS-22oil standards showed –10.5 and –30‰, respectively. Furthermore, Table 2 shows the results for all fuel samples and ranges from –26.9 to –30‰. The –30‰ was assumed for Diesel BP. The results for all isotope measurements from liquid fuels agreed with both standards (ANU-sucrose and NBS-22oil) and they were used for 14C determination after measurements in the LSC laboratory.
Results of 14C concentration (pMC), and isotopes fractionation (δ13C) measurements.
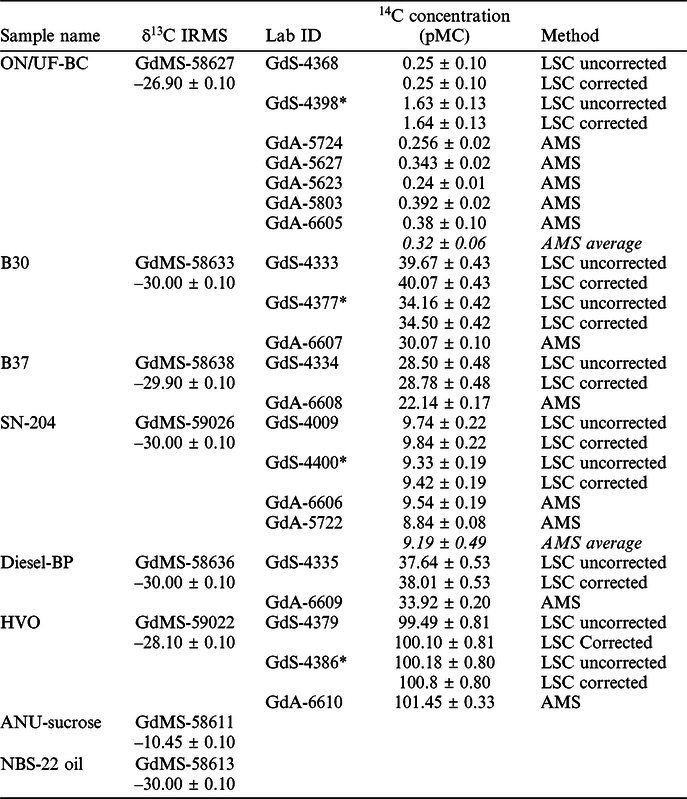
*Resublimated samples.
To test sample contaminations, the 14C content for background sample was first determined. 14C content measured for the background samples (ON/UF-BC) in both AMS and LSC laboratories were 0.32 ± 0.06 pMC (average) and 0.25 ± 0.10 pMC, respectively. The 0.07 difference between AMS and LSC results was satisfactory given the combined uncertainty was 0.12 pMC. Compared to the expected value (0% pMC) and considering the calculated errors, results from both laboratories agreed, and satisfied the level of acceptability. Subsequently, 14C measurements by LSC after radon removal by resublimation showed 1.63 ± 0.13 pMC. The result for resublimed background sample did not correlate with the expected value. This difference may be due to the addition of modern contamination while handling benzene during resublimation. Many steps in this process interact with atmospheric CO2, which affects the background sample.
Furthermore, 14C contents for HVO fuel measured in the LSC laboratory yielded 99.49 ± 0.81pMC for the benzene sample kept for 30 days, and 100.18 ± 0.80 pMC for resublimed benzene. The results corrected for isotope fractionations yielded 100.10 ± 0.81 and 100.8 ± 0.8 pMC values for non-resublimed and resublimed benzene samples, respectively. Both values agreed with the AMS result of 101.45 ± 0.33 pMC.
For SN-204, the measured 14C contents were 9.74 ± 0.22 and 8.84 ± 0.08 pMC by LSC and AMS, respectively. The expected result was between 7–8 pMC. To confirm the AMS measurement results, a second experiment yielded 9.54 ± 0.19 pMC. The average AMS results were 9.19 ± 0.49 pMC, and the difference between LSC was 0.55 ± 0.54 pMC. Also, the δ13C-corrected results for both non-resublimed (9.74 ± 0.22 pMC) and resublimed (9.33 ± 0.19 pMC) samples showed good agreement (difference 0.41 ± 0.29 pMC), meaning these 14C measurement results were in good agreement, given calculated errors and expected SN-204 biocarbon contents.
A comparison of the expected bio-content contents and the consistency of the results obtained via all methods for samples HVO and SN-204 confirmed that resublimation effectively avoided radon contamination.
For B30, the 14C contents in the LSC laboratory were 39.67 ± 0.43 and 34.16 ± 0.40 pMC for benzene samples kept in the laboratory for 30 days and resublimed, respectively. To provide accurate 14C contents, both results were corrected for isotopic fractionations using δ13C. The corrected pMC values were 40.07 ± 0.43 and 34.50 ± 0.40 pMC for non-resublimed and resublimed samples, respectively. In addition, AMS measurement results showed a 30.07 ± 0.10 pMC, as expected, though uncertified bio-carbon content was 30%.
However, in this study, there were no resublimation experiments conducted for both Diesel BP and B37 samples. For both liquid fuels, the benzene samples were retained for 30 days in a freezer to remove radon. 14C measurements from the LSC laboratory showed 14C contents of 37.64 ± 0.53 and 28.50 ± 0.48 pMC for Diesel BP and B37, respectively. Both results were corrected for isotopic fractionation and showed 38.01 ± 0.53 and 28.87 ± 0.48 pMC. AMS measurement results were 33.92 ± 0.20 and 22.14 ± 0.17 pMC for both Diesel BP and B37, respectively. The lowest values were observed for B37 compared to the expected uncertified bio contents of 37%, and the highest pMC values were obtained for Diesel BP.
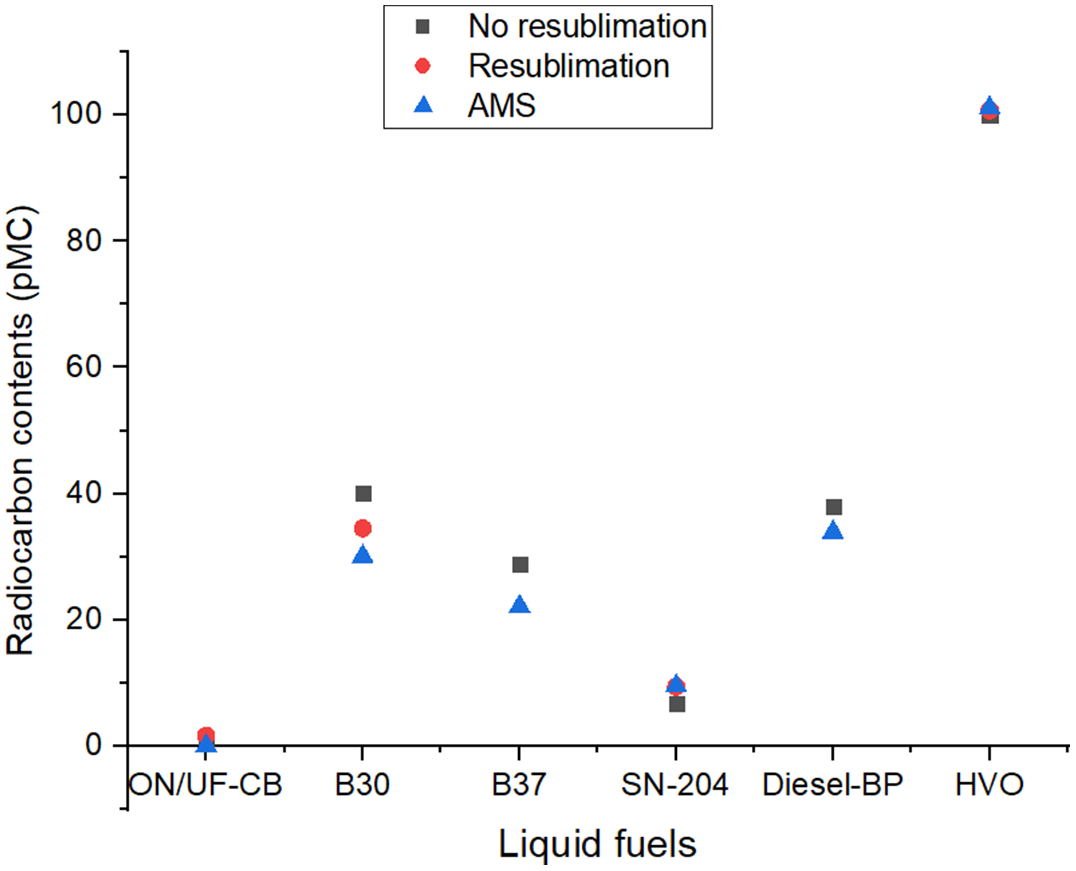
Figure 1 lists all results and shows significant differences for all three samples (results ∼30 pMC for B30, B37, and Diesel BP). There is no good explanation for this phenomenon right now. One reason may be an incomplete reaction with lithium, and we plan to improve the reaction monitoring.
14C contents of tested liquid fuels grouped according to different methods of sample preparation (LSC-non resublimation, LSC-resublimation and AMS).

There is a similarity in factory production for all diesel fuels. Comparing expected bio-content levels, contamination from factory treatment processes may cause these differences. Therefore, additional tests will be conducted to determine a suitable explanation for these changes.
CONCLUSION
Sample preparations for both LSC and AMS methods were tested. Apart from sample loss due to its small size relative to the pipette point, the sealing press was effective. To provide accurate and precise radiocarbon determinations, isotopic ratio variations of (δ13C) using 13C and 12C isotopes were measured by IRMS. Radiocarbon contents (pMC) of background samples measured using both AMS and LSC without resublimed samples confirmed there was no contamination by either sample preparation method. Several factors require consideration in the future to maintain reproducibility for liquid fuel measurements. A complete reaction requires improved control of Li2C2 synthesis. To minimize benzene loss and avoid contamination, vacuum control during resublimation must occur to minimize contact of the sample with atmospheric CO2 and maintain the reproducibility of results. Finally, a new vacuum line is in construction in the Gliwice laboratory to allow combustion experiments with liquids in an oxygen stream.
ACKNOWLEDGMENTS
This research was supported by the SUT subsidy for the maintenance and development of research potential (14/020/BK_21/0007) and a project for young scientists (14/020/BKM21/0014), also by Ministry of Science and Education through a special grant for the Radiocarbon and Mass Spectrometry Laboratory (209848/E-367/SPUB/2018/1). The authors acknowledge all staff from the Gliwice Radiocarbon and Mass Spectrometry Laboratory at the Institute of Physics-CSE. In addition, our thanks go to Poznań Radiocarbon Laboratory for cooperation in AMS measurements.