





Introduction
Bipolar disorder (BD) is a severe neuropsychiatric disorder marked by alternating episodes of mania and depression, with symptom-free periods of euthymia in between (Harrison, Geddes, & Tunbridge, Reference Harrison, Geddes and Tunbridge2018). The latest World Mental Health surveys conducted between 2001 and 2022 reported that the lifetime prevalence of BD is approximately 2% (McGrath et al., Reference McGrath, Al-Hamzawi, Alonso, Altwaijri, Andrade, Bromet and Zaslavsky2023; Nierenberg et al., Reference Nierenberg, Agustini, Köhler-Forsberg, Cusin, Katz, Sylvia and Berk2023). The probability of first onset of BD peaked at around 15 years, with the median age of onset being approximately 20 years (McGrath et al., Reference McGrath, Al-Hamzawi, Alonso, Altwaijri, Andrade, Bromet and Zaslavsky2023). When BD first emerges during childhood or pre-adolescence, it is referred to as pediatric bipolar disorder (PBD) (Harrison et al., Reference Harrison, Geddes and Tunbridge2018).
BD is considered a disconnection syndrome (Perry, Roberts, Mitchell, & Breakspear, Reference Perry, Roberts, Mitchell and Breakspear2019; Sha, Wager, Mechelli, & He, Reference Sha, Wager, Mechelli and He2019), due to disruptions in large-scale networks, as assessed by resting-state functional magnetic resonance imaging (rs-fMRI) (Wu et al., Reference Wu, Su, Li, Zhu, Li, Li and Si2023). These disruptions can be further understood by the triple network model, which comprises the default mode (DMN), salience (SN), and central executive (CEN) networks and has been suggested to underlie the pathogenesis of BD (Menon, Reference Menon2011; Zhang et al., Reference Zhang, Bo, Li, Zhao, Wang, Liu and Zhou2022). Abnormal information flow within the CEN and between the CEN and SN is thought to contribute to the working memory deficits frequently observed in BD patients (Dima, Roberts, & Frangou, Reference Dima, Roberts and Frangou2016). In addition, hyperactivity in the DMN has been linked to suppressing task-irrelevant activity during cognitive performance tasks (Zarp Petersen et al., Reference Zarp Petersen, Varo, Skovsen, Ott, Kjærstad, Vieta and Miskowiak2022). Indeed, the model proposes that SN is responsible for switching between the DMN and CEN (Goulden et al., Reference Goulden, Khusnulina, Davis, Bracewell, Bokde, McNulty and Mullins2014). For example, the decreased connectivity between the anterior cingulate cortex (ACC) and insula in SN leads to the abnormal activation of CEN, which compromises cognition and goal-directed behaviors (Menon, Reference Menon2011). These dysfunctional patterns of connectivity are a recognized cause of cognitive deficits in various neuropsychiatric disorders, such as BD, schizophrenia, depression, anxiety, dementia, and autism (Sha et al., Reference Sha, Wager, Mechelli and He2019). However, this model remains under explained for the state switching in BD.
Recent research has identified the limbic network (LN) as a core site of pathological alterations in BD, suggesting that disruptions in the LN, along with frontal brain regions, play a central role in both cognitive and emotional dysfunctions (Mesbah et al., Reference Mesbah, Koenders, Van Der Wee, Giltay, Van Hemert and De Leeuw2023). Specifically, aberrant interactions between the triple network and LN provide crucial insights into BD symptoms. However, the interaction mechanisms between the LN and the triple network model in PBD remain unclear. Magioncalda and Martino (Reference Magioncalda and Martino2022) emphasized that the aberrations in LN trigger abnormal subcortical-cortical coupling, further destabilizing network balance. This process contributes to abnormalities in various dimensions of affectivity, thought, and psychomotor function in different states of BD (Martino & Magioncalda, Reference Martino and Magioncalda2022). Several studies have provided tentative evidence for a top-down pathological alteration from the triple networks toward the LN. Specifically, patients in remission show hyperconnectivity between the ACC/ventromedial PFC (vmPFC) and the LN (Blond, Fredericks, & Blumberg, Reference Blond, Fredericks and Blumberg2012; Blumberg et al., Reference Blumberg, Donegan, Sanislow, Collins, Lacadie, Skudlarski and Krystal2005), while patients in the acute phase show hyperconnectivity between the ACC/dorsomedial prefrontal cortex (dmPFC) and the LN (Gusnard, Akbudak, Shulman, & Raichle, Reference Gusnard, Akbudak, Shulman and Raichle2001). Most previous studies were based on functional connectivity quantifying statistical dependencies, yet these methods do not explain the causal mechanisms of interaction.
A deeper understanding of the causal interactions between the triple network and LN is essential for clarifying the underlying pathological processes in BD. Considering that childhood and adolescence are the time of increased vulnerability to BD (McGrath et al., Reference McGrath, Al-Hamzawi, Alonso, Altwaijri, Andrade, Bromet and Zaslavsky2023) and the development and maturation of brain intrinsic networks (Ahmed, Bittencourt-Hewitt, & Sebastian, Reference Ahmed, Bittencourt-Hewitt and Sebastian2015), investigating the interaction mechanism of the triple network and LN in PBD is particularly important.
Based on the above, we propose that a quadruple network mechanism, integrating the triple network and the LN, underpins the pathology of PBD. The interaction between these networks could be disentangled into top-down and bottom-up processes using spectral dynamic causal modelling (spDCM) (Sabaroedin et al., Reference Sabaroedin, Razi, Chopra, Tran, Pozaruk, Chen and Fornito2023), shedding light on the debated interactions between the triple network and the LN. Furthermore, parametric empirical Bayes (PEB) can reveal distinct network connections between PBD patients and healthy controls. What's more, PEB can identify different connections between PBD and healthy control (HC) groups (Zeidman et al., Reference Zeidman, Jafarian, Corbin, Seghier, Razi, Price and Friston2019a, Reference Zeidman, Jafarian, Seghier, Litvak, Cagnan, Price and Friston2019b), as well as connections associated with symptom severity (Bouziane, Das, Friston, Caballero-Gaudes, & Ray, Reference Bouziane, Das, Friston, Caballero-Gaudes and Ray2022). We hypothesize that (1) the bottom-up connections from LN to triple networks may represent trait-associated characteristics of PBD, as compared to HC, and (2) top-down connections from triple networks to LN may be associated with symptom-related factors.
Methods and materials
Dataset and participants
Adolescents diagnosed with BD (N = 92; age 11–21) (Sawyer, Azzopardi, Wickremarathne, & Patton, Reference Sawyer, Azzopardi, Wickremarathne and Patton2018; Van Meter, Moreira, & Youngstrom, Reference Van Meter, Moreira and Youngstrom2011), were recruited from child and Adolescent Psychiatry Clinics. Age- and sex-matched HC adolescents (N = 40) were recruited primarily from public schools through advertisements. Specific exclusion criteria can be found in the supplementary material. All participants were fully informed of the procedures, and their guardians provided informed consent. This study was approved by the local research ethics board (NJNU-2019-SYLL-018). Licenced child-adolescent psychiatrists conducted semi-structured diagnostic interviews for all participants using the Affective Disorders and Schizophrenia Scale for School-Age Children-Present and Lifetime Version (K-SADS-PL). All diagnoses were confirmed based on DSM-IV criteria.
Demographic and clinical assessments were performed on the same day as neuroimaging. Data was acquired from two sites with different protocols: the Xiangya Second Hospital (XYH) protocol at the Pediatric Psychiatry Clinic of Changsha Xiangya Second Hospital, Hunan province (53PBD, 21HC), and the Nanjing Brain Hospital (NBH) protocol at the Nanjing Brain Hospital Affiliated to Nanjing Medical University in Jiangsu (39PBD, 19HC).
Medication and comorbidity
Across both sites, 49 participants were treated with one or more of the following medications: lithium, valproate, second-generation antipsychotics, and antidepressants. Reported comorbidities included attention deficit hyperactivity disorder (ADHD, N = 7), oppositional defiant disorder (ODD, N = 5), generalized anxiety disorder (GAD, N = 3), and borderline personality disorder (BPD, N = 1).
Clinical assessments
The Mood and Feelings Questionnaire (MFQ) and the Young Mania Rating Scale (YMRS) were used to assess depression and manic symptoms in 53 patients at XYH and 3 patients at NBH, respectively. For the remaining 36 patients at NBH, the Hamilton Depression Scale (HAMD) and the Mood Disorder Questionnaire (MDQ) were used to evaluate depressive and manic symptoms, respectively. To maintain the original distribution of scores, Min-Max Normalization (Jain, Nandakumar, & Ross, Reference Jain, Nandakumar and Ross2005) was applied to standardize depression and manic scores across a common range. This normalization process was implemented in MATLAB using the code provided by Friedman and Komogortsev (Reference Friedman and Komogortsev2019).
MRI data acquisition
During the MRI scans, participants were instructed to relax, remain still with closed eyes, and stay awake. Foam padding was used to minimize head movement. MRI data were collected from a 3 T Siemens scanner at the Magnetic Resonance Centers of both NBH and XYH. The parameters for the functional images were as follows: repetition time (TR) = 2000 ms, echo time (TE) = 30 ms, 30 slices, slice thickness = 4.00 mm, gap = 0.4 mm, field of view (FOV) = 240 × 240 mm, matrix size = 64 × 64, and flip angle = 90°. The scan lasted 500 s, capturing 250 volumes at NBH and 240 at XYH.
Preprocessing of rs-fMRI
Preprocessing was performed using DPABI V7.0 (Yan, Wang, Zuo, & Zang, Reference Yan, Wang, Zuo and Zang2016), as follows. The first 10 or 20 images (for NBH and XYH, respectively) of each rs-fMRI session were discarded to ensure steady-state longitudinal magnetization, leaving 230 rs-fMRI volumes for analysis. First, resting-state fMRI images were slice-timing corrected using the central slice of each volume as the reference. Next, images were realigned to the first functional volume of each session. After realignment, functional and structural T1 images were manually corregistered and transformed from the individual native space to the standard Montreal Neurological Institute (MNI) space. The generated images were spatially smoothed with a Gaussian kernel of 6 mm at full width at half-maximum. The resulting fMRI data were linearly trend removed and band-pass (0.0078–0.1 Hz) filtered to reduce low-frequency drift and high-frequency noise (Almgren et al., Reference Almgren, Van De Steen, Kühn, Razi, Friston and Marinazzo2018). Subsequently, micro-head motion effects were regressed using the Friston-24 head motion parameter model. Mean signals from white matter and cerebrospinal fluid nuisance variables were removed from the preprocessed time courses by multiple linear regression analysis using the SPM12 software package (www.fil.ion.ucl.ac.uk/spm/software/spm12).
For functional connectivity analyses of resting state data, it is crucial to regress out motion and physiological parameters. However, this step is not required for independent component analysis (ICA) since it separates motion and physiological noise as independent components (Goulden et al., Reference Goulden, Khusnulina, Davis, Bracewell, Bokde, McNulty and Mullins2014).
Independent component analysis
Independent component analysis (ICA) was carried out using the Group ICA of fMRI toolbox (GIFT, http://mialab.mrn.org/software/gift/) to identify independent components (ICs) across all 132 participants. Dimension estimation was conducted using the minimum description length criterion (Jafri, Pearlson, Stevens, & Calhoun, Reference Jafri, Pearlson, Stevens and Calhoun2008), to determine the optimal number of ICs for the datasets from the three groups. A template-matching procedure was then employed to select the components with the highest spatial correlation to the DMN, CEN, SN, and LN.
The GIFT toolbox provides Resting State Network (RSN) templates derived from resting-state data. DMN, SN, and CEN templates were obtained from the Functional Imaging Unit at the Neuropsychiatric Disorders Laboratory at Stanford University, California (http://findlab.stanford.edu/functional_ROIs). In line with previous studies (Bryant et al., Reference Bryant, Felmingham, Kemp, Barton, Peduto, Rennie and Williams2005; Tost et al., Reference Tost, Kolachana, Hakimi, Lemaitre, Verchinski, Mattay and Meyer-Lindenberg2010), the LN template was constructed using the Wake Forest University (WFU) PickAtlas utility (http://www.fmri.wfubmc.edu/). This LN template included key regions such as the temporal pole, orbitofrontal cortex (OFC) (Schaefer et al., Reference Schaefer, Kong, Gordon, Laumann, Zuo, Holmes and Yeo2018); hippocampus, amygdala, parahippocampus, and striatum (Catani, Dell'Acqua, & Thiebaut De Schotten, Reference Catani, Dell'Acqua and Thiebaut De Schotten2013).
To visualize the spatial distribution of each network's independent components across participants, one-sample t tests were conducted using SPM12 (http://www.fil.ion.ucl.ac.uk/spm/).
Dynamic causal modeling
DCM estimates the causal architecture (effective connectivity) of distributed neuronal responses from observed BOLD (Blood-Oxygen-Level-Dependent) signals recorded from fMRI.
For the preprocessed rs-fMRI data, fully connected intrinsic DCMs were specified in SPM12 (v7771) (http://www.fil.ion.ucl.ac.uk/spm,spm_dcm_specify.m) using 18 regions of interest (ROIs), with 6 mm radius spheres centered on the ICA-derived MNI coordinates. ComBat harmonization (Fortin et al., Reference Fortin, Parker, Tunç, Watanabe, Elliott, Ruparel and Shinohara2017, Reference Fortin, Cullen, Sheline, Taylor, Aselcioglu, Cook and Shinohara2018; Johnson, Li, & Rabinovic, Reference Johnson, Li and Rabinovic2007) was applied to correct for scanner site effects on the DCM indices after model specification.
After extracting the rs-fMRI time series from the ROIs, we used cross-spectral DCM (Zeidman et al., Reference Zeidman, Jafarian, Corbin, Seghier, Razi, Price and Friston2019a; spm_dcm_fit.m) to estimate each subject's pairwise effective connectivity. The theoretical foundation and optimization process of DCM are provided in the supplementary materials. We performed a diagnostic test for each DCM (spm_dcm_fmri_check.m) to evaluate both model convergence and accuracy of the model inversion by assessing the percentage of variance explained by the DCM model when fitted to the observed cross-spectral data. All models showed reliable results, with no participant having less than 10% variance explained (Zeidman et al., Reference Zeidman, Jafarian, Corbin, Seghier, Razi, Price and Friston2019a).
PEB for group DCM
After inverting each subject's fully connected DCM, a Parametric Empirical Bayes (PEB) analysis was conducted to estimate group-level effective connectivity (EC), group differences, and the linear relationship between symptom severity reports and each EC link (Zeidman et al., Reference Zeidman, Jafarian, Seghier, Litvak, Cagnan, Price and Friston2019b; spm_dcm_peb.m). This was done using a general linear model (GLM) based on subject-specific parameters. The expected values and the associated uncertainty (posterior covariance) of the parameters for each connection were then analyzed at the between-subject or group level (Zeidman et al., Reference Zeidman, Jafarian, Seghier, Litvak, Cagnan, Price and Friston2019b). Further details of these analyses are provided in the supplementary materials.
To assess effective connectivity strength from a network perspective, Bayesian contrasts were used to compute the averaged network ECs, taking into account the full posterior distribution of each EC parameter rather than relying on the arithmetic mean of parameter expectations (Nicenboim, Schad, & Vasishth, Reference Nicenboim, Schad and Vasishth2023, https://github.com/bnicenboim/bcogsci). This approach was also applied in previous studies (Zhang et al., Reference Zhang, Bo, Li, Zhao, Wang, Liu and Zhou2022; Zhou et al., Reference Zhou, Friston, Zeidman, Chen, Li and Razi2018). Please see the supplementary for specific procedure.
Leave-one-out cross validation analysis
We tested whether depression and mania scores, as well as group differences, could be predicted from subject-specific estimates of effective connectivity (EC) using a leave-one-out cross-validation (LOOCV) analysis (Friston et al., Reference Friston, Litvak, Oswal, Razi, Stephan, Van Wijk and Zeidman2016; Zeidman et al., Reference Zeidman, Jafarian, Seghier, Litvak, Cagnan, Price and Friston2019b), implemented in SPM12 (spm_dcm_loo.m). To focus on the EC parameters with the strongest evidence of being non-zero, we applied a threshold of 95% posterior probability for inclusion, following previous approaches. The parameters were estimated using Bayesian Model Averaging (BMA); further details can be found in the supplementary materials. In each iteration, one participant was left out, and a PEB model was inverted to predict the left-out subject's score based on the selected EC connections (Bouziane et al., Reference Bouziane, Das, Friston, Caballero-Gaudes and Ray2022).
NeuroSynth
Cognitive terms associated with the brain regions most predictive in the LOOCV analysis were identified using the NeuroSynth database based on a set of 400 topic terms (https://github.com/neurosynth/neurosynth). An automated parsing method, relying on multiple association metrics, was applied to extract psychological and cognitive terms from this pool. The results were organized using a posterior probability matrix (Lu et al., Reference Lu, Towne, Lock, Jiang, Cheng, Habes and Zang2022).
Results
Demographic variables
Table 1 summarizes the demographic and clinical characteristics of the participants. There were no significant differences in age or gender distribution between the PBD and HC groups.
Demographic and clinical characteristics of participants
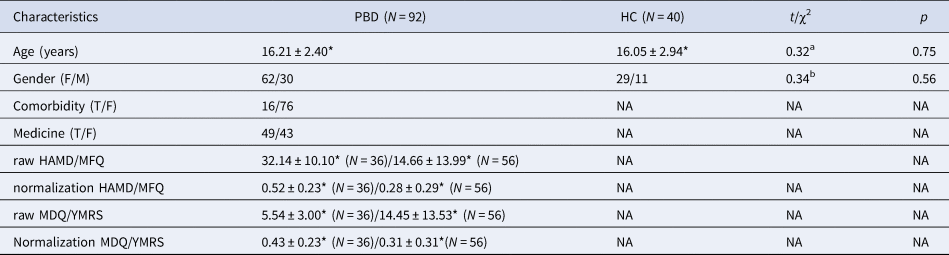
Abbreviation: PBD, Pediatric Bipolar Disorder; HC, healthy control; HAMD, Hamilton depression scale; MDQ, Mood Disorder Questionnaire; MFQ, Mood and Feelings Questionnaire; YMRS, Young Mania Rating Scale.
*Mean ± s.d.
a The p value was obtained by a two-sample t test.
b The p value was obtained by a χ2 test.
Resting state network spatial distribution map
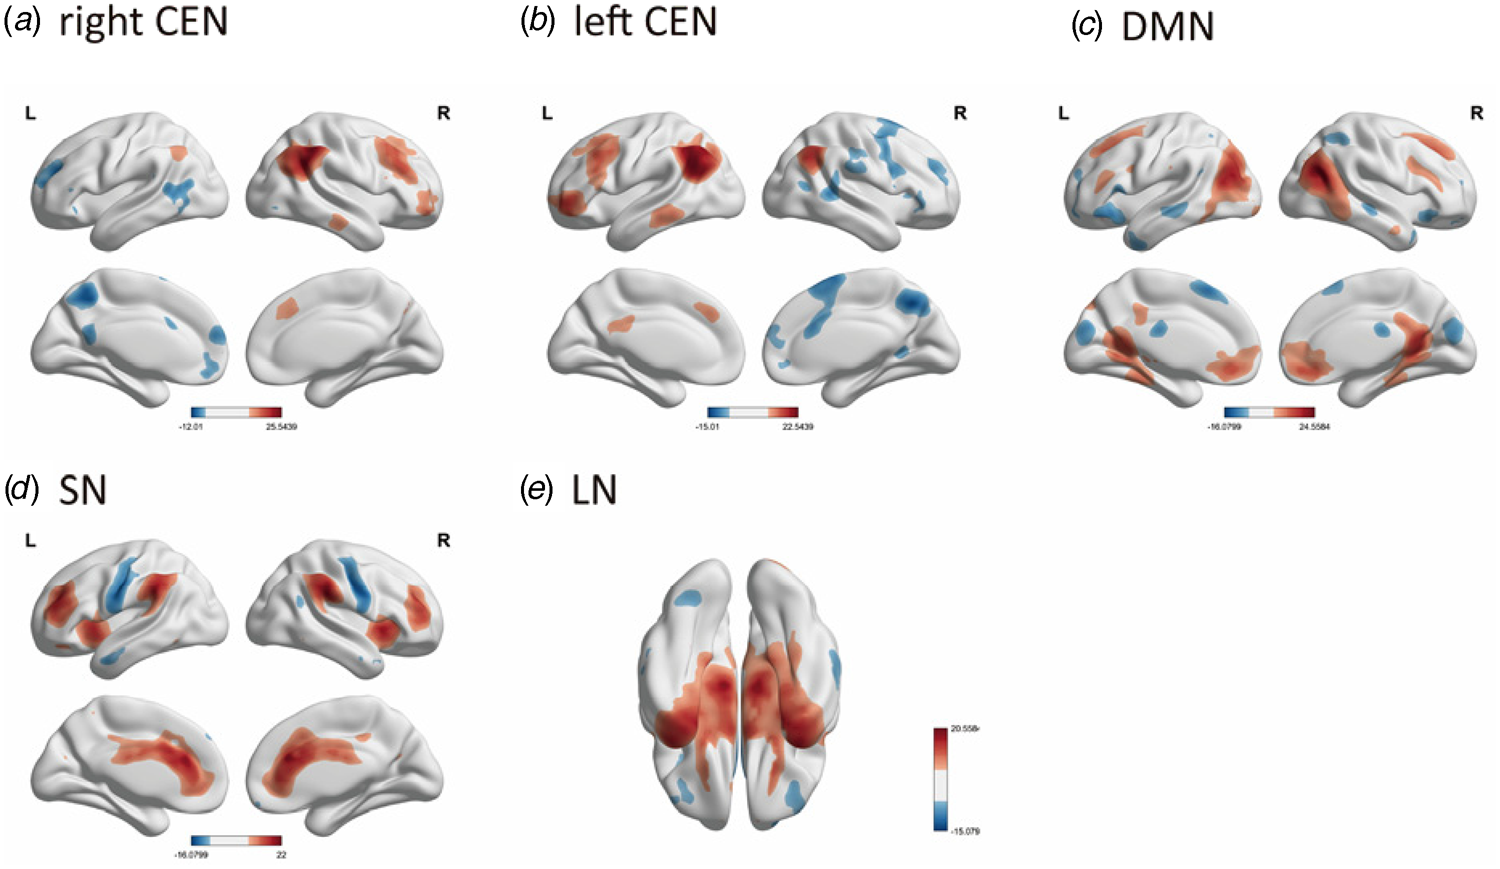
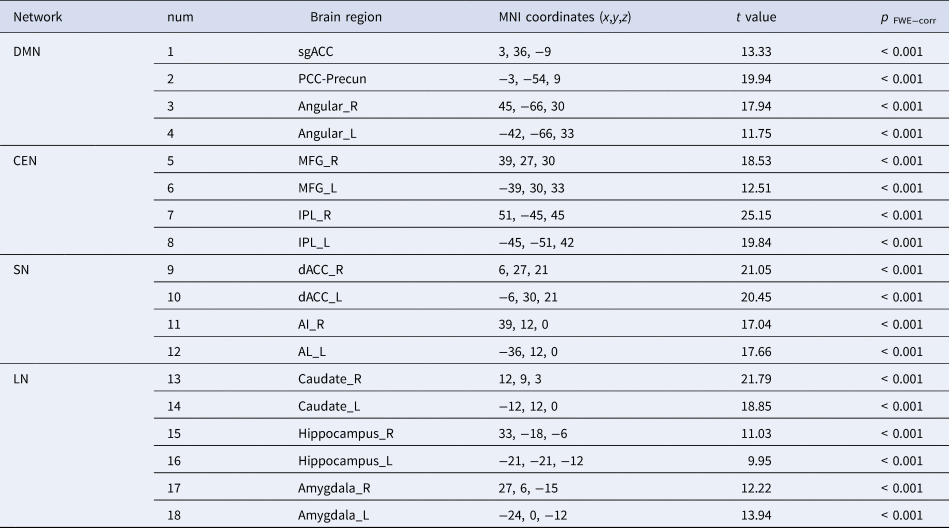
ICA revealed 25 independent components, five of which were identified as corresponding to the DMN (r = 0.47), left and right CEN (r = 0.37 for both), SN (r = 0.42), and LN (r = 0.19), based on template matching analysis. The spatial distribution of these five RSNs was illustrated by the results of a one-sample t test (Fig. 1). The DMN ROIs consisted of subgenual ACC (sgACC, anterior DMN), angular and combined posterior cingulate cortex-precuneus (PCC-Precun) (posterior DMN), according to Clancy et al. (Reference Clancy, Devignes, Kumar, May, Hammack, Akman and Rosso2023); Yokoyama et al. (Reference Yokoyama, Okamoto, Takagaki, Okada, Takamura, Mori and Yamawaki2018); Zhang and Raichle (Reference Zhang and Raichle2010). The ROIs of the CEN were located in dorsolateral frontal (including middle frontal gyrus, MFG) and parietal (including parietal lobule, IPL) neocortices (Feng et al., Reference Feng, Eickhoff, Li, Wang, Becker, Camilleri and Luo2021; Liu et al., Reference Liu, Jiao, Zhong, Hao, Wang, Xu and Wang2021; Seeley et al., Reference Seeley, Menon, Schatzberg, Keller, Glover, Kenna and Greicius2007). The SN was anchored by the dorsal ACC (dACC) and the anterior insula (AI) (Hogeveen, Krug, Elliott, & Solomon, Reference Hogeveen, Krug, Elliott and Solomon2018; Seeley et al., Reference Seeley, Menon, Schatzberg, Keller, Glover, Kenna and Greicius2007). The LN included the hippocampus, amygdala, and caudate (Lim et al., Reference Lim, Baldessarini, Vieta, Yucel, Bora and Sim2013; Ong et al., Reference Ong, Walterfang, Malhi, Styner, Velakoulis and Pantelis2012). The key brain regions included in each network are listed in Table 2.
Results of one-sample t test in 5 RSNs of all subjects, shown by BrainNet Viewer. (a), (b), (c), (d), AND (e) respectively demonstrates the DMN, left/right CEN, SN, LN (p < 0.05, FEW corrected).
The peak MNI coordinates of the 18 group-level regions of interest
Similarity and group comparison of the causal connections across HCs and PBDs
The group-mean effective connectivity results are shown in panels A and B(a) of Fig. 2 (free energy threshold, Bayesian posterior probability > 0.95). In the triple network model, the connections between the CEN and DMN and from the CEN to the SN were generally inhibitory. Specifically, inhibitory connections were observed from the right MFG to the sgACC and dACC, from the left IPL to the right angular gyrus, and from the PCC-Precun to the IPL. In contrast, connections between the DMN and LN, the CEN and LN, and the SN and LN shared similar excitatory patterns, suggesting that the triple networks may interact collectively with the LN.
Effective connectivity.
Panel A shows the group-common and group-differences effects of EC (Hz) where the posterior probability exceeds 95% (strong evidence). Panel B shows the mean effective connectivity values from Panel A, viewed from a network perspective and calculated using Bayesian contrast, with an estimated error of less than 0.05. Panel C shows the relationship between symptom severity and EC in the PBD group (N = 92), where the posterior probability is greater than 95% (strong evidence). Panel D represents symptom severity associated with the averaged EC in PBD, computed through Bayesian contrast, with an estimated error of less than 0.05.
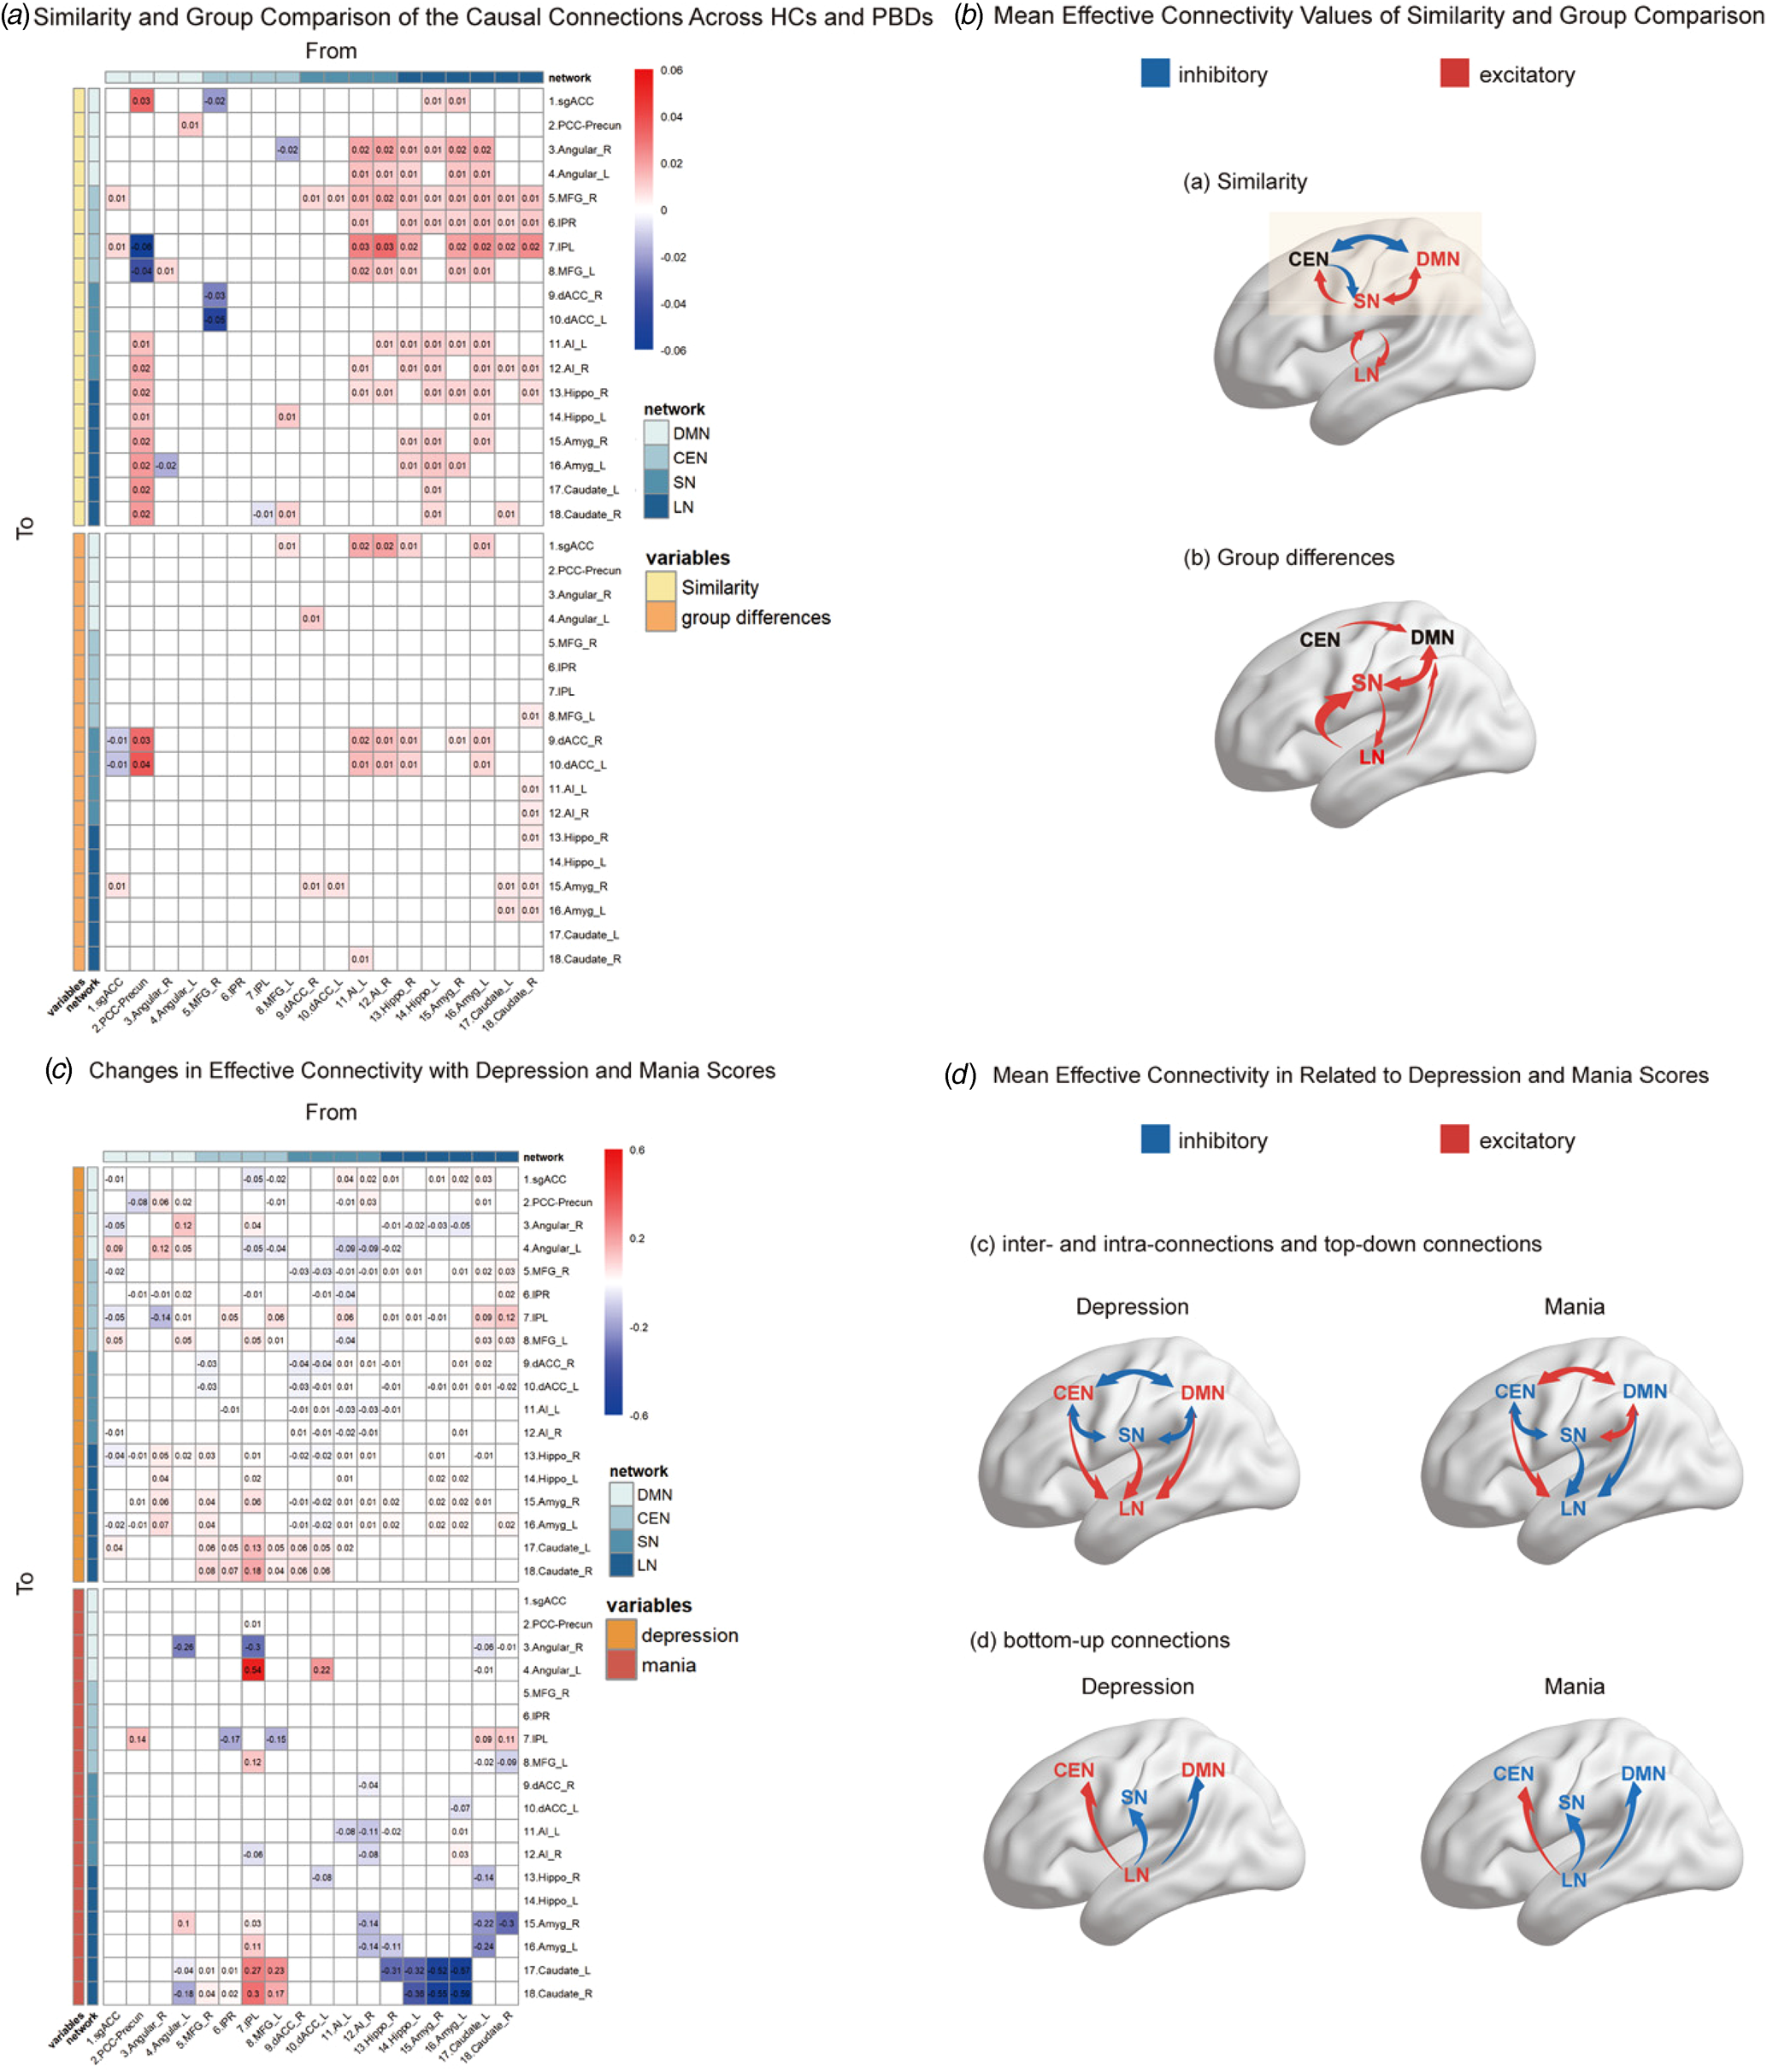
Panels A and B(b) of Fig. 2 (free energy threshold, 95%) show group-specific differences in effective connectivity. In the PBD group, dysfunctional connections were observed from the LN to the SN, within the SN, and between the DMN and SN.
Changes in effective connectivity with depression and mania scores
Panel C of Fig. 2 shows the specific connections significantly associated with depression and mania scores. To visualize the changes at the network level, average values within each submatrix were calculated using Bayesian contrasts (see panel D of Fig. 2).
In subjects with higher depression severity, connections within the CEN, DMN, and LN were more excitatory, while inter-network connections among the triple networks were more inhibitory. Additionally, connections from the triple networks to the LN were more excitatory. In contrast, patients with higher mania scores exhibited an almost opposite polarity (see panel D(c) of Fig. 2).
Both manic and depressive symptoms showed a similar pattern in terms of LN-to-triple network connections. Specifically, the LN exerted inhibitory effects on the DMN and SN but excitatory effects on the CEN, as shown in panel D(d) of Fig. 2.
Cross validation
In the LOOCV of all connections significantly associated with depression or mania scores or showing significant group differences, several connections were found to predict depression and mania scores, as well as group differences, at a significance level of α = 0.05 (see online Supplementary SI Table S2, Fig. 3). The dysconnectivity circuits in PBD, compared to HCs, were predominantly related to the LN, which accounted for 3/4 of the significant connections.
The results of LOOCV.
Left panel: Several connections were found to predict depression and mania scores, and group differences at a significant level of α = 0.05.
Right panel: Distributions of certain ECs with significant prediction ability. (a) Shows the excitatory EC from the left Amygdala to the right dACC in HC and PBD groups. (b) Relationship between excitatory EC from left hippocampus to MFG and depression scores. The scatter points and regression line (90% confidence interval, shaded area) depict the association. (c) Relationship between inhibitory EC from right caudate to right angular and mania scores, illustrated by scatter points, regression line, and 90% confidence interval.
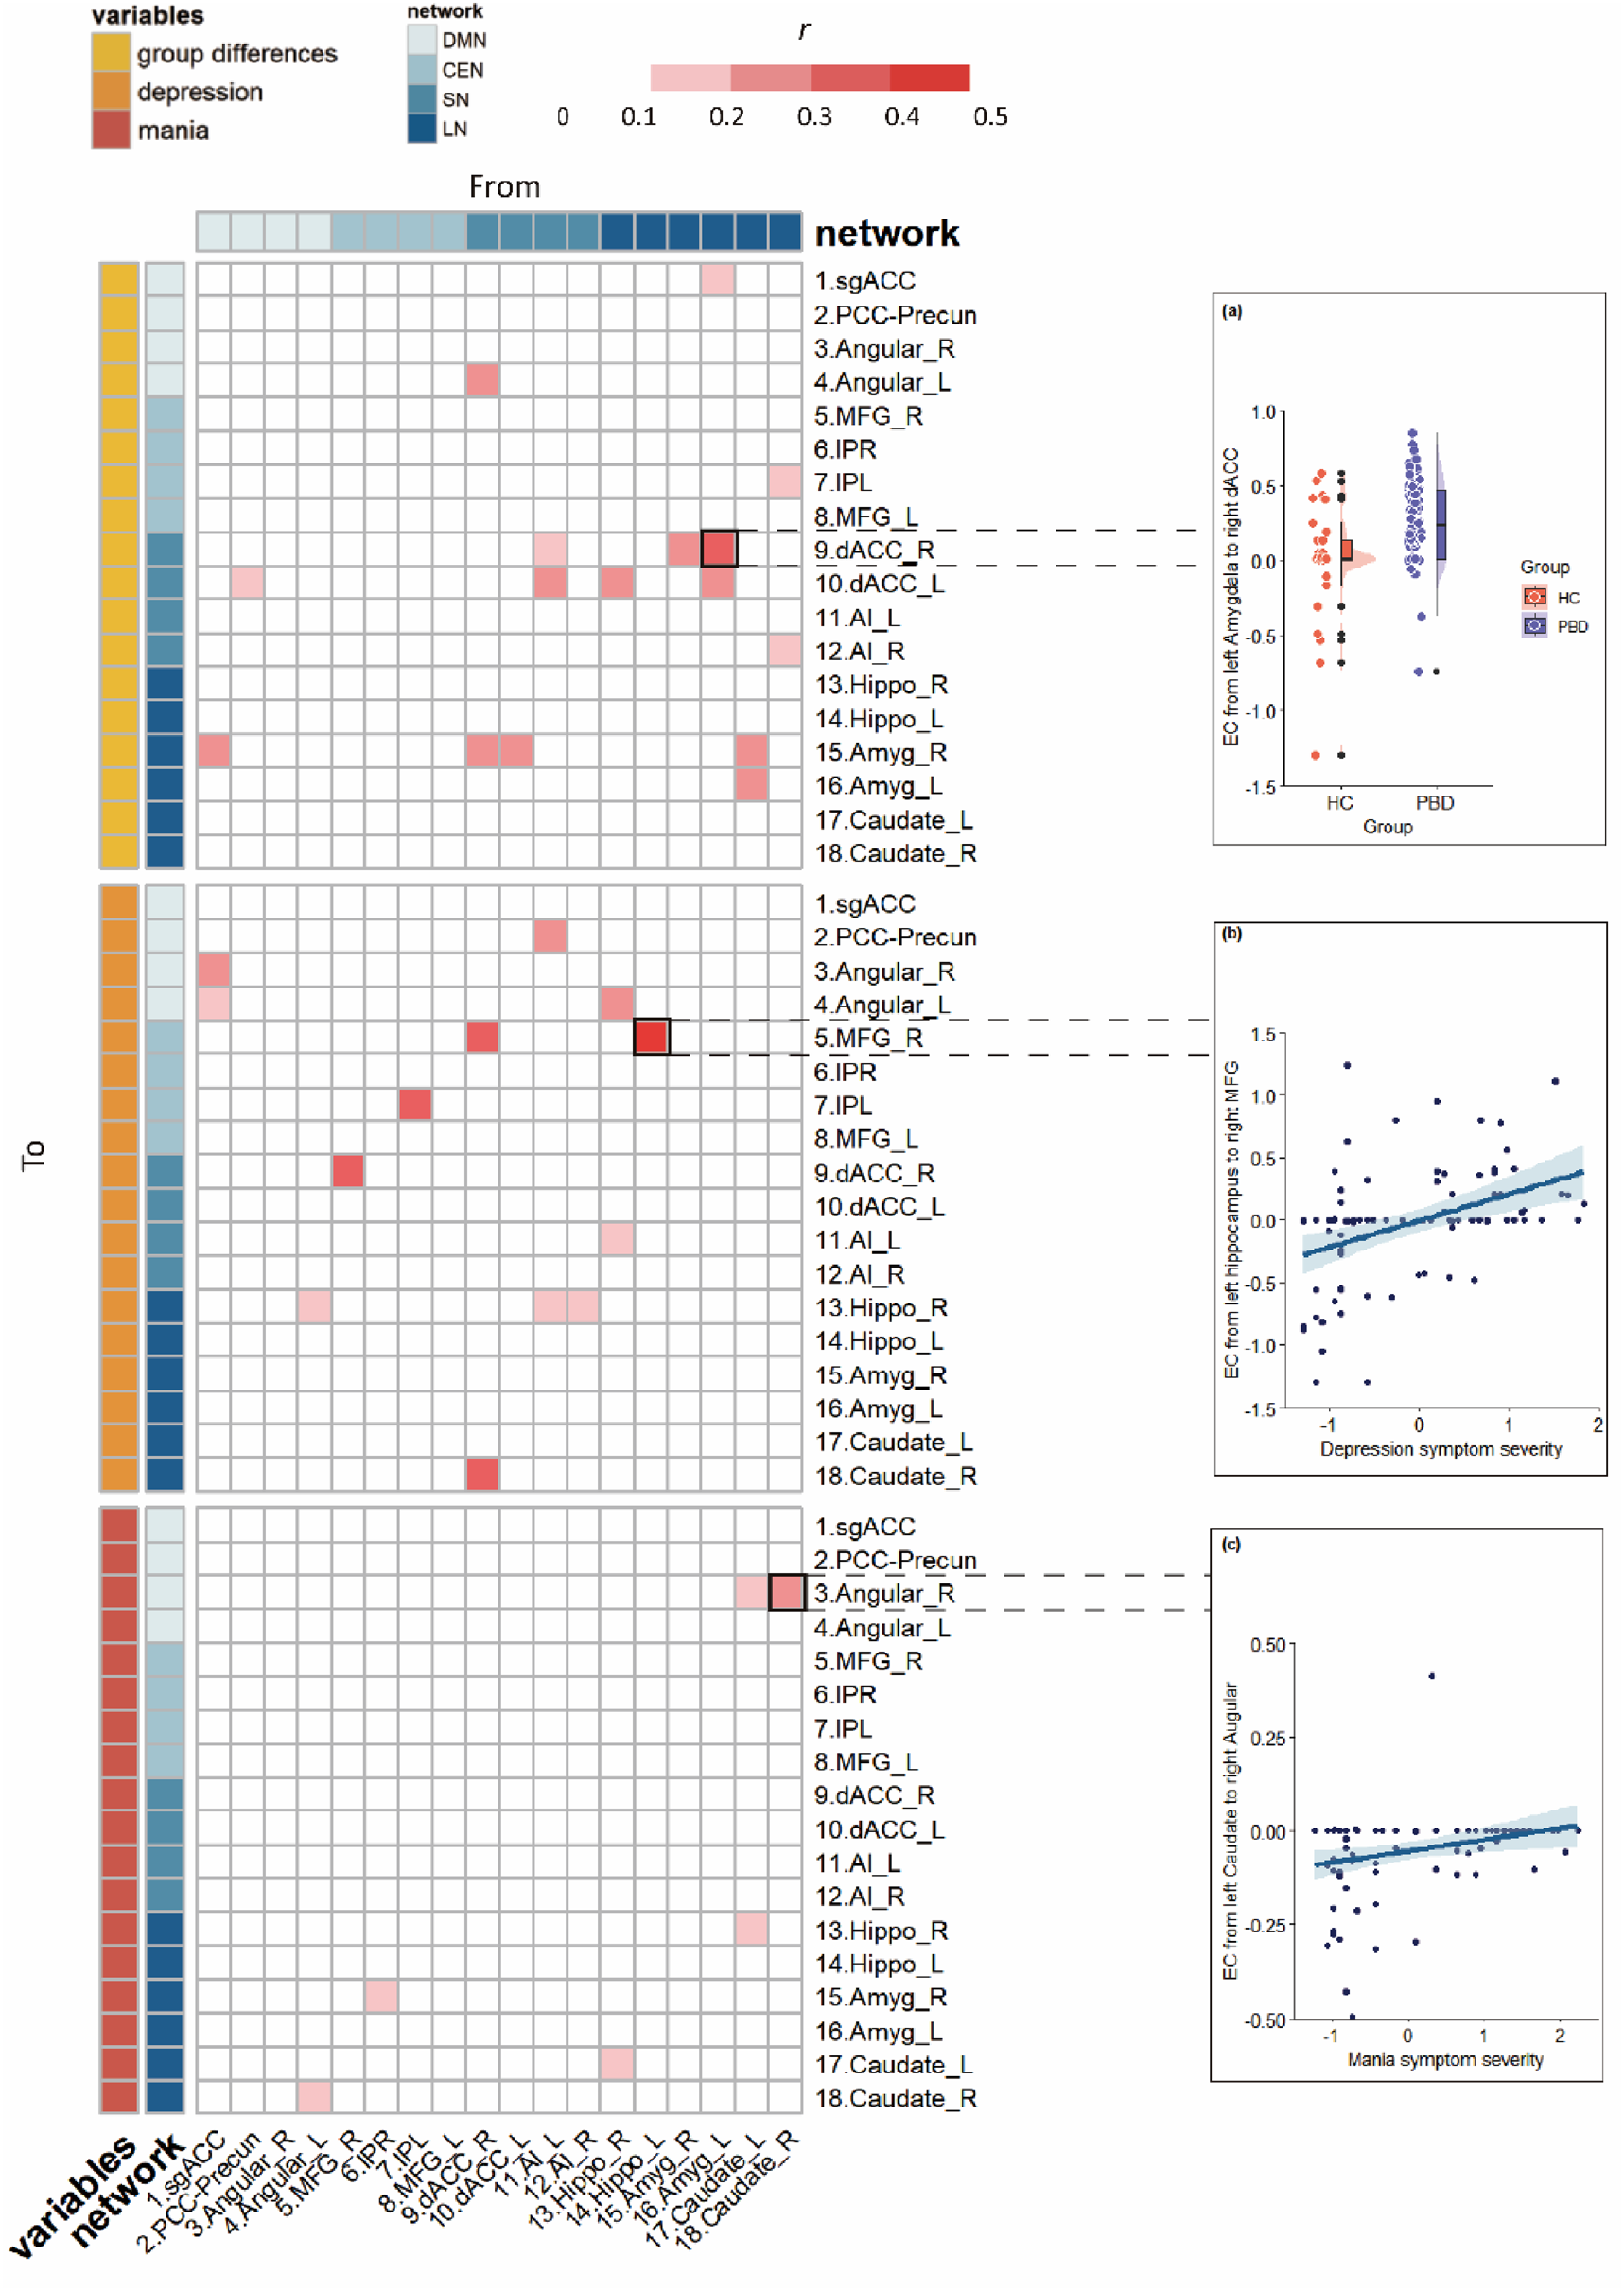
The LOOCV analysis for predicting mania severity revealed that 5 out of 6 connections were associated with the caudate, involving mutually inhibitory relationships between the caudate and angular gyrus, as well as between the caudate and hippocampus. Similarly, the LOOCV analysis for predicting depression severity indicated that the hippocampus was the only region with abnormal connectivity across all three networks (see online Supplementary Fig. S1).
Meta-analysis cognitive terms relevant to caudate and hippocampus
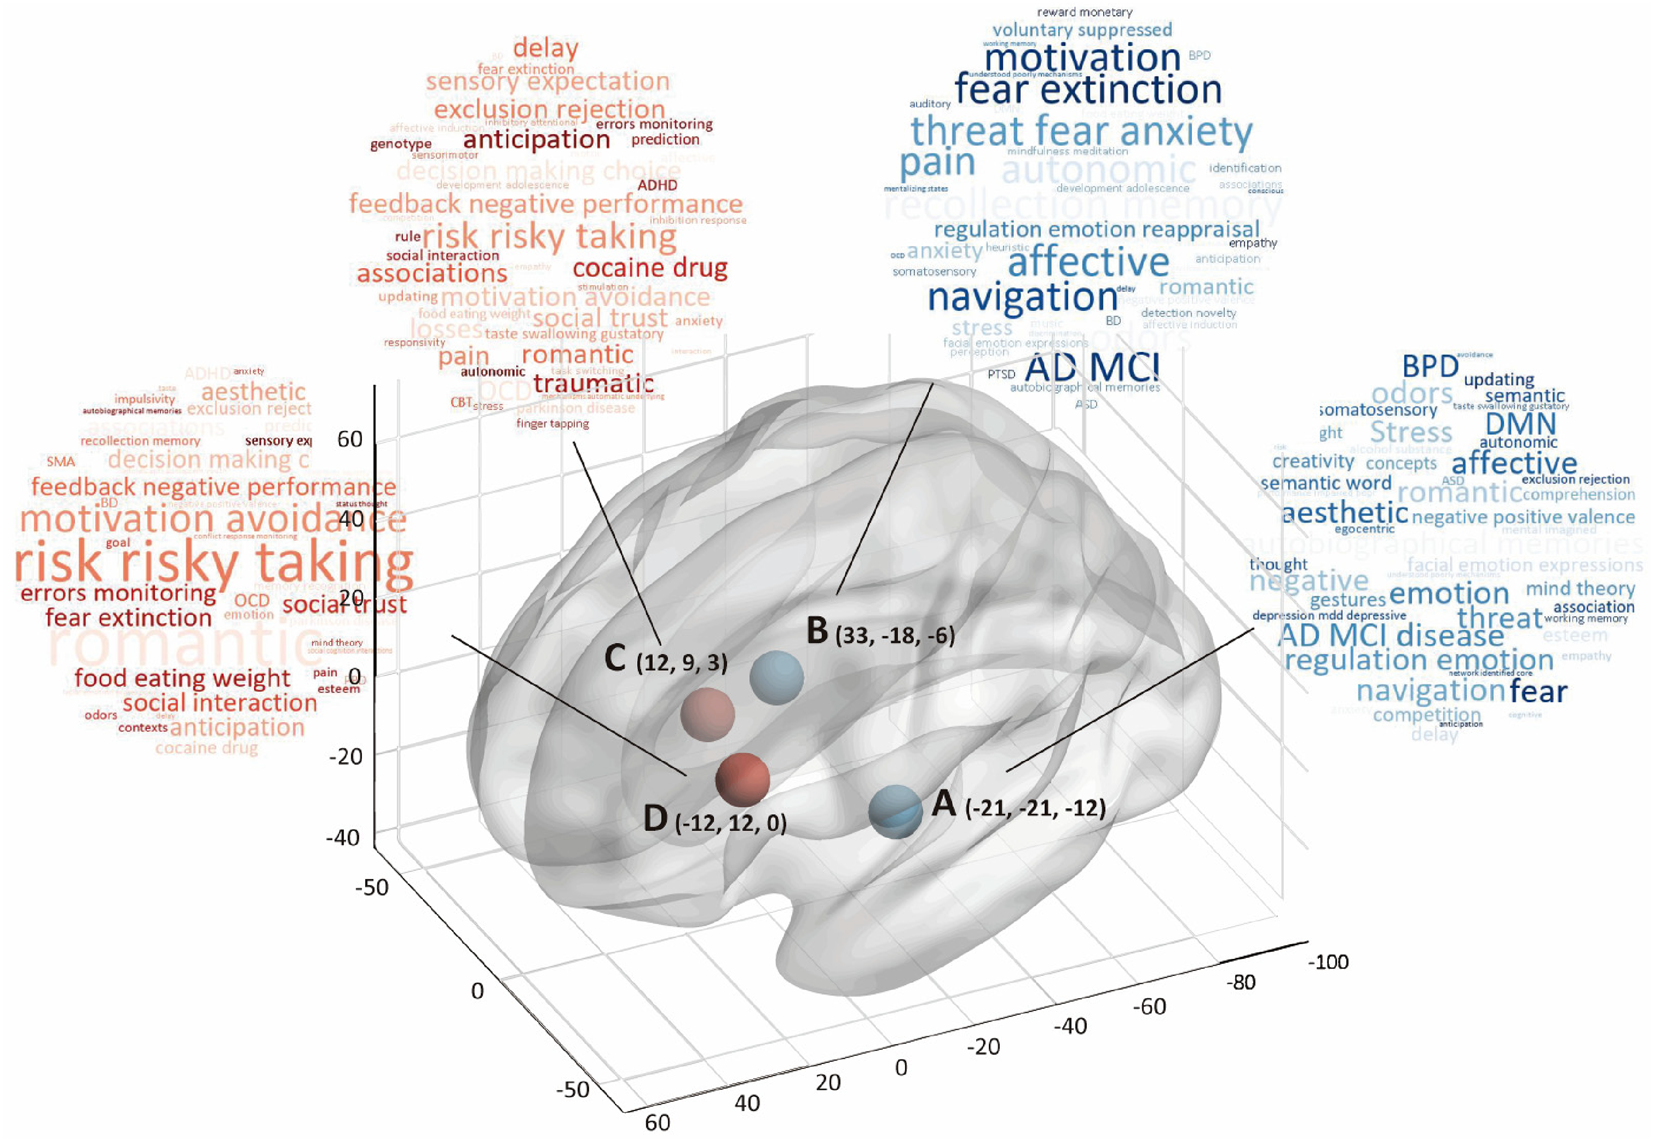
Cognitive associations related to the caudate and hippocampus were identified through automatic parsing in NeuroSynth. The different top terms generated may suggest distinct aspects of symptoms in PBD, as reflected by the two sets of coordinates (Fig. 4 and online Supplementary SI Fig. S2), corresponding to mania and depression, respectively.
Cognitive terms of hippocampus (A, B) and caudate (C, D). Specific coordinates were selected by independent component analysis in Table 2.
Discussion
PBD is widely recognized as a dysconnectivity disorder, as supported by numerous (Luciano et al., Reference Luciano, Di Vincenzo, Mancuso, Marafioti, Di Cerbo, Giallonardo and Fiorillo2023). However, a detailed characterization of the causal influences in PBD and their correlations with symptoms has been lacking. This study demonstrated that the core pathological alteration in PBD lies in the disruption of bottom-up connections from the LN to the SN, as well as in the connections between the SN and DMN, compared to HC. Additionally, significant correlations between brain activity and mood states – specifically depression and mania – were primarily observed in the hippocampus and caudate regions. The differences between brain activity related to depression and mania were predominantly found in the top-down connectivity from the triple network to the LN. Furthermore, we replicated the previously reported bidirectional abnormal interactions within the triple network model (Lopez-Larson et al., Reference Lopez-Larson, Shah, Weeks, King, Mallik, Yurgelun-Todd and Anderson2017; Zhang et al., Reference Zhang, Bo, Li, Zhao, Wang, Liu and Zhou2022).
We observed that the four core networks shared similar interaction patterns across HCs and PBD patients. The connection between the DMN and CEN exhibited a mutual inhibitory influence, which is in line with previous findings in healthy volunteers (Sharaev, Zavyalova, Ushakov, Kartashov, & Velichkovsky, Reference Sharaev, Zavyalova, Ushakov, Kartashov and Velichkovsky2016; Uddin, Clare Kelly, Biswal, Xavier Castellanos, & Milham, Reference Uddin, Clare Kelly, Biswal, Xavier Castellanos and Milham2009; Zhou et al., Reference Zhou, Friston, Zeidman, Chen, Li and Razi2018) and BD patients (Zhang et al., Reference Zhang, Bo, Li, Zhao, Wang, Liu and Zhou2022). It is widely accepted that the DMN is a distributed network of brain regions more active during rest than during the performance of many attention-demanding tasks (Menon, Reference Menon2023; Mittner, Hawkins, Boekel, & Forstmann, Reference Mittner, Hawkins, Boekel and Forstmann2016; Whitfield-Gabrieli & Ford, Reference Whitfield-Gabrieli and Ford2012). Conversely, as part of a complex high-level cognitive network, the CEN shows increased activation during stimulus-driven cognitive or affective processing (Cole & Schneider, Reference Cole and Schneider2007; Dosenbach et al., Reference Dosenbach, Fair, Miezin, Cohen, Wenger, Dosenbach and Petersen2007; Sridharan, Levitin, & Menon, Reference Sridharan, Levitin and Menon2008). Thus, an anticorrelation relationship between the DMN and CEN is commonly observed (Fox et al., Reference Fox, Snyder, Vincent, Corbetta, Van Essen and Raichle2005; Greicius, Krasnow, Reiss, & Menon, Reference Greicius, Krasnow, Reiss and Menon2003; Kucyi & Davis, Reference Kucyi and Davis2014; Molnar-Szakacs & Uddin, Reference Molnar-Szakacs and Uddin2022).
Importantly, the bidirectional connections between the DMN and LN, CEN and LN, and SN and LN were similarly excitatory. This consistent pattern suggests that the LN may interact with the triple network model as a unified system. One potential explanation for this interaction is the functional differences between these regions. Previous studies have shown that activations in LN with subcortical regions are primarily involved in generating and modulating emotions, while cortical regions play a crucial role in regulating and controlling emotional responses (Bi, Che, & Bai, Reference Bi, Che and Bai2022; Dickstein et al., Reference Dickstein, Finger, Skup, Pine, Blair and Leibenluft2010).
Intrinsic large-scale networks are crucial for understanding the brain alterations in PBD, making group differences particularly important. Compared to HCs, several connections between cortical (DMN, CEN, SN) and subcortical (LN) regions were identified as dysfunctional in PBD patients, primarily in bottom-up connections from the LN to the SN. Notably, these included excitatory connections from the hippocampus and amygdala to the dACC and from the caudate to the AI. The LN has been identified as a core site of pathological alteration in BD, driving abnormal subcortical-cortical coupling and changes in network activity (Magioncalda & Martino, Reference Magioncalda and Martino2022). Furthermore, the SN is built around limbic structures, particularly the dACC and insula (Craig, Reference Craig2002; Critchley, Reference Critchley2005; Damasio, Reference Damasio2000; Mesulam, Reference Mesulam1998), which integrate highly processed sensory data with visceral, autonomic, and hedonic markers (Damasio, Reference Damasio2000; Seeley et al., Reference Seeley, Menon, Schatzberg, Keller, Glover, Kenna and Greicius2007). These brain regions significantly contribute to psychiatric disorders by linking subcortical and cortical areas (Rocchi et al., Reference Rocchi, Sterlini, Tardito, Inglese, Corradi, Filaci and Martino2020). Therefore, we propose that this abnormal process reflects the LN driving network activity changes through the SN, consistent with the three-dimensional model for BD suggested by Martino and Magioncalda (Reference Martino and Magioncalda2022) and the triple network model proposed by Menon (Reference Menon2011).
Consistent with prior research, PBD patients primarily exhibited abnormal effective connectivity (EC) between the DMN and SN compared to HCs, particularly in the inhibitory connection from the sgACC to the dACC, and excitatory connections from the PCC to the dACC, the right dACC to the right angular gyrus, and from the AI to the sgACC. These findings are broadly in line with previous studies reporting atypical increases in functional connectivity between the DMN and SN in both resting-state and task-based fMRI, involving regions such as the dACC, PCC, AI, and mPFC (sgACC) (Dickstein et al., Reference Dickstein, Rich, Roberson-Nay, Berghorst, Vinton, Pine and Leibenluft2007; Gogtay et al., Reference Gogtay, Ordonez, Herman, Hayashi, Greenstein, Vaituzis and Rapoport2007; Lyoo et al., Reference Lyoo, Sung, Dager, Friedman, Lee, Kim and Renshaw2006; Murray, Wise, & Graham, Reference Murray, Wise and Graham2017; Najt et al., Reference Najt, Nicoletti, Chen, Hatch, Caetano, Sassi and Soares2007; Pavuluri, O'Connor, Harral, & Sweeney, Reference Pavuluri, O'Connor, Harral and Sweeney2007; Wilke, Kowatch, DelBello, Mills, & Holland, Reference Wilke, Kowatch, DelBello, Mills and Holland2004). We speculate that the disrupted development of spatially segregated networks, such as the SN and DMN, in PBD patients may reflect delayed brain maturation compared to healthy children and adolescents (Fair et al., Reference Fair, Cohen, Power, Dosenbach, Church, Miezin and Petersen2009; Lopez-Larson et al., Reference Lopez-Larson, Shah, Weeks, King, Mallik, Yurgelun-Todd and Anderson2017; Power, Fair, Schlaggar, & Petersen, Reference Power, Fair, Schlaggar and Petersen2010). For instance, alterations in the connections between the ACC and PCC could lead to excessive focus on external stimuli, potentially contributing to manic phases (Magioncalda et al., Reference Magioncalda, Martino, Conio, Escelsior, Piaggio, Presta and Amore2015; Rey et al., Reference Rey, Piguet, Benders, Favre, Eickhoff, Aubry and Vuilleumier2016; Zovetti et al., Reference Zovetti, Rossetti, Perlini, Maggioni, Bontempi, Bellani and Brambilla2020).
Cross-validation using a PEB framework tested whether group differences could be predicted based on the effective connectivity estimates of individual subjects (Bouziane et al., Reference Bouziane, Das, Friston, Caballero-Gaudes and Ray2022; Friston et al., Reference Friston, Litvak, Oswal, Razi, Stephan, Van Wijk and Zeidman2016). Notably, 16 individual connections from the four core networks significantly predicted group differences, indicating that EC accounted for a substantial portion of the between-group variance. Crucially, 12 out of the 16 connections involved regions within the LN, further emphasizing the central role of the LN in PBD.
PBD patients with higher levels of depression exhibited more excitatory causal connections from the triple networks to the LN. In contrast, those with higher levels of mania showed more inhibitory causal connections from the triple networks to the LN. These reversed polarity connections were primarily observed in connections from DMN and SN with LN.
Previous studies have reported changes in resting-state functional connectivity (rsFC) between the DMN and LN (Liu et al., Reference Liu, Ma, Wu, Zhang, Zhou, Li and Wang2013; Liu, Pu, Wu, Zhao, & Xue, Reference Liu, Pu, Wu, Zhao and Xue2019; Phillips, Drevets, Rauch, & Lane, Reference Phillips, Drevets, Rauch and Lane2003; Wu et al., Reference Wu, Su, Li, Zhu, Li, Li and Si2023), and between the SN and LN (Chang, Wang, Wu, Lin, & Wang, Reference Chang, Wang, Wu, Lin and Wang2023; Magioncalda & Martino, Reference Magioncalda and Martino2022; Martino & Magioncalda, Reference Martino and Magioncalda2022), in manic and depressive states. However, these studies primarily focused on undirected functional connectivity and rarely examined the interactions from a network perspective. The findings of this study suggest that state-related differences in brain regions occurred predominantly in the top-down connections from the triple networks to LN.
The LOOCV analysis for predicting mania severity revealed that 5 out of 6 significant connections were related to the caudate (see online Supplementary Fig. S1). To our knowledge, few studies have examined causal connectivity associated with mania in BD. The strong link between mania severity and caudate-related causal connectivity identified here may align with evidence suggesting a central role for the caudate in the pathogenesis of mania (Starkstein et al., Reference Starkstein, Mayberg, Berthier, Fedoroff, Price, Dannals and Robinson1990, Reference Starkstein, Fedoroff, Berthier and Robinson1991). A consistent finding derived from traditional symptom localization in brain lesion studies – which also provides causal inferences (Fox, Reference Fox2018), revealed a close relationship between caudate lesions and mania symptoms One possible explanation is that, in the neurobiology of BD, the striatum integrates cognitive and affective processes within cortico-striatal-limbic loops, including the circuits that support emotion regulation (Lei et al., Reference Lei, Li, Qin, Ai, Tallman, Patino and DelBello2023; McKenna & Eyler, Reference McKenna and Eyler2012). The caudate is a key node within this striatal circuitry, neurobiologically involved in disturbed emotional reactivity, impaired emotion regulation, and impulse control (Phillips & Swartz, Reference Phillips and Swartz2014; Swann, Lijffijt, Lane, Steinberg, & Moeller, Reference Swann, Lijffijt, Lane, Steinberg and Moeller2009; Wessa, Perlini, & Brambilla, Reference Wessa, Perlini and Brambilla2015).
The LOOCV analysis for predicting depression severity revealed that the hippocampus was the only region exhibiting abnormal connectivity with all three networks (see online Supplementary Fig. S1). Treatments targeting the hippocampus, such as ketamine and electroconvulsive therapy, have been shown to be effective in treating depression in BD (Wade et al., Reference Wade, Loureiro, Sahib, Kubicki, Joshi, Hellemann and Narr2022). Causal structural covariance network analysis, using Granger causality on sequenced T1-weighted images, demonstrated that depression-related alterations often originate from the hippocampus and causally influence the dlPFC and DMN (Han et al., Reference Han, Zheng, Li, Liu, Wang, Jiang and Cheng2023; Li et al., Reference Li, Wang, Teng, Jiao, Song, Tan and Zhong2019). Additionally, the insula is crucial in mediating the modulation of the precuneus by the hippocampus. Intervention studies, such as transcranial magnetic stimulation (TMS), further support the causal link between activity in these connections and depression symptoms (Philip et al., Reference Philip, Barredo, Van ‘T Wout-Frank, Tyrka, Price and Carpenter2018).
The meta-analysis results also confirmed the relevance of the caudate and hippocampus to mania and depression severity, respectively (Fig. 4). For instance, cognitive terms associated with the caudate included risk-taking, goal-directed activity, BD, and emotion. In contrast, terms linked to the hippocampus included affective processes, BD, depression, emotion, DMN, and emotional regulation.
There are some limitations in our study. First, while this research provides new insights into alterations in causal connections among the four core networks in PBD patients, the key nodes of each network were selected based solely on previous studies of PBD due to computational constraints. Additionally, since several PBD patients were on medication, and although regression was performed to account for this as a nuisance covariate, further investigation into the specific effects of treatment on EC is warranted.
Conclusion
In summary, the relationship between the triple network and the LN may reflect an essential marker of PBD. The group differences observed are linked to an abnormal process, primarily driven by the LN, which triggers changes in network activity, particularly through its bottom-up influence on the SN. More importantly, the differences in brain activity between depressive and manic mood states are predominantly found in the top-down connectivity from the triple network to the LN. Additionally, the aberrant effective connectivity, particularly involving the hippocampus and caudate, may have pathophysiological relevance for the severity of depression and mania.
Supplementary material
The supplementary material for this article can be found at https://doi.org/10.1017/S0033291724002885
Acknowledgements
The authors thank Dr Yuan Zhou (Beijing Anding Hospital) for the code script of Bayesian Contrast analysis. Further, the authors thank Dr Takuya Ishida and Dr Shinsuke Koike (University of Tokyo) for the script of SPM batching analysis of ROIs. ZHENG, G would like to thank the support of the Australian National Imaging Facility Fellowship.
Author contributions
WR methodology, visualization, writing-original draft, writing-review & editing. WC data curation, writing-review & editing. ZHANG, G methodology, writing-review & editing. ICM writing-review & editing. ZHENG, G writing-review & editing. XQ data curation, funding acquisition. ZY conceptualization, methodology, project administration, data curation, funding acquisition, supervision, project administration.
Funding statement
This research was funded by the National Key R&D Program of China (Grant No. 2023YFC3341300), Natural Science Foundation of Jiangsu Province (No. BK20241881), the National Natural Science Foundation of China (No. 81871344, 82201702) and “333 Talent Project” of Jiangsu Province.
Competing interests
None.
Code availability
All code used in this study is available at GitHub.


 Open access

