Background and motivation
This work studies the relationship between embedded particle volume fraction and magnetic particle orientation distribution in ferromagnetic–elastomer composites by mathematically characterizing experimental results of vibrating sample magnetometry (VSM). The work is novel in that while much research has been performed on the process, structure, and properties relationships of soft-magnetic ferromagnetic–elastomer composites, much less study has been directed at hard-magnetic ferromagnetic–elastomer composites, the focus of this work. For clarity, soft-magnetic ferromagnetic–elastomer composites will be referred to by the more familiar term magneto-rheological elastomers (MREs), while hard-magnetic ferromagnetic–elastomer composites will be referred to as magnetoactive elastomers (MAEs). For more on this distinction, see Lockette et al. [Reference Lockette, Lofland, Biggs, Roche, Mineroff and Babcock1]. Furthermore, particle orientation distribution, the metric of this work, is defined herein as observations of the population of directions at which particle magnetizations reside across the aggregate of particles embedded within the matrix. For the magnetic particles studied, the magnetization axes and the crystallographic c-axis coincide.
MAEs are fabricated by embedding ferromagnetic particles with high remanence in an elastomer matrix [Reference Lockette, Lofland, Biggs, Roche, Mineroff and Babcock1, Reference Koo, Dawson and Jung2, Reference Lockette, Sheridan, Johnson, Naguib, Turner, Anderson, Bassiri-Gharb, Daqaq, Baba Sundaresan and Sarles3, Reference Breznak and Lockette4]. Typical sizes range from particles on the nanoscale to particles with diameters in the tens of microns [Reference Breznak and Lockette4, Reference Shepherd, Mallick and Green5, Reference Radwan, Rashad and Hessien6, Reference Sadhana, Praveena and Matteppanavar7]. The particles can be oriented as-mixed, nominally randomly, or aligned in a specific orientation by applying an external magnetic field as the material cures. Ideally, every particle will align perfectly with the magnetic field. In actuality, there is a distribution of particle orientations with respect to the applied field as the material cures [Reference Breznak and Lockette4]. The distribution lessens the effectiveness of the magnetic volume content by producing magnetization lower than the idealized perfect alignment. Low alignment, which can lead to less than optimal response of the magnetic filler in composites and devices, becomes increasingly important, given the cost of magnetic fillers may range from $5–30/kg for iron oxide (Fe3O4) and iron (Fe) powder (Alpha Chemicals, Cape Girardeau, Missouri), through $8000/kg or more for barium hexaferrite (BHF, BaFe12O19) nanoparticles (Sigma-Aldrich, St. Louis, Missouri). This research aims to quantify the degree of particle alignment as volume content of a specific magnetic filler is varied by coupling experimental data to the von Mises circular probability distribution function (PDF). The work seeks to highlight volume fraction ranges in which higher particle alignment leads to better utilization of the embedded magnetic material, thereby detailing how choice of composition may produce more cost-effective magnetoactive composites.
Past researchers have focused on how magnetic field processing and constituent parameter variation affect the magnetic and elastic properties of the ferromagnetic composites formed. Traditionally, soft magnetic particles, such as iron, were embedded within an elastomer matrix to form MREs. Soft magnetic particles are magnetically isotropic with zero remanence. The first MREs were cured without the presence of a magnetic field, resulting in uneven particle spacing [Reference Jolly, Carlson, Muñoz and Bullions8, Reference Jolly, Carlson and Muñoz9, Reference Shiga, Okada and Kurauchi10]. To improve magnetic properties, uncured materials were processed using an external magnetic field, which resulted in the particles aligning themselves relative to each other and the external field [Reference Lockette, Lofland, Biggs, Roche, Mineroff and Babcock1, Reference Chokkalingam, Pandi and Mahendran11]. Groups of particles, on average, were closer together than the particles of unaligned MREs, a result of field-induced dipole–dipole attractions, resulting in a higher magnetic moment density [Reference Shepherd, Mallick and Green5].
The effects of varying volume concentration of soft magnetic particles within an MRE were also studied. Varying magnetic volume concentration was determined to affect both MRE microstructure and magnetic properties [Reference Shepherd, Mallick and Green5, Reference Radwan, Rashad and Hessien6, Reference Sadhana, Praveena and Matteppanavar7]. When cured within a magnetic field, lower volume concentrations of soft magnetic particles tended to form chains of particles within an MRE, whereas at higher volume concentrations, the particles tended to form clusters [Reference Boczkowska, Awietjan, Wejrzanowski and Kurzydłowski12, Reference Rodriguez-Aurelio, vonlockette, Karami, Anton, Nouh, Freeman, Tummala and Jovanova13]. Both cases represent agglomerations (although differing geometries) due to field-induced dipole–dipole interactions between particles. Intermediate volume fractions tended to show a transition stage where both chains and clusters were observed [Reference Boczkowska, Awietjan, Wejrzanowski and Kurzydłowski12, Reference Rodriguez-Aurelio, vonlockette, Karami, Anton, Nouh, Freeman, Tummala and Jovanova13]. MRE samples in those works were fabricated with carbonyl iron particles, roughly spherical shapes ranging in particle size from 6 to 9 µm and up to 30% v/v cured in the presence of a 0.3T magnetic field [Reference Boczkowska, Awietjan, Wejrzanowski and Kurzydłowski12].
Although changes in microstructure (the relative arrangement of groups of particles) have been observed as particle concentration has been varied, the change in particle orientation within these structures as particle concentration has been varied has not been studied. Changes in microstructure and particle orientation are expected to influence performance. For example, it has been determined that increasing particle volume concentration for MREs monotonically increases the MRE effect in soft magnetic composites up to a limiting volume fraction of 30%, defining an upper performance limit dependent on composition’s effects on the underlying microstructures formed [Reference Lokander and Stenberg14, Reference Lokander and Stenberg15, Reference Lokander, Reitberger and Stenberg16, Reference Zhang, Peng, Wen and Li17, Reference Zhou, Stephen, Betts, Farrell and Chen18, Reference Davis19]. Particle orientation becomes even more important in materials with significant magnetic remanence, given its directional nature.
Unlike soft ferromagnetic particles, hard ferromagnetic particles have a preferred magnetization direction independent of particle geometry, an intrinsic easy axis, which influences magnetization response and is expected to influence the evolution of microstructure and particle orientation during curing. When MAEs are cured without the presence of a magnetic field, no preferred magnetic particle orientations are expected. However, when a magnetic field is used to align the material as it cures, the particles will orient themselves in the direction of the magnetic field, creating a net magnetization in the direction of the field. Both phenomena have been observed [Reference Lockette, Lofland, Biggs, Roche, Mineroff and Babcock1, Reference Lockette, Sheridan, Johnson, Naguib, Turner, Anderson, Bassiri-Gharb, Daqaq, Baba Sundaresan and Sarles3, Reference Breznak and Lockette4]. Also, unlike soft magnetic materials, the net particle alignment produces remanent magnetization, as well as higher magnetic moment density, a result of coherent magnetic (and thereby physical) alignment of the now embedded particles. While several researchers have studied the effective properties and actuation response of MAEs cured in the presence of external magnetic fields, none have yet sought to quantify the degree of alignment underlying the effective bulk magnetization response.
Researchers studying the bulk magnetization response of MAEs with hard ferromagnetic particles have found that the response is affected by volume concentration of the particles. Experimentation by the authors of this work on composite of silicone elastomer with 10–35% v/v% barium hexaferrite found that the remanent and saturation magnetizations of those MAEs per unit magnetic mass were maximized at a particle volume fraction of approximately 15% [Reference Breznak and Lockette4]. On its own, this maximal value suggests that, overall, the magnetic easy axes of individual embedded particles maintain better alignment at this specific volume fraction. Coupled with knowledge of MRE microstructure with respect to particle volume content, it is further expected that the microstructures within which the embedded particles exist may also evolve with particle volume content. Unlike MREs, however, the change in microstructure with particle volume concentration has, not to the authors’ knowledge, been studied in MAEs. Consequently, using experimental data, this work will quantify changes in the degree of magnetic (and thereby physical) alignment using PDFs.
Results
VSM results
The BHF powder was tested with the VSM to determine its baseline magnetic properties. The hysteresis loop of the BHF powder, shown in Fig. 1(a), yields m r = 50.3 emu/g and H c = 0.318 MA/m. The magnetic properties of BHF are highly dependent upon processing conditions during fabrication. The measured remanent magnetization was higher than reported values found in the literature (m r = 40 emu/g), but the coercive field strength was consistent with known literature (0.33 MA/m) [Reference Shepherd, Mallick and Green5, Reference Radwan, Rashad and Hessien6, Reference Sadhana, Praveena and Matteppanavar7]. The high coercivity is indicative of a hard ferromagnetic material.
Magnetization hysteresis loop of BHF powder samples. (a) The hysteresis loop of BHF was normalized by the total mass of the particles tested. The magnetization per unit mass of BHF particles was plotted against the reciprocal of the applied magnetic field. (b) A linear best fit line was then used to extrapolate the saturation magnetization of the BHF particles.

Due to field generation limitations of the VSM, the saturation magnetization was estimated. In Fig. 1(b), m s is determined from the y-intercept of the graph of magnetization (y-axis) versus the reciprocal of the magnetic field at high fields (x-axis) [Reference Han, Wang and Luo25, Reference Lamichhane, Taufour, Masters, Parker, Kaluarachchi, Thimmaiah, Bud’ko and Canfield26]. Magnetization hysteresis data from Fig. 1(a) in the range H ∞ ≥ 1.43T were used, given their high collinearity at these high field strengths. The y-intercept in Fig. 1(b) yielded m s = 102.8 emu/g, which is higher than value found in the literature, e.g., m s = 87.7 emu/g [Reference Shepherd, Mallick and Green5]. These higher values are validated in the Analysis section through comparison with MAE composites materials.
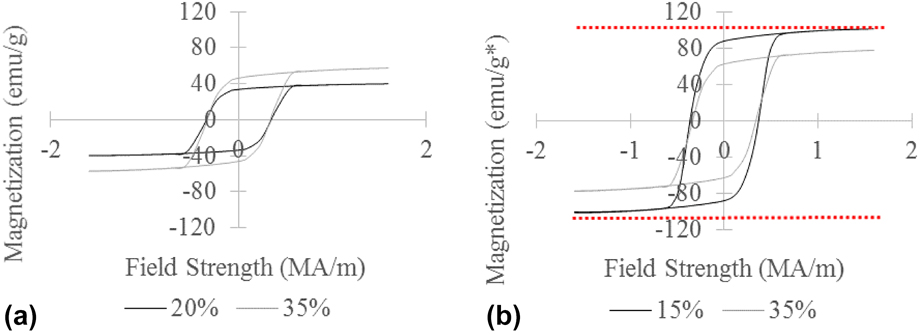
Aligned MAE samples prepared using the BHF powder at each volume fraction were cut into 4 approximately rectangular pieces using a blade. Each piece was then massed and tested within the VSM, yielding the average magnetization of the four MAE samples. Nominally, the samples’ easy axes were aligned parallel to the applied magnetic field of the VSM. The average total mass–normalized magnetic hysteresis loops of each volume concentration are shown in Fig. 2(a), while Fig. 2(b) shows hysteresis loops normalized by the composition-dependent varying magnetic masses across the samples. In contrast to the powder, results show magnetic saturation of all compositions. Normalization by magnetic mass in Fig. 2(b) informs the effective use (or not) of the magnetic powder. Additionally, the dotted lines above and below the data show the limiting saturation values determined previously, validating the extrapolation methods employed. The results clearly show that the 15% v/v samples have both higher remanence and saturation values. The remanence and saturation from Figs. 2(a) and 2(b) are presented in Figs. 3(a) and 3(b) with corresponding normalizations.
Magnetic hysteresis loops across volume fractions of BHF. The highest and lowest hysteresis loops are shown in (a) normalized by the total mass of the MAE sample. Error bars representing one standard deviation from the mean were not placed on the figure to maintain clarity (b) normalized by the magnetic mass of the MAE sample. The dotted lines represent the saturation magnetization of BHF, which was found earlier to be 102 emu/g.

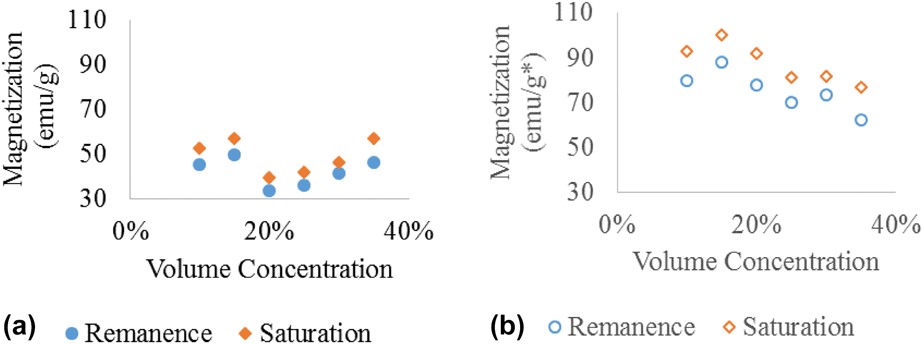
Remanence (m(H = 0) = m r) and saturation (m(H = 1.6) ≅ m s) across volume fractions. (a) Normalized by total mass and (b) normalized by magnetic mass, both plotted against volume concentration of BHF particles.

Figure 3 plots m r and m s versus v/v% for all six volume concentrations. The closed symbols represent the recorded data in emu/g [Fig. 3(a)], whereas the open symbols represent the data in emu/g*, where g* represents normalization by the magnetic mass in the samples, e.g., the mass of BHF [Fig. 3(b)]. Error bars were removed for clarity, given their small values occluded the data points. Standard deviation averaged across all samples was 4.50 emu/g or emu/g*.While it would be expected that the standard total mass normalization in Fig. 3(a), open symbols, would show a monotonically increasing trend in remanence, given the increasing magnetic mass per unit volume, a clear dip occurs at 15–20% v/v before continuing the upward trend.
Normalization of remanence and saturation by the magnetic mass, open symbols in Fig. 3(b), further shows that the 15% v/v samples had the highest magnetic mass–normalized remanence, arguably making the most efficient use of their magnetic material, possibly through better alignment. Similar trends are seen in the saturation [Fig. 3(b)]. Using the same method to linearly extrapolate the saturation magnetization of the BHF powder, the saturation magnetizations of each volume concentration were found and are shown in Table I.
Estimated saturation values for each volume concentration using linear extrapolation.

The estimated saturations differed for each volume concentration of BHF particles. Ideally, the estimated saturations should be the same, independent of volume fraction, and approach the powder sample’s value. Data show that the samples were close to being saturated but are not fully saturated. The distance from full saturation is a measure of how difficult it is to fully saturate an MAE patch, which can be dependent on the microstructure of the MAE sample. It is interesting to reiterate that the 15 v/v% sample had the highest saturation.
Analysis
Statistical significance
To prove statistical significance of the difference between v/v% samples, a two-sample t-test was performed on the data normalized by magnetic mass for the 10% MAE samples and the 15% MAE samples, as well as the 15% MAE samples and 20% MAE samples. The test was done assuming unequal variances. For both tests, 10 v/v% versus 15 v/v% and 15 v/v% versus 20 v/v%, it was determined with 82.5% confidence that the population means were statistically significantly different.
Squareness correction factor
As shown in the literature, the theoretical minimum squareness is 0.50 [Reference Saxena, Pelteret and Steinmann22, Reference Gasser, Ogden and Holzapfel23], which denotes a uniformly random distribution whose squareness we will denote 〈S rand〉 = 0.5. Consequently, the proposed model is applicable for S(·) = 0.5…1, where 1 denotes perfectly aligned domain orientations. However, testing of pure BHF powder showed squareness ratios less than 0.5, making Eq. (14) in the Methodology section intractable. Other research has shown that the magnetic properties of BHF particles are dependent on its processing variables during fabrication. Some fabrication techniques have produced BHF particles with squareness ratios below 0.5, some even as low as 0.13 [Reference Shepherd, Mallick and Green5]. These low values suggest some as yet unknown ordering or alignment.
To assist understanding of the situation and in the development of a solution, the authors propose that there exists a fraction of particles whose magnetic domains possibly form a closed multiparticle loop, negating each other at remanence. However, when the MAE reaches saturation, the domains of these particles temporarily align in the direction of the field adding to saturation magnetization. These domains return to their negated state once the field is removed. This would decrease measured remanent magnetization because a portion of the particles do contribute to the measured magnetization at saturation but not at remanence, causing the squareness ratio to become less than the theoretical limit. In order to account for this unmeasured collection of particles in the model, a correction factor is proposed.
The overall volume fraction of particles can be broken into two volumes. The first volume fraction, V 1, is the concentration of particles whose magnetization can be measured at remanence, and the second volume fraction, V 2, is the particles whose magnetizations negate each other, so that their overall magnetization is not measured at remanence but does add to saturation. The overall experimental squareness can then be represented as follows:
 $${S_{\exp }} = {{{V_1}{M_{{\rm{r1}}}} + {V_2}{M_{{\rm{r2}}}}} \over {{V_1}{M_{{\rm{s1}}}} + {V_2}{M_{{\rm{s2}}}}}}\quad ,$$
where S exp is the experimentally measured squareness, M r1 is the remanent magnetization of the particles measured by the VSM, M r2 is the remanence of the particles whose magnetization negates each other at remanence, M s1 is the saturation magnetization of the particles measured by the VSM, and M s2 is the saturation magnetization of particles whose magnetization is not measured by the VSM at remanence. Noting that we assume M r2 = 0 and that M s2 = M s1 = M s yields:
 $${S_{\exp }} = {{{V_1}} \over {{V_1} + {V_2}}}{{{M_{{\rm{r1}}}}} \over {{M_{\rm{s}}}}}\quad .$$
Here, we further assume that the volume of magnetic material, V 1, is oriented randomly, such that squareness matches theory for unaligned samples, namely:
 $${{{M_{{\rm{r1}}}}} \over {{M_{\rm{s}}}}} = {1 \over 2}\quad .$$
Using Eqs. (1)–(3) and noting that V 1 + V 2 = 1, the volume of material not contributing to remanence can be estimated from the following equation:
 $${V_1} = 2{S_{\exp }}\quad ,$$
where S exp = 0.49. This is the squareness derived from the data in Fig. 1(a), which is the squareness of BHF particles. This predicts V 1 = 0.98 for the powder sample average. Substituting (2) and (4) into (2) yields:
 $${S^*} = 0.98 \times {S_{\exp }}\quad ,$$
where S* is a corrected squareness value, normalized to the powder case, which is assumed randomly oriented. This value can be used to determine experimental squareness values amenable with the theoretical model used to predict alignment.
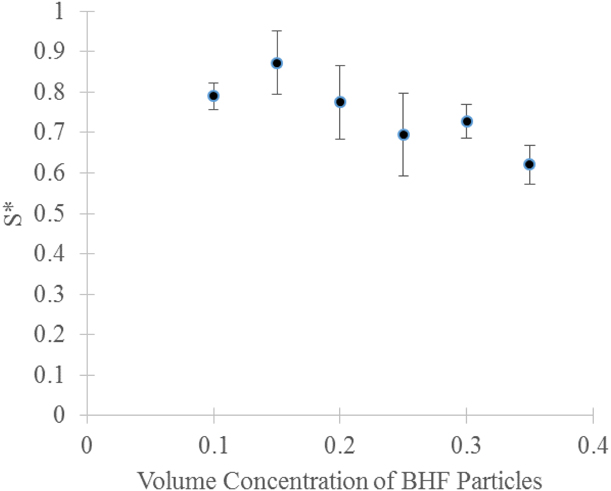
In Fig. 4, the corrected squareness was plotted against BHF volume concentration. All squareness ratios are calculated by dividing the remanent magnetization of each hysteresis loop by the saturation magnetization of the BHF powder (M s(BHF)), the nominal limit for each sample. This squareness ratio was then adjusted using the correction factor to normalize the data by the saturation magnetization that each MAE should theoretically reach, which is the magnetization of the powder. This is represented by the following equation:
 $${S^*} = 0.98 \times {{{M_{\rm{r}}}} \over {{M_{{\rm{s}}\left( {{\rm{BHF}}} \right)}}}}\quad .$$
Corrected squareness plotted versus v/v% BHF for several MAE compositions. Error bars represent 1 standard deviation from the mean. Squareness peaks at 15% v/v but decreases with increasing v/v% BHF.

MAEs with a volume fraction of 15% had the highest average corrected squareness ratio with a value of 0.872. After this volume concentration, corrected squareness decreased with increasing volume content to a low value of 0.707 at 35% v/v BHF.
Results of data analyses
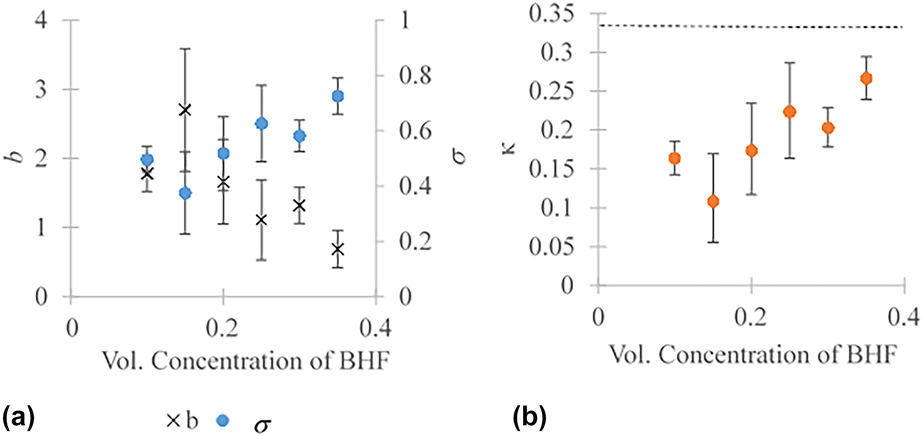
Equation (14) in the Methodology section was used in conjunction with S exp = S* to estimate distribution parameters; standard deviation, σ, for the Gaussian distribution; and the dispersion parameter, κ, for the von Mises distribution. The results are shown in Fig. 5(a). As expected, due to their high magnetic mass–normalized remanence, the MAE samples made of 15 v/v% BHF had the narrowest orientation distributions in both models, σ = 0.374 and b = 2.701, in the Gaussian and von Mises, respectively. The MAE sample made of 35% BHF by volume had the widest distributions (highest parameter values), σ = 0.723 and b = 0.691. It can also be seen that the distributions are narrowest at the 15% v/v BHF composition, then widen for increasing v/v% BHF.
(a) Plots of σ and b versus v/v% BHF and (b) κ versus v/v% BHF volume concentration. Both parameters are calculated using S exp = S*. The dotted line is the theoretical random limit for κ.

While σ and b mathematically describe the relative width of their respective PDFs, they are somewhat difficult to relate to an actual degree of orientation. The issue stems from their bounds, b ∈ [0, ∞] and σ ∈ [0, ∞], which do not readily convey relative degrees of alignment, as there is no upper bound defining uniformly random. The von Mises dispersion factor, κ, however, places bounds on this relative alignment and provides a useful metric. Computed values of the von Mises dispersion parameter, Fig. 5(b), show that the 15% v/v sample had the lowest κ of 0.11 and thus the highest alignment. The 35 v/v% sample was the least aligned with κ = 0.27. Note that κ = 1/3, denoting the purely random case, is shown as a dashed line in Fig. 5(b).
Conclusions
In this work, MAE samples were fabricated by embedding BHF particles within a Sylgard 184 elastomer matrix. These samples of varying magnetic volume content were then tested with a VSM, yielding magnetic remanence and saturation. The 15 v/v% sample was determined to have the highest remanence and saturation magnetizations on a per unit magnetic mass basis with 82.3% confidence.
The average squareness ratio was determined for each volume fraction of particles from the acquired hysteresis loops. Due to an assumed contribution of particles whose magnetization cannot be measured at remanence, the squareness ratio was adjusted using a correction factor. The corrected squareness ratios were then mapped to statistical models of orientation distribution to determine relative degree of particle alignment as composition was varied.
It was found that the highest particle domain alignment was obtained from MAEs fabricated at 15% BHF by volume. These results suggest a degree of self-ordering taking place at this volume fraction. Given bulk magnetization varies with v/v/% BHF, changes in degree of self-ordering are possibly due to relative proximity of the particles. Particles at 15 v/v% may be close enough for particle–particle interactions but far enough to allow mobility and hence develop chain-like formations beneficial to magnetization. Consequently, it might be expected that increased mobility alone would enhance alignment, but the decrease in alignment below 15 v/v% BHF suggests otherwise. It is interesting to note that this goes against results seen in soft-magnetic MREs, which show higher alignment at decreasing volume fractions [Reference Boczkowska, Awietjan, Wejrzanowski and Kurzydłowski12]. Decreased alignment in computational studies of the formation of microstructure in hard-magnetic systems representative of BHF has, however, been observed when the motive force due to the external field is low with respect to that of the dipole–dipole interactions [Reference Rodriguez-Aurelio, vonlockette, Karami, Anton, Nouh, Freeman, Tummala and Jovanova13]. The computationally observed phenomena make sense in that particles, when unbiased by an external field, and when they are mobile, would tend to form closed magnetic loops and thus decrease observed alignment.
Enhanced alignment can translate into direct cost savings in the production of MAE composites. Given measured m r values for the optimal 15 v/v% and the suboptimal 35 v/v% results, slightly better (8%) m r results are seen in the 15 v/v% samples using 20 v/v/% less BHF. The reduced BHF usage can also translate savings in weight. For example, a sample using 1.5 g of elastomer could use 1.4 g of BHF, rather than 4.3 g of BHF while achieving the same magnetization per magnetic mass. This reduction in BHF particles would save nearly $10 for each gram of MAE produced, cost savings that are amplified at industrial production scales.
The von Mises distribution was also found to be a useful function to assess domain alignment. The first reason is the von Mises distribution is a circular distribution, and the particles orient themselves circularly around an axis. The second reason is the von Mises distribution provides a metric of alignment directing through the dispersion factor κ.
In the future, the magnetic particles within MAEs can be imaged using techniques, such as scanning electron microscopy (SEM), X-ray computed tomography, or X-ray diffraction, to access physical particle alignment separate from magnetic alignment during curing. Those results could then be compared with the results collected from a VSM to confirm the accuracy of the models used within this paper and to assess correlation between physical and magnetic alignment. Furthermore, information gained through these studies can help inform processing methods, defining composition for optimum usage of the magnetic powders.
It is also important to note that this paper does not account for particle-to-particle interactions in computing the magnetization of the aggregate, and uses only bulk measurements to access particle alignment. Particle interactions may affect magnetic fields seen by the particles locally due to demagnetizing fields of the plate-like BHF and thus reduce local particle magnetization. This may be a possible cause for difficulty in saturating some samples and the need for the correction factor. In the future, the model can be refined to include particle interactions and demagnetizing fields, which may possibly obviate the need for the correction factor.
Methodology
MAE fabrication
BHF, 325 mesh, supplied by ESPY Metals (Ashland, Oregon), was mixed with Sylgard 184 elastomer supplied by Dow Corning (Midland, Michigan). The nominal volume concentration of particles was varied from 10% BHF by volume to 35% BHF by volume in increments of 5%. The constituents were combined, following the standard procedures, which can be found in any one of several references, to produce the MAE compound [Reference Lockette, Lofland, Biggs, Roche, Mineroff and Babcock1, Reference Koo, Dawson and Jung2, Reference Jolly, Carlson, Muñoz and Bullions8, Reference Jolly, Carlson and Muñoz9, Reference Shiga, Okada and Kurauchi10, Reference Chokkalingam, Pandi and Mahendran11, Reference Boczkowska, Awietjan, Wejrzanowski and Kurzydłowski12, Reference Lokander and Stenberg14, Reference Lokander and Stenberg15, Reference Lokander, Reitberger and Stenberg16, Reference Zhang, Peng, Wen and Li17, Reference Zhou, Stephen, Betts, Farrell and Chen18, Reference Palacios-Pineda, Perales-Martinez, Lozano-Sanchez, Martínez-Romero, Puente-Córdova, Segura-Cárdenas and Elías-Zúñiga20, Reference Zaborski, Pietrasik and Masłowski21]. The uncured MAE compound was inserted into circular molds with a diameter of 10 mm and a thickness of 2 mm, nominally. Molds were then placed in a µ0H = +1T magnetic field for 15 min to induce orientation through particle rotations. This magnetic field, applied through the thickness, was generated by a Magnetech flux generator (MVG-6-12, Magnetech Industrial Services Inc., Massillon, Ohio). It is noted that the magnet coils heated to 50 °C as the field was applied; heat promotes curing of the elastomer compound, which locks in the alignment. The mixture continued to cure after cessation of the magnetic field while still at the elevated temperature. After the samples cured, they were cut into rectangular pieces for magnetization testing. The volume of each sample was measured using a digital caliber with a resolution of 0.01 mm.
While dispersing agents were considered, their use was avoided to allow our results to be compared with materials produced with more widely accepted methods [Reference Lockette, Lofland, Biggs, Roche, Mineroff and Babcock1, Reference Koo, Dawson and Jung2, Reference Jolly, Carlson, Muñoz and Bullions8, Reference Jolly, Carlson and Muñoz9, Reference Shiga, Okada and Kurauchi10, Reference Chokkalingam, Pandi and Mahendran11, Reference Boczkowska, Awietjan, Wejrzanowski and Kurzydłowski12, Reference Lokander and Stenberg14, Reference Lokander and Stenberg15, Reference Lokander, Reitberger and Stenberg16, Reference Zhang, Peng, Wen and Li17, Reference Zhou, Stephen, Betts, Farrell and Chen18], to reduce the number of experimental variables, and because dispersing agents, when used, have not been shown effective in previous works in the literature surrounding these materials.
A literature review found works that both did [Reference Lockette, Lofland, Biggs, Roche, Mineroff and Babcock1, Reference Koo, Dawson and Jung2, Reference Jolly, Carlson, Muñoz and Bullions8, Reference Jolly, Carlson and Muñoz9, Reference Shiga, Okada and Kurauchi10, Reference Chokkalingam, Pandi and Mahendran11, Reference Boczkowska, Awietjan, Wejrzanowski and Kurzydłowski12, Reference Lokander and Stenberg14, Reference Lokander and Stenberg15, Reference Lokander, Reitberger and Stenberg16, Reference Zhang, Peng, Wen and Li17, Reference Zhou, Stephen, Betts, Farrell and Chen18] and did not [Reference Palacios-Pineda, Perales-Martinez, Lozano-Sanchez, Martínez-Romero, Puente-Córdova, Segura-Cárdenas and Elías-Zúñiga20, Reference Zaborski, Pietrasik and Masłowski21] use dispersing agents. Dispersing agents have been considered as a way to improve mechanical and magnetic properties in these composites. While research studies that used dispersing agents claimed better particle dispersion throughout their samples, these effects were not quantified, only inferred from snapshots of SEM images of small regions within a larger whole [Reference Palacios-Pineda, Perales-Martinez, Lozano-Sanchez, Martínez-Romero, Puente-Córdova, Segura-Cárdenas and Elías-Zúñiga20]. For example, in one study using silicone oil (SO) as a dispersing agent for an iron–polydimethylsiloxane composite, a small number of SEM images were used to qualitatively determine dispersion that had occurred from use of SO. However, the degree of dispersion was never quantified. Moreover, samples with SO were never compared with results of samples without SO. Specifically, there was no control group for differential comparison [Reference Palacios-Pineda, Perales-Martinez, Lozano-Sanchez, Martínez-Romero, Puente-Córdova, Segura-Cárdenas and Elías-Zúñiga20]. In another study, where several different dispersing agents were used, while mechanical properties were slightly affected by dispersing agents, remanent magnetization remained unchanged for fixed volume concentration [Reference Zaborski, Pietrasik and Masłowski21]. Most importantly, in this previous work, lack of effect on magnetic remanence highlights dispersing agents’ lack of effect on the main property in question in the current study. Consequently, the authors choose to use the prevailing methodology and fabricate materials without dispersing agents to determine effects due to magnetic interactions unaffected by additional interactions of chemical species (however, the topic is a good candidate for further study).
Experiment
A Microsense EV7 VSM was used to measure the magnetization of each MAE sample. The resolution of the VSM field measurement was μ0H = 10−6T and the magnetization sensitivity of the VSM was 10−7 emu at a usable gap size of 5 mm. The magnetic field strength applied by the VSM was varied from μ0H = ±1.6T. As the field strength was varied, the VSM measured the magnetization of the MAE sample to produce a magnetization-applied field hysteresis loop from which we determined the saturation m s and remanence, m r, aggregated over the particles in a sample. From these data experimentally measured squareness S exp is computed as follows:
 $${S_{\exp }} = {{{m_{\rm{r}}}} \over {{m_{\rm{s}}}}}\quad .$$
Implementation of PDF
Data were analyzed using S exp to estimate the characteristics of a von Mises PDF describing orientation of the magnetic domains contributing to the measured bulk magnetization for samples of each volume fraction tested.
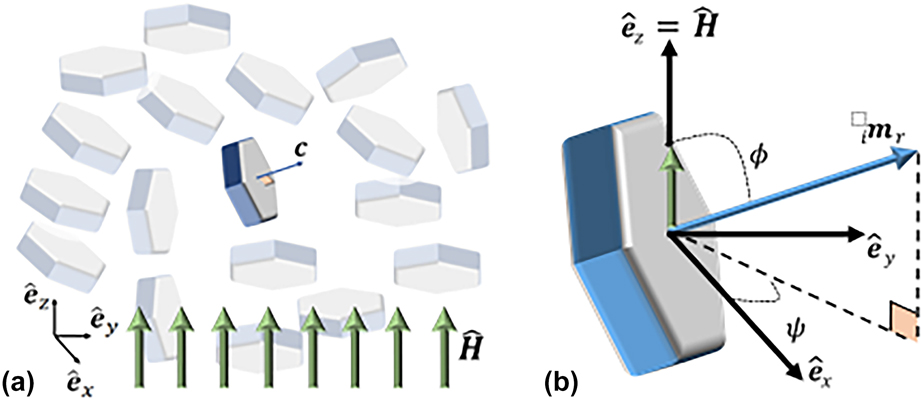
Consider the reference geometry in Fig. 6 that shows a schematic of an applied magnetic field  ${\bi{H}} = {H_\infty }{{\hat{\bi{H}}}$, where H ∞ is the magnitude of the externally applied field along unit direction
 ${{\hat{\bi{H}}}$, and particle magnetization
 $_i{{\bi{m}}_{\rm{r}}} = {m_{\rm{s}}}{\;_i}{{{\hat{\bi{m}}}_{\rm{r}}}$, where
 ${_i^}{{{\hat{\bi{m}}}_{\rm{r}}}$ is the unit direction of the ith particle’s c-axis and m s is a particle’s saturation magnetization. Herein, we assumed a particle’s magnetization was equivalent to its saturation magnetization. The azimuthal angle between
 ${{{\hat{\bi{e}}}_z}$ and
 ${{{\hat{\bi{m}}}_{\rm{r}}}$ is ϕ, and the polar angle projecting into the
 ${{{\hat{\bi{e}}}_x} - {{{\hat{\bi{e}}}_y}$ plane is ψ, such that we can write:
 $$_i{{\bi{m}}_{\rm{r}}} = {m_{\rm{s}}}\left( {\left[ {\sin {\phi _i}\cos {\psi _i}} \right]{{{{\hat{\bi{e}}}}_x} + \left[ {\sin {\psi _i}\sin {\phi _i}} \right]{{{{\hat{\bi{e}}}}_y} + \left[ {\cos {\phi _i}} \right]{{{{\hat{\bi{e}}}}_z}} \right)\quad ,$$
where  ${{{\hat{\bi{e}}}_x},{{{\hat{\bi{e}}}_y},{{{\hat{\bi{e}}}_z}$ are a Cartesian laboratory reference frame and subscript i denotes the ith particle. Note that Eq. (8) in conjunction with Fig. 1(b) denotes the magnetization along the particle’s magnetic c-axis without coercion by an external field, such that we assume a state of equivalence between remanence (e.g., H ∞ = 0) and saturation along c.
Schematic of plate-like hexagonal particles representing BHF. (a) A grouping of particles of various orientations and a single particle’s magnetization c axis. (b) Orientation of an applied external magnetic field H, particle internal magnetization imr, and azimuthal and polar angles ϕ and ψ, respectively.

Next, consider a VSM measurement determining the projection of the aggregated response of imr along  ${{\hat{\bi{H}}}$, the unit direction of H, such that:
 $${m_{\rm{r}}}\left( {{\hat{\bi{H}}}} \right) = \sum\limits_i {{m_{\rm{s}}}\left| {_i{{{\hat{{\bi{m}}}}_{\rm{r}}} \cdot {{\hat{\bi{H}}}} \right|} \quad ,$$
in which m r(·) is the remanence of the aggregate of particles, and their domains, as a function of the applied external field. We further assume uniform saturation values of the individual particles’ domains. Absolute values are taken because when the sample is magnetically saturated in the VSM, the magnetic domains of the particles align toward the direction of the applied field.
Summation over all particles may be approximated by an orientation distribution function yielding:
 $$\eqalign{\left\langle {{m_{\rm{r}}}\left( {{\hat{{\bi{H}}}},\sigma } \right)} \right\rangle \cr= {1 \over {2\pi \times {N_{\rm{f}}}}}\int_0^\pi {\int_0^{2\pi } {f\left( {\phi |{\sigma ^2}} \right){m_{\rm{s}}}\left| {_i{{{{\hat{\bi{m}}}}_{\rm{r}}} \cdot {{\hat{\bi{H}}}} \right|\sin \phi {\rm{d}}\psi {\rm{d}}\phi } } \quad ,$$
where N f is a normalizing factor, f(ϕ|x, σ2) is a PDF, σ2 is a distribution width parameter associated with the PDF (i.e., the variance for a Gaussian distribution), and 〈·〉 denotes averaging over the distribution. The PDF is written only in terms of ϕ because polar symmetry about  ${{{\hat{\bi{e}}}_z}$, the applied magnetic field direction, is considered a reasonable assumption.
The normalizing factor is defined as follows:
 $${N_{\rm{f}}} = \int_0^\pi {f\left( {\phi |{\sigma ^2}} \right)\sin \phi {\rm{d}} \cdot \phi } \quad ,$$
and ensures, along with 2π in the denominator of Eq. (4), that the form of the PDF does not scale the observed quantity.
Given  ${{\hat{\bi{H}}} = {{{\hat{\bi{e}}}_z}$ as the measurement direction, Eq. (4) reduces to:
 $$\left\langle {{m_{\rm{r}}}\left( \sigma \right)} \right\rangle = {1 \over {{N_{\rm{f}}}}}\int_0^\pi {f\left( {\phi |{\sigma ^2}} \right){m_{\rm{s}}}\left| {\cos \phi } \right|\sin \phi {\rm{d}}\phi } \quad .$$
Now, we may write the PDF approximation of Eq. (7), e.g., an approximation of an aggregate squareness measurement, 〈S(σ)〉, as follows:
 $$\left\langle {S\left( \sigma \right)} \right\rangle = {{\left\langle {{m_{\rm{r}}}\left( \sigma \right)} \right\rangle } \over {{m_{\rm{s}}}}}\quad ,$$
which depends on the particle saturation and aggregate remanent magnetizations of the material, known or measurable quantities, and the unknown width of the PDF’s distribution, σ. Finally, σ may be estimated from Eqs. (7) and (11)–(13) by finding σ that best satisfies:
 $${S_{\exp }} = {1 \over {{N_{\rm{f}}}}}\int_0^\pi {f\left( {\phi |{\sigma ^2}} \right)\left| {\cos \phi } \right|\sin \phi {\rm{d}}\phi } \quad .$$
A Gaussian distribution function is considered first in Eq. (9), where the width distribution parameter, σ, is equivalent to the Gaussian standard deviation, namely:
 $$f\left( \phi \right) = {1 \over {\sqrt {2\pi {\sigma ^2}} }}{{\rm{e}}^{ - {{{\phi ^2}} \over {2{\sigma ^2}}}}}\quad .$$
As σ → 0 increasing magnetic domain alignment within the MAE would be observed while as σ → ∞ decreasing magnetic alignment would be observed.
A higher fidelity representation of particles alignment, however, may be accomplished by using a circular distribution such as the von Mises distribution, the circular equivalent to the Gaussian distribution on a line. Whereas the Gaussian distribution admits, although with small probability, observations outside the physical range of ϕ ∈ 0…π, the von Mises distribution restricts the cumulative summation of observations to be within the desired physical domain. Furthermore, by setting the von Mises distribution’s mean to a poling (or a nominal alignment) orientation, the PDF allows for estimation of particle orientation about this orientation. The von Mises distribution is given in Eq. (10) [Reference Saxena, Pelteret and Steinmann22, Reference Gasser, Ogden and Holzapfel23, Reference Holzapfel and Ogden24] as follows:
 $$f\left( {\phi |b} \right) = 4\sqrt {{b \over {2\pi }}} {{{{\rm{e}}^{b\left( {\cos 2\phi + 1} \right)}}} \over {{\rm{ERF}}\left[ {\sqrt {2b} } \right]}}\quad ,$$
where the parameter b ∈ [0…∞], termed the concentration factor, measures the width of the distribution and ERF[·] denotes the error function [Reference Saxena, Pelteret and Steinmann22, Reference Gasser, Ogden and Holzapfel23, Reference Holzapfel and Ogden24]. The concentration factor b replaces σ2 in Eq. (14) as the parameter controlling distribution width and therefore may be determined from solution of Eq. (14) with f(ϕ|b) replacing f(ϕ|σ2).
While b represents the concentration of observations about the mean, the dispersion factor of the von Mises PDF, κ, provides a bounded metric of alignment and is computed from the following equation:
 $$\kappa = {1 \over 4}\int_0^\pi {f\left( {\phi |b} \right){{\sin }^3}\phi {\rm{d}}\phi } \quad .$$
As κ → 0 the domains of the magnetic particles become perfectly aligned. Conversely, as κ → 1/3 the magnetic domains achieve a uniform distribution [Reference Gasser, Ogden and Holzapfel23, Reference Holzapfel and Ogden24].
Acknowledgments
We gratefully acknowledge the support of the National Science Foundation EFRI Grant number 1240459 and the Air Force Office of Scientific Research. Any opinions, findings, and conclusions or recommendations expressed in this material are those of the author(s) and do not necessarily reflect the views of the National Science Foundation.