Scholars have always seen the years 1878 and 1879 as “the greatest internal revolution in the modern history of Imperial Germany.”Footnote 1 During these years, Otto von Bismarck, prime minister of Prussia and chancellor of the newly founded Reich, dismissed his former liberal partners and forged a new alliance with the conservative forces in the imperial parliament. While this move has occasionally been overrated, with some historians calling it a “second foundation of the Reich,” there is no doubt that it set a new strategic direction.Footnote 2 From the point of view of commercial policy, the shift from free trade to protection for agricultural and industrial products, which was part of Bismarck's change of policies, is most important: while it conformed to a general trend in European commercial policies, Germany was one of the first countries to implement it in practice. The empire was at the forefront of what would become a large-scale setback for globalization in the period before World War I.
The question as to why this fundamental change occurred has been viewed from diverse angles (they are surveyed by P. A. Gourevitch).Footnote 3 Hans-Ulrich Wehler and Otto Pflanze have pointed out that in contrast to the member states of the Reich, whose finances were based on tax revenues, the Reich itself had a relatively small income from taxes.Footnote 4 They suggest that Bismarck intended to introduce tariffs in order to increase his financial leeway by netting profits from customs revenues. That way he could improve the Reich's finances, increase its independence from the states, and get rid of the liberals, whom he detested. Regardless of which motive dominated the chancellor's decision, to pursue his plans he first needed a cooperative majority in parliament. Given his well-known political preferences, this had to be a conservative majority.
Bismarck took advantage of two attempts on the kaiser's life and concentrated his electoral campaign on attacking the Social Democrats, thereby trying to draw attention away from the tariff issue. Bismarck's antisocialist campaign failed, however, and the tariff issue remained the first point on the agenda for the election of 1878. Helmut Böhme's terming that election “protectionist election” seems appropriate.Footnote 5 Trade policy was the issue which polarized the political parties of the Reich, with free traders forming one bloc and protectionists another.
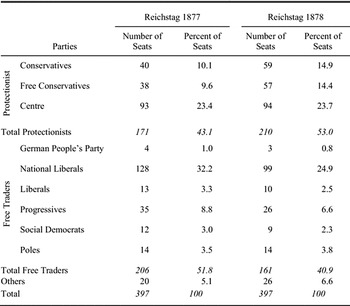
The 1878 election brought Bismarck the changes he desired and allowed him to introduce high tariffs on agricultural and industrial products: The free trade liberals, who had a majority in the Reichstag (the German parliament), in 1877, lost 45 seats in 1878 to the advantage of protectionist parties.
The questions which this article seeks to answer are: Where did the votes for protection come from? Were voters who objected to free trade new voters, or did they change their political allegiance? Which economic sectors were they in and can voting behavior be explained by applying economic theory, and thus be considered as being rational?
My answers to these questions will differ in several aspects from prior research, both in terms of the methodology used and the data employed in the analysis. Up to now, most research on the link between German elections and trade policies has made use of standard econometric tools, such as logistic models and multivariate regressions. But since the 1990s political scientists have begun to use a more suitable approach, King's algorithm, to analyze modern elections.Footnote 6 It provides estimates of the voting behavior of different groups of voters, by first determining bounds for the distribution of votes and then by applying a Monte Carlo simulation, in order to estimate the average number of votes for particular parties among certain groups. By providing point estimates and confidence intervals for the votes of different groups of voters for every constituency, it extracts much more information from the available data than simpler methods and is, therefore, preferable to older approaches. King's algorithm also provides a solution to the so-called problem of ecological inference. This problem, which I discuss more extensively below, appears when one tries to draw inferences about the motives of individuals—such as voters—on the basis of aggregate data that apply to whole populations—such as election results.Footnote 7
As for the data, it is striking that most previous research is based on data aggregated not at the level of constituencies, but of larger administrative units: the Regierungsbezirke. The implicit or explicit assumption is that the necessary data do not exist at the level of constituencies. In fact, however, most data from the census of 1882, published in the Statistik des Deutschen Reichs, new series vol. 2, were compiled at the Kreise level (the basic administrative unit above the level of parish or township, and a component of constituencies, which were larger than Kreise). This makes it possible either to aggregate data or to approximate the values at the level of constituencies. Thus, with minor adjustments, the census data can be used to analyze the elections at the end of the 1870s. In the process, the number of observations rises from 68 (based on larger administrative units) to 397 (based on constituencies).
The rest of the article proceeds as follows. After briefly discussing the tariff debate and the existing literature, I will summarize the voting system of Imperial Germany and then examine the interests of different groups of voters. Next, I explain the problem of ecological inference, discuss the data and present the results of an analysis using King's algorithm. The next step is to probe the motives of the critical agricultural voters by using the estimated votes for protection as a dependent variable in a second-stage regression. The article concludes by summarizing the implications of the results for German history and the growth of protectionism in the late-nineteenth-century Europe.
THE POLITICS OF TARIFF REFORM
At the end of the 1870s parties in Germany formed two blocs: the conservatives and the Centre being protectionist, and the others being in favor of free trade. Several liberal parties (German People's Party, National Liberals, Liberals, and Progressives) existed side by side, all supporting free trade.Footnote 8 The Social Democrats’ position on free trade was somewhat ambiguous during the first decade of the empire, but toward the end of the 1870s the party press warned workers not to vote for protectionist parties.Footnote 9 The Catholic Centre Party, having been branded as “anti-national” by Bismarck during the so-called Kulturkampf period from 1871–1878 (when the chancellor tried to strengthen the secular state and to reduce the influence of the Catholic Church by imposing sanctions on Catholics), saw a chance to gain influence by supporting the chancellor on issues of commercial policy. When the Kulturkampf abated, the Centre accordingly came out in favor of protectionism.Footnote 10 The conservatives, although split between two parties, Conservatives and Free Conservatives, were closely linked with agrarian protectionist pressure groups and advocated protective tariffs.Footnote 11 Finally, there were a number of parties that represented ethnic minorities, among which the Poles were the most important. In parliament, the Polish Party, whose stronghold was the Prussian province of Posen, regularly voted in favor of free trade.Footnote 12
Table 1 shows the results of the general elections in 1877 and 1878. In 1877 the free trade liberals still had a majority, which they lost to protectionist in 1878: The free trade supporting parties lost 10.9 percentage points of seats, while the parties that promoted protectionism gained 9.9 percentage points. With 53 percent of the seats, the protectionists now constituted the majority.
Figure 1 shows the geographical distribution of free traders and protectionists after the general election in 1878. The darker shaded areas show the protectionist majority and the lighter areas the ones with a free trade majority. It also shows the constituencies that changed from a protectionist majority to a free trade majority and vice versa. Free traders lost votes all over Germany, although they suffered the greatest losses in East Prussia, which in 1877 had been fairly evenly divided between free traders and protectionists.
RESULTS OF THE GENERAL ELECTIONS

GERMAN GENERAL ELECTION RESULTS, 1877 AND 1878

Source:
Ritter and Niehuss, Wahlgeschichtliches Arbeitsbuch.
Alexander Gerschenkron and James Sheehan believe that the collapse of the liberals occurred because of the antisocialist government campaign in conjunction with the efforts of the conservatively inclined Junkers, who brought to the polls masses of rural laborers who had not voted before.Footnote 13 Agriculture certainly played a significant role in changing the majority in the parliament, but it is not clear in which way. Scholars do not even agree about whether the interests of agriculture were homogeneous. Did peasants, Junkers, and agricultural laborers have the same interest and vote in the same way? In other words, did all men working in the agricultural sector vote for the same policy, independent of their status or farm size or the production mix of the farms on which they worked? Did it make a difference where laborers worked, and did Junkers motivate their laborers so much that the increased turnout among them caused the change in parliament? While the interest of large landowners, who mainly produced grain, can be clearly identified as “pro-tariff,” the interest of small farm owners and peasants, who dominated in southwest Germany, is harder to determine, as I will discuss in more detail on page 154ff.
Apart from the hypothesis that the mobilization of farm hands caused the power shift, there are other explanations that focus on the motives of voters, which may have changed between 1877 and 1878. Ronald Rogowski, for example, applies the Heckscher-Ohlin-Samuelson model to a world with three factors of production: land, labor, and capital.Footnote 14 According to Rogoswki, Germany was relatively abundant in labor and land, but relatively scarce in capital until about the mid-1870s. A decline in transportation costs allowed a massive entry of producers from countries abundant in land, such as the United States and Russia, into the international grain market, making Germany relatively scarce in both capital and land. Agriculture reacted to these changes by joining industry in support of protection, the two sectors concluding the notorious “marriage of iron and rye” in 1879. Yet, if Rogowski is right and one takes into account the fact that most voters were workers, the majority of voters should have voted for free trade. Furthermore, it seems implausible that such a major realignment could have occurred within one year.
Gourevitch, by contrast, assumes that certain factors of production are “specific” to a particular industry.Footnote 15 For example, one could assume that labor is specific and workers would then be immobile between sectors and see their fate tied to the sector in which they work. The change in 1878 could then perhaps be explained by changes in trade balances. Some sectors became more import-competing, while others, like agriculture, turned from being export-orientated to import-competing. Most workers ended up in import-competing sectors; they therefore would have voted for protection. The Junkers, who were motivated by a decline in grain prices, led this protectionist coalition, along with the producers of iron and steel. That, in a nutshell, is the rationale behind Gourevitch's argument.Footnote 16 He focuses, however, not particularly on the change of politics in Germany but rather on explaining trade policies on a worldwide level.
Adam Klug also applies a specific factors model in order to determine whether workers voted according to their sectoral interests in the elections in 1877 and 1878.Footnote 17 He finds that most sectors did not significantly vote according to their sectoral interests, and is therefore unable to explain the shift in interest in 1878. The reason is that he uses data on a very high level of aggregation and applies a flawed methodology—a simple logit regression with too few observations. He therefore ignores the problem of ecological inference, which will be explained later in detail. Cheryl Schonhardt-Bailey studies roll-call votes on tariffs in the parliament.Footnote 18 She analyzes whether members’ votes were determined by the interests of their constituencies. She focuses on the agricultural sector in particular and asks whether constituencies in which grain producers formed the majority voted differently from ones in which animal husbandry dominated. She finds that there is indeed evidence for a split between grain producers and animal producers in the voting behavior for the conservative parties, but does not find clear patterns for liberal parties. Mark Brawley uses a model in which labor is neither stuck in a sector, nor completely mobile.Footnote 19 Like Schonhardt-Bailey, he focuses more on explaining German trade policy over a longer period, rather than on the problem of why voters moved towards parties that supported protectionism in 1878.Footnote 20 As this brief synopsis of the research shows, the question of why voters turned from supporting free trade to protection has not yet been satisfactorily answered.
THE CONSTITUTIONAL BACKGROUND
From 1871 until 1912 elections were held directly in single-member constituencies with representatives elected by a majority. The constitution determined that general elections—that is, those at the level of the Reich—were to be held according to the principle of “one man, one vote.” The suffrage extended to men aged 25 and over with the exception of persons under tutelage, bankrupts, and persons on poor relief. At that time, this was Europe's most democratic franchise (the electoral laws of the member states of the Reich, in particular Prussia, were less democratic). Constitutional reality, however, was different. For one thing, constituencies, which were originally based on the results of the census of 1864, remained largely unchanged between 1871 and 1918 despite rapid urbanization and intra-German migrations.Footnote 21 As a consequence, in 1912 the slightly more than 10,000 inhabitants of the constituency of Schaumburg-Lippe, a small state in northwestern Germany, had the same number of parliamentary delegates as the almost 340,000 inhabitants of the constituency of Teltow, on the southern outskirts of Berlin.Footnote 22 In the long run, therefore, rural constituencies had an advantage over urban constituencies.
Furthermore, the parliament did not elect the head of the government and his fellow ministers. Instead, they were chosen by the kaiser, who usually appointed the Prussian prime minister as the Reich's chancellor. The Reichstag did have some right of legislative initiative, being able to propose laws or to refuse to agree to laws proposed by the executive, but its rights were quite limited, because the emperor had the right to dissolve the parliament and call new elections at any time. In practice, however, the kaiser left all decisions to his chancellor, who needed the majority of the parliament to pass a law. The composition of the parliament therefore did clearly matter.
COMMERCIAL POLICY INTERESTS
The majority of voters were not the owners of farms or large estates, factories or smaller workshops, but rather workers, clerks, or other employees.Footnote 23 Hence, electoral results mainly represent the votes of “labor.”
As mentioned above, two different models have traditionally been used to explain the formation of commercial policy interests. On the one hand, there is the Heckscher-Ohlin-Samuelson model, which assumes that owners of land and capital owners favored protection, because land and capital were scarce in Germany at the time. Employees, on the other hand, being mobile between occupations and therefore not strongly interested in the welfare of their current sector, would generally have been in favor of free trade, because labor was relatively abundant. According to this model, the policy preferences of the agricultural sector vary depending on farm size. Small farms specialized in labor-intensive products and had a relatively high ratio of labor and land, whereas large farm owners specialized in land-intensive products (see figure 2). If the agricultural sector voted rationally, it would therefore not vote homogenously. Small farmers and agricultural workers would vote for free trade, whereas large farmers would vote for protection.
The other model which is often applied is the specific factors model. Here, labor is specific (i.e., immobile between sectors), and workers share the interests of their employers and vote in their sectoral interest. Thus, voters working in an import-competing sector would have favored protection, those working in an export sector free trade.
While there is indeed some anecdotal evidence from the 1870s that may point to workers favoring the protection of their specific sectors, the specific factors model is open to several criticisms.Footnote 24 First, the transportation of goods and passengers was already quite well established in 1880 and migration within Germany had increased greatly since 1870.Footnote 25 Furthermore, Rüdiger Hohls shows evidence for wage convergence between sectors from 1850 onwards.Footnote 26 Nonetheless, it is likely that labor in Germany, was not completely mobile. The mobility between sectors probably varied regionally and also depended on sectors.
FARM SIZES IN HECTARES AND THE COMPOSITION OF OUTPUT
If labor was thus partly specific, then the interests of certain groups of voters can be identified by trade balances. Figure 3 shows trade balances for 1872 (a boom year) and 1877 (when the economic downturn was well under way). A negative trade balance indicates an import-competing sector which would have an interest in protection; a positive balance indicates an export sector in which workers would prefer a free trade policy. Most sectors were affected by the cyclical downturn in the late 1870s. As Figure 3 shows, the sector that was hit hardest was agriculture (especially rye and wheat).
GERMAN TRADE BALANCES BY SECTOR IN 1000 “REICHSMARK,” 1872 AND 1877
The grain invasion of the late nineteenth century mainly affected owners of the large estates in the eastern provinces of Prussia, particularly the Junkers, who had specialized in growing rye. The trade deficit for rye rose from 253.9 to 1720.4 million marks within five years. The same development can be observed for all other kinds of grain. If the policy preferences of the agricultural sector can be determined by the production mix of farms of different sizes, then owners of large farms, which specialized in rye and wheat production, had a clear interest in protection. The interests of peasants, however, are not so clear in this framework. If Steven Webb was right, then peasants also benefited from the protection of animal products which outweighed the impact of protection on the price of fodder.Footnote 27
Diverging interests crop up in other sectors as well. In mining, for example, interests depended on the kind of coal or ore that was produced. Brown coal mines, as were import-competing in 1877 with a trade balance of –52 million marks, whereas black coal and iron ore were export goods with trade balances of 78 and 16 million marks (Figure 3), respectively. As for the construction industry, it did not produce tradable goods and it did not yet depend on imported raw materials or require much factory-produced machinery or similar capital goods. Hence, the owners of construction firms were primarily interested in cheap labor. They therefore should have opposed measures which might force them to raise wages, such as tariffs on imported food.Footnote 28
To summarize, if workers were not completely mobile between sectors, they should have voted according to their sectoral interests. Thus, trade balances should predict voting behavior. Workers employed in import-competing sectors should have voted for protection and voters in export sectors for free trade. For the agricultural sector, we would expect owners of large estates and their workers to have voted for protection. Owners of smaller farms for free trade, although they might also have voted if Webb is correct in arguing that protection was on balance to their benefit. Footnote 29
By contrast, if workers were mobile between sectors, a Heckscher- Ohlin model would be more appropriate. On the basis of such a model, we would expect workers to have voted for free trade, independent of sectoral interests, while owners of capital and landowners would favor protection. In that case, the majority of voters should have voted for free trade, since most voters received the greater part of their income through wages, rather than as rent or capital rewards. Thus we would not observe voting according to trade balances. In agriculture, workers and peasants would have voted for free trade, since peasant farms had a high ratio of labor to land; owners of large estates, by contrast, would have voted for protection.
KING'S SOLUTION TO THE ECOLOGICAL INFERENCE PROBLEM
As mentioned in the introduction, Gary King's solution to the problem of ecological inference makes it possible to estimate how different occupations voted in each constituency.Footnote 30
The nature of ecological inference problems can best be explained with the help of an example. Suppose that in a certain election, we know how many votes were cast for free trade supporting parties and how many for protectionists, and we know how many voters were farmers and how many worked in other sectors. This information is available for every constituency. What we are interested in is the voting behavior of individuals, or at least of sub-aggregates, for example how many farmers voted for free trade in a particular constituency. Why is answering such questions a problem? Assume that in one constituency 30 percent of the electorate consists of farmers and that 30 percent of the votes are for parties that support free trade. In a second constituency, 40 percent of the electorate consists of farmers and 40 percent of votes were cast for free trade supporting parties. It thus seems that there is a perfect positive correlation between farmers and votes for free trade. Yet no matter how intuitive this relationship may seem to be, farmers might not actually have voted for free trade at all. The votes for free trade might come from industrial workers, who could conceivably favor free trade supporting parties in districts dominated by agriculture. Hypothesizing about the behavior of individuals by using aggregate data can therefore be misleading—the problem of ecological inference. The problem is well known in political science: William Ogburn and Inez Goltra introduced it in the very first multivariate statistical analysis ever to have been published in a political science journal, and it has been among the longest standing unsolved problems in quantitative social science.Footnote 31
Precisely this problem rears its ugly head if we try to determine which occupations caused the shift in parliament in 1878, if new voters or floating voters were primarily responsible, and why these groups voted the way they did. We have only aggregate data: election results, shares of specific occupations in specific regions, and so forth.
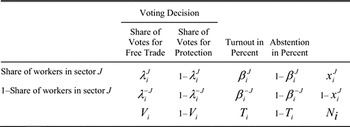
Table 2 shows how the problem can be illustrated in a formal manner. Suppose we want to find out whether or not workers in a specific sector voted for parties that supported free trade. The table shows the problem for one constituency and for two groups of voters, i.e., for those favoring free trade and protection, respectively. Here the workers employed in sector J are the voters of interest.
THE ECOLOGICAL INFERENCE PROBLEM FOR CONSTITUENCY I AND OCCUPATION J

Notes:
x Ji is the share of the workforce in constituency i employed in sector J. This could be, for example, the share of farmers. Vi is the share of votes for free-trade-supporting parties in constituency i and 1–Vi the share of votes for parties that support protection. Ti is the percentage turnout. These values are known. The unknown quantities of interest are λJi, which is the share of workers in sector J in constituency i who voted for free trade; λ−Ji, which is the share of workers of sectors outside J who voted for free trade;βJi, which is the turnout of the workers in sector J in constituency i; and β−Ji, which is the turnout of workers in other sectors.
Source:
See the text.
For every constituency, national statistics provide the values in the margins of the table, where index i indicates constituency i, and J indicates sector J. xji is the share of the workforce in constituency i employed in sector J. This could be, for example, the share of farmers in constituency i. Vi is the share of votes for free trade supporting parties in constituency i and 1–Vi the share of votes for parties that support protection. Ti is the percentage turnout for constituency i. Data on voting shares and turnout per constituency for Germany are provided by Danièle Caramani.Footnote 32 What these statistics do not show, however, are the values in the inner cells of the table, such as the shares of various occupations in a particular constituency that voted for free trade, for protection, or abstained; that is the λi s and βi s, which are not directly observed λJi is the share of workers in sector J in constituency i who voted for free trade and 1-λJi is the share of workers in sector J who voted for protection. For example, assuming that J is the agricultural sector, λJi is the share of farmers who voted for free trade and 1-λJi the share of farmers who voted for protection. Similarly, 1-λ−Ji is the share of nonagricultural workers who voted for free trade, and 1-λ−Ji is the share of nonagricultural workers who voted for protection. βJi is the turnout of the workers in sector J in constituency i. Clearly, these parameters are the really relevant ones if we are interested in why the protectionists won the 1878 election in Germany. Estimating these values not only provides far more and better information about the voting behavior of different sectors than other methodological approaches, but also creates new dependent variables that can then be used to study influences on voters’ decisions.
King begins by observing that we can deterministically put some limits on individual behavior from the available aggregate data. Assume that we observe two types of voters (farmers and nonfarmers) and two voting options (voting or not voting). The turnout in constituency i (Ti) is just the proportion of farmers who voted in this district (βJi) times the share of farmers in constituency i (Xi), plus the proportion of nonfarmers who voted multiplied by the share of nonfarmers in this constituency

Since the turnout is known, the true proportions of voters among farmers and nonfarmers must fall somewhere on a downward sloping line, whose slope is determined by the ratio of farmers to nonfarmers, and whose intercepts will depend on the turnout as well
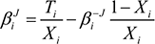
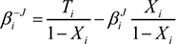
If we had only one set of aggregate data, for example, information on turnout and the share of farmers for the whole of Germany, this would be as far as we could go, but we have aggregate data for every constituency. Each set of aggregate data, that is, every constituency, gives us such a line. They can all be drawn in one plot, the tomography plot.Footnote 33 This is informative, but does not provide enough information to get a clear solution. There is no exact way of recovering the values in the inner cells of table 2. The simplest assumption to start with is that the true proportions for each constituency are picked at random from some distribution, but that all constituencies are drawn from the same population. King focuses on the case where that distribution fits the joint probabilities to a truncated bivariate normal distribution so that all proportions are between 0 and 1. In order to get the parameters from the truncated bivariate normal distribution, King uses the lines from the tomography plot. The normality assumption helps detect the mode on the tomography plot, where most of the lines cross, and improves estimates by “borrowing strength” from other constituencies. Intuitively, the most likely values for βJi and β−Ji are nearest the mode. Adding a couple of modest assumptions, five intermediate parameters that define the truncated bivariate distribution are estimated via a maximum likelihood function. The parameters are then transformed and rescaled. The means of the distribution of βJi and β−Ji are used as point estimates, and standard errors are based upon the variation in the simulated values. Thus King's algorithm provides sub-estimates for every constituency and thereby extracts much more information from the available data than simpler econometric tools.
Furthermore, one can use additional information as control variables to ensure the quality of the estimation. If chosen correctly, these variables will control for “aggregation bias.” Aggregation bias occurs if the variation of the parameters βJi and β−Ji or λJi and λ−Ji in specific areas differs from the general pattern of the aggregated constituency. One simple example will clarify this. Assume that on the individual level, the turnout of nonfarmers systematically exceeds the turnout of farmers. Assume as well that there is a positive correlation between turnout and the share of farmers, if we look at all constituencies. The mistaken ecological inference is that farmers vote at higher levels than nonfarmers even though the opposite is true.
The way to resolve this problem is to choose control variables that explain the rise in turnout.Footnote 34 I include such covariates in the estimation of the agricultural sector, since I use the point estimates of the λJi in a second-stage regression. Therefore, I need to include all independent variables from this regression as covariates in the first estimation.Footnote 35 For the other sectors, I also tried covariates, but the results did not vary perceptibly. That suggests there was little aggregation bias in the first place.
A complete description of the methods used to estimate all these parameters is quite long. For all the details, interested readers can consult the longer working paper version of the article and King.Footnote 36
RESULTS
Figure 4 shows the occupational categories in Germany for males over the age of 14. Although males were allowed to vote only from the age of 25, national statistics do not provide more detailed information about the ages of different occupational groups. I assume that the share of occupations shown in Figure 4 equals the distribution of the electorate among different sectors, although I am aware some of the shares might be slightly overestimated or underestimated.
OCCUPATIONAL CATEGORIES, GERMANY 1882
I will first present the results for the betas (the turnout among occupations) to determine whether it was new or floating voters who made the difference. The estimation provides separate point estimates for every one of the 396 constituencies. Rather than presenting all 396 point estimates separately, I broke down the constituencies into different regions, and present the average of these point estimates across constituencies in each region.
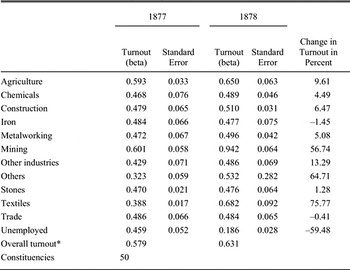
Table 3 provides the average estimation results for all 396 constituencies. The overall turnout increased slightly from 60.6 percent in 1877 to 62.3 percent in 1878.Footnote 37 Since I estimated turnout for each sector separately, I also provide the estimated overall turnout, i.e., the weighted sum of the turnout for each sector, where the weights are the number of voters from each sector. As one can see, the result is close to the turnout provided from national statistics, which lends credence to the estimation process. Overall, the relevant diagnostic tests for the sectors show no signs of aggregation bias.Footnote 38
RESULTS FOR GERMANY, TURNOUT (BETAS) AMONG OCCUPATIONS

*Ritter and Niehuss, Wahlgeschichtliches Arbeitsbuch.
Notes:
Figures are mean quantities by occupation. “Other industries” covers the production of machines and scientific apparatus, leather and paper, woodworking, food, and clothing. “Others” covers the remaining sectors: forestry, fishing, peat-cuttering, printing, arts, insurance, lodging, servants, and public servants.
Source:
See the text.
The first notable result achieved with the help of King's method is that in 1878 turnout in agriculture increased only slightly, by about 0.5 percent, which is approximately 1660 votes more than in 1877. Thus it seems that it was not increased turnout in the agricultural sector which made the difference in the election in 1878. The turnout of voters employed in the iron industry, the other party in the “marriage of rye and iron,” even decreased slightly from 53.6 to 53.1 percent of votes. Most of the new voters, it turns out, actually came from mining, textiles, and “other industries.”
Using King's algorithm, we can estimate the turnout by occupation for specific regions. Table 4 provides the results for East Elbia.Footnote 39 Here, the turnout in the agricultural sector increased by 10.5 percent, from 56 to 61.9. The agricultural sector in this area was dominated by large estates, which specialized to a large extent in grain production and can therefore be expected to have been protectionist. There might therefore be some truth to Gerschenkron's hypothesis that parliament changed because rural workers in East Prussia who had not voted in 1877 suddenly ran to the polls in 1878.Footnote 40 However, this hypothesis can only be confirmed by looking at those constituencies where the liberals lost the majority.
RESULTS FOR EAST ELBIAN PRUSSIA, TURNOUT (betas) AMONG OCCUPATIONS

*Ritter and Niehuss, Wahlgeschichtliches Arbeitsbuch.
Notes:
Figures are mean quantities by occupation. “Other industries” covers the production of machines and scientific apparatus, leather and paper, woodworking, food, and clothing. “Others” covers the remaining sectors: forestry, fishing, peat-cuttering, printing, arts, insurance, lodging, servants, and public servants.
Source:
See the text.
In 1878 the liberals lost 50 seats and won 4 (see Figure 1). In the constituencies where the liberals lost the turnout estimates still support Gerschenkron's hypothesis (Table 5).Footnote 41 Turnout among people employed in the agricultural sector increased by 9.6 percent. The other two sectors which experienced a significant increase in votes were mining and textiles. The category “others,” which includes the remaining sectors— forestry, fishing, peat-cutting, printing, arts, insurance, lodging, public servants, and servants—also seems to have had a huge rise in turnout. All of these sectors, however, have only a very small absolute number of voters and can therefore be ignored.
RESULTS FOR THE CONSTITUENCIES IN WHICH THE LIBERALS LOST THE VOTE, TURNOUT (BETAS) AMONG OCCUPATIONS

*Ritter and Niehuss, Wahlgeschichtliches Arbeitsbuch.
Notes:
Figures mean quantities by occupation. “Other industries” covers the production of machines and scientific apparatus, leather and paper, woodworking, food, and clothing. “Others” covers the remaining sectors: forestry, fishing, peat-cuttering, printing, arts, insurance, lodging, servants, and public servants.
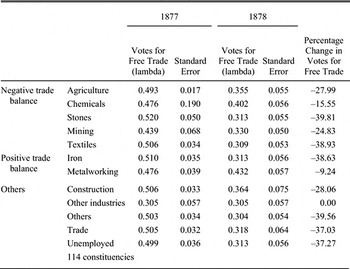
Tables 6 and 7 provide the average values of the estimates of the lambdas of Table 2, i.e., the share of votes for free trade, for both the 1877 and 1878 elections, by sector and for different geographical areas. The sectors are classified according to their trade balances in order to see whether the specific factors model can predict voting behavior. All other sectors, i.e., those which have an interest that cannot clearly be defined, such as mining, and non-traded sectors, such as construction, are not classified.
RESULTS FOR GERMANY, SHARE OF VOTES FOR FREE TRADE BY SECTOR (lambda)

Notes:
Figures mean quantities by occupation “Other industries” covers the production of machines and scientific apparatus, leather and paper, woodworking, food, and clothing. “Others” covers the remaining sectors: forestry, fishing, peat-cuttering, printing, arts, insurance, lodging, servants, and public servants.
RESULTS FOR EAST ELBIA, SHARE OF VOTES FOR FREE TRADE BY SECTOR (lambda)

Notes:
Figures mean quantities by occupation. “Other industries” covers the production of machines and scientific apparatus, leather and paper, woodworking, food, and clothing. “Others” covers the remaining sectors: forestry, fishing, peat-cuttering, printing, arts, insurance, lodging, servants, and public servants.
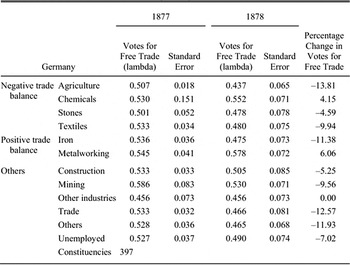
The results for Germany as a whole (table 6) explain why Klug found that most occupations had no significant preference for a certain trade policy.Footnote 42 In 1877 the shares of votes for free trade and protectionism were fairly similar in each sector: In agriculture, for example, 50.7 percent of voters voted for free trade and 49.3 percent for protection. However, the important election was the one in 1878 and here the picture changed.
The majority of voters employed in agriculture, textiles, stones, and metalworking now tended to vote according to their sectoral interests as defined by sectoral trade balances. The largest shift towards protection was in the agricultural sector. Here the share of votes for free trade dropped by 13.8 percent. Support for free trade also fell off sharply in the iron industry (Table 6). It seems that the famous “marriage of rye and iron,” the coalition between heavy industry and large landowners, dominated the change in votes in the election in 1878. But voters in the textile sector also rallied for protectionism, 52 percent of them in 1878, as opposed to only 46.7 percent in 1877.
Again, it is possible to make estimates for different regions. In East Elbia (table 7), nearly all sectors seem relatively indifferent between free trade and protection in 1877, but in 1878 protectionist parties gained support across all sectors. The slight lead of protectionist became a clear protectionist majority. Although turnout in this sector increased by 10.53 percent, quite a large number of voters rejected free trade, since the share of votes for free trade decreased by 27.9 percent.
As we have seen in table 4, a large number of new votes were cast in the mining and textiles sectors. In both sectors, votes for free trade plummeted with shares dropping 24.83 and 38.93 percent, respectively. In East Prussia, the mining sector mainly focused on brown coal, which was import-competing (see Figure 3). Miners in East Prussia would thus have had an interest in protection, and indeed voters from this sector voted for protection in both years. This result supports the hypothesis that the specific factors model can predict voting behavior to a certain degree. The main point of the table, however, is that the entire region shifted towards protectionism, except for “other industries,” and not just the agricultural sector.
The results for the constituencies where the liberals lost the majority are shown in table 8. All sectors except “other industries” voted for free trade in 1877. In 1878 voters employed in agriculture and textiles changed their voting behavior, which eventually changed the electoral result.
RESULTS FOR THE CONSTITUENCIES IN WHICH THE LIBERALS LOST THE MAJORITY, SHARE OF VOTES FOR FREE TRADE BY SECTOR (lambda)

Notes:
Figures mean quantities by occupation. “Other industries” covers the production of machines and scientific apparatus, leather and paper, woodworking, food, and clothing. “Others” covers the remaining sectors: forestry, fishing, peat-cuttering, printing, arts, insurance, lodging, servants, and public servants.
In these constituencies, the free trade votes from agriculture collapsed and fell by 43.07 percent, which was far more than the increase in turnout (from 0.593 to 0.65, from Table 5). More than new voters, it was floating voters in the agricultural sector which caused the change in favor of protectionists. Other sectors such as textiles and iron also rallied to protectionism, but in absolute votes the agricultural sector had much more influence, since it constituted the biggest part of the electorate.
While in 1877 most sectors did not vote in the way that trade balances would predict, the picture changed in 1878. Most sectors now voted in a predictable manner. The exceptions were chemicals, which were still in favor of free trade, but less so than in 1877, and the iron sector which was now in favor of protection. The latter can be explained by the more complex structure of the iron industry. The iron industry needed semifinished products, which were imported. Firms that specialized in the production of semifinished products therefore demanded protection.Footnote 43 The interest in protection might also be explained from a Heckscher- Ohlin perspective, since heavy industry is capital intensive. Capital was scarce in Germany at the time and thus heavy industry would have had an interest in protection rather than in free trade.
In summary, voters’ decisions did to a large extent depend on their sectoral interests, especially in the critical election in 1878 that caused the change towards protection. In every sector, some voters casts their ballots according to expectations derived from trade balances, which lends support to the specific factors model. It is true that there were always large groups who voted in the opposite way. Their behavior can be explained in several ways. Conceivably, the sectors consisted of different subsectors which cannot be distinguished on the basis of the available information. One example of this is the mining sector discussed above. It is also possible, that not all firms in an “export sector” actually exported.Footnote 44 But for the political landslide that occurred between 1877 and 1878, floating voters from the agricultural sector rather than new voters made the difference, even though turnout did rise.
Although the specific factors model predicts the voters’ decisions quite well, it does not help us to answer the question of why so many agricultural workers changed their mind within one year. Maybe the fact that the second election was more dominated by the tariff question triggered the change. Other political issues, which became less important in 1878, might have biased the result to the benefit of the liberal parties in the election in 1877. Another question remains as well: did the agricultural sector vote homogeneously? In other words, did agricultural workers, peasants, and large landowners all vote for protection? Did farm size matter for voting decisions? Did peasants and workers on small farms vote for free trade?
BEHIND THE CURTAIN OF THE POLLING BOOTH
To answer these questions and determine what motivated voters in the agricultural sector, we can take the estimate of the share of votes for free trade and use it as the dependent variable in a second-stage regression. The practice of using quantities generated by applying King's algorithm as dependent variables is known in the methodological literature as “EI-R.” Hence, I use the following equation for the second-stage analysis, which can be estimated by weighted least squares.Footnote 45
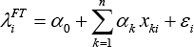
The dependent variable λFTi is the point estimate of the share of voters working in the agricultural sector who voted for free trade in district i. α0 is the constant term and the explanatory variables xki cover possible influences on voting behavior across districts. εi is the error term. I use the share of immigrants per constituency as a right-hand-side variable: the data on immigrants were taken from Statistik des Deutschen Reichs 1888. Regions with a larger share of immigrants were probably wealthier than others, offering more and better jobs and therefore attracting more workers than others. They also had higher economic growth rates and were probably more favorable to free trade. A larger share of immigrants might also indicate higher sectoral mobility, which would increase the support for free trade, on the assumption that labor was the abundant factor in Germany.
As shown above, in every region there was a group of agricultural voters who in both elections voted for free trade, but previous research does not agree on whether all agricultural producers, or only the owners of large estates, benefited from tariffs. While information about specific groups of farmers is lacking at the level of Kreise, there are data on the sizes of the farms in the Kreise. Because larger farms generally specialized in grain production and would therefore benefit from protection, while smaller farms typically specialized in animal husbandry and might therefore have been harmed by protection, farm size can be used to analyze whether the voters from the agricultural sector voted in their own interest. Hence I include variables on the size in hectares of farms from the Statistik des Deutschen Reichs 112: “Berufs- und Gewerbezählung vom 14. Juni 1895. Die Landwirthschaft im Deutschen Reich.”
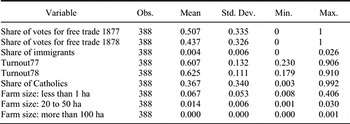
Apart from political questions such as the tariff issue, there were other, social influences on the voters’ decisions, such as tradition and religion. Catholic priests tended to encourage their parishioners to vote for the Centre party; their influence is therefore expected to have a negative influence on the share of free trade votes. The population census of 1880 provides the share of Catholics at the level of Regierungsbezirke. I assume that this share was equal in all constituencies belonging to a certain Regierungsbezirke. Table 9 gives an overview of all variables.
OVERVIEW OF VARIABLE

Source:
See the text.
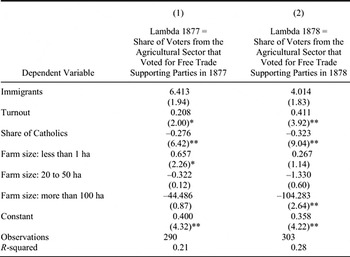
Table 10 provides the results for the elections in 1877 and 1878. The dependent variables are the shares of votes for free trade in1877 and 1878, respectively. The share of immigrants has a positive impact on voting for free trade, which suggests that richer and better-developed regions tended to attract people and were also more free trade orientated, although not significantly so. It might also indicate that increased mobility had a positive impact on voting for free trade.
RESULTS SECOND-STAGE ESTIMATION

**= significant at the 1 percent level.
*= significant at the 5 percent level.
Note:
Absolute value of t-statistics in parentheses.
Source:
See the text.
For the question of how the agricultural sector voted, let us consider the impact of farm size on voting behavior is most interesting. Voters from regions with smaller farms (under 1 hectare) favored free trade, although only significantly in 1877. Middle-sized farms seem to have been quite indifferent, as the very low t-statistics show. The large estates with more than 100 hectares have a negative sign, which is highly significant in 1878. According to the regression results, it thus seems that Gerschenkron was wrong for small farmers tended to vote for free trade.Footnote 46 Whether that was rational or not depends, however, on whether one believes the Heckscher-Ohlin and specific factors model arguments that small farmers were harmed by protection, or Webb's claim that peasants also gained from protection.Footnote 47
Another result worth mentioning is the strong impact of the share of Catholics on the decision to vote for protection in both elections. The result is driven by the votes for the Centre Party, the political arm of Catholicism, and is not surprising considering the Kulturkampf between Bismarck and the Catholic Church. When the conflict threatened to turn into a defeat for the chancellor, he decided to follow a more moderate course and, in 1878, lifted most sanctions he had imposed in the early 1870s.Footnote 48 In the Kulturkampf period, the Centre Party actually gained power, doubling the number of its voters in 1874. It remained strong until the mid-1880s and attracted Catholics who expressed their support for the church by voting Centre.Footnote 49 Margaret Anderson found a number of cases where the elections were strongly influenced by the agitation of Catholic priests and she argued that not just priests, but all of Germany's elites—the mayors of the cities as well as the Landräte (district officials) and Junkers in the countryside—tried to influence voters and could do so because the imperial election system was not sufficiently protected by secrecy.Footnote 50 Gerschenkron made a similar argument about Junkers forcing agricultural workers to vote for protection.Footnote 51 It is likely that Junkers and priests tried to influence voters and that they were successful in some constituencies.
Nonetheless, in the 1878 election voting was by and large consistent with self-interest in that sectoral votes do by and large confirm the prediction of trade models. It is clear, too, that non-economic factors such as religion mattered for a voter's decision. Even today, it is not unusual for non-economic factors to influence trade policy preferences with variables like patriotism and chauvinism influencing trade policy preferences.Footnote 52
CONCLUSION
Toward the end of the 1870s, Europe began to turn away from the free trade policies which had characterized the middle decades of the century. Germany was one of the first countries to change course, and German tariff policies affected the whole continent. Not surprisingly, therefore, research has paid considerable attention to political decision-making in Germany, and there is a broad literature that seeks to explain the country's about-turn in commercial policies, which occurred after 1878.
While this political landslide has been repeatedly studied from a quantitative perspective, prior research, especially on the tariff elections in Germany, suffers from a number of defects. First, it applies methods such as simple logistic regressions, which are not sufficient to explain voting behavior in general elections. Second, it is exclusively based on data aggregated at a relatively high level.
In this article, I use much more detailed data on the level of constituencies. I further apply King's algorithm with which I generate shares of voters from different occupations that voted for protection or free trade for every constituency, which makes it possible to break down the results for district regions.Footnote 53 That allows us to focus on constituencies where the liberals lost their seats in 1878 and to analyze them separately. The analysis changes our picture of what went on between the two elections of 1877 and 1878. In particular, the results contradict Gerschenkron's view that change was solely due to new voters from the agricultural sector.Footnote 54 He was right that there were large numbers of new voters (around 10 percent more) from the agricultural sector, especially in East Elbian Prussia. But the losses that free traders suffered to the benefit of protectionists were much higher (around 27 percent). It was thus floating voters rather than new voters from the agricultural sector who caused the change.
King's algorithm also makes it possible to analyze more closely the characteristics of those agricultural voters who turned towards protection. The existing literature has not yet revealed whether agriculture voted as a single block. Schonhardt-Bailey did provide some evidence that the agricultural sector did not vote homogeneously, but she showed this only for conservative parties.Footnote 55 My analysis goes further and yields evidence that small farmers preferred free trade, while farmers owning large estates and workers on these estates favored protection. This fits well the expectations of both the Heckscher-Ohlin and specific factors models.
But a complete answer for why voters in the agricultural sector changed their behavior in just one year remains elusive and is left to future research. It seems likely that the fact that the second election was more dominated by the tariff question caused the change. Maybe other political dimensions, which became less important in 1878, biased the result in favor of liberal parties in the election in 1877.
Explaining the political shift in 1878 is all the more important because it provided Bismarck with the conservative majority that he needed in order to diminish the influence of his former liberal allies and to prevent the liberalization—and ultimately democratization—of Imperial Germany. Protective tariffs for industry and agriculture were the price the chancellor paid. The price paid by the country as a whole ultimately proved to be much higher. Behind the protective walls of new tariffs, agriculture retained its huge share in the economy, and this did not bode well for Germany's development in the later nineteenth and twentieth centuries.Footnote 56