I. INTRODUCTION
In power amplifier (PA) design, both the problems of energy efficiency over wide dynamic range signal and the operation across a wide bandwidth are addressed separately by several design techniques [Reference Kim, Moon and Kim1–Reference Carrubba3]. The most investigated PA architectures, capable of providing a wide dynamic range and sufficient operative bandwidth, are still those referring to the envelope tracking (ET-PA) [Reference Feipeng, Yang, Kimball, Larson and Asbeck4], and to the Doherty (DPA) [Reference Choi, Kang, Kim and Kim5], techniques, although others, which are more demanding for baseband processing, are emerging [Reference Yan6–Reference Sen, Senguttuvan and Catterijee8]. Among these, the ET architecture is proven to be frequency-unaware and for this reason it represents a good candidate for the development of energy efficient PAs, which are capable of maintaining high performance across wide bandwidths or even at non-commensurate frequency carriers in multi-band concurrent applications [Reference Negra, Sadeve, Bensmida and Ghannouchi9].
The experimental validation of the above assessment motivated this work, by which we propose a concurrent dual-band ET-PA design approach based on the two following aspects. The first consists of the way in which we identify the optimum device terminations for optimized ET operation. Indeed, these are extracted from multi-bias\multi-frequency pulsed load-pull characterization, which are then post processed by using the probability distribution function (pdf) of the actual modulated signal. This pdf conscious design approach combined with the ET operation enables a significant increase of the mean energy efficiency over a wide dynamic range. The second aspect focuses on the technique by which we implement the ET bias control that relies on a proper bi-dimensional (2D) shaping function trading-off the mean energy efficiency and the ET-PA linearity.
In a previous work [Reference Cidronali, Giovannelli, Vlasits, Hernaman and Manes10], we have discussed the impact of the pdf conscious design on optimization of a dual-band ET-PA. Specifically, we measured the load-pull isoclines at different biases and then we averaged them by weighting with the actual excitation pdf, this led to termination of the ET-PA design. A technique based on multi-section transformer [Reference Fagotti, Cidronali and Manes11], enabled the synthesis of concurrent dual-band and harmonics matching. In [Reference Cidronali, Zucchelli, Maddio, Giovannelli and Manes12], we have also preliminarily discussed the impact of ET shaping, that is represented by the relationship between the instantaneous RF power and the PA drain supply voltage.
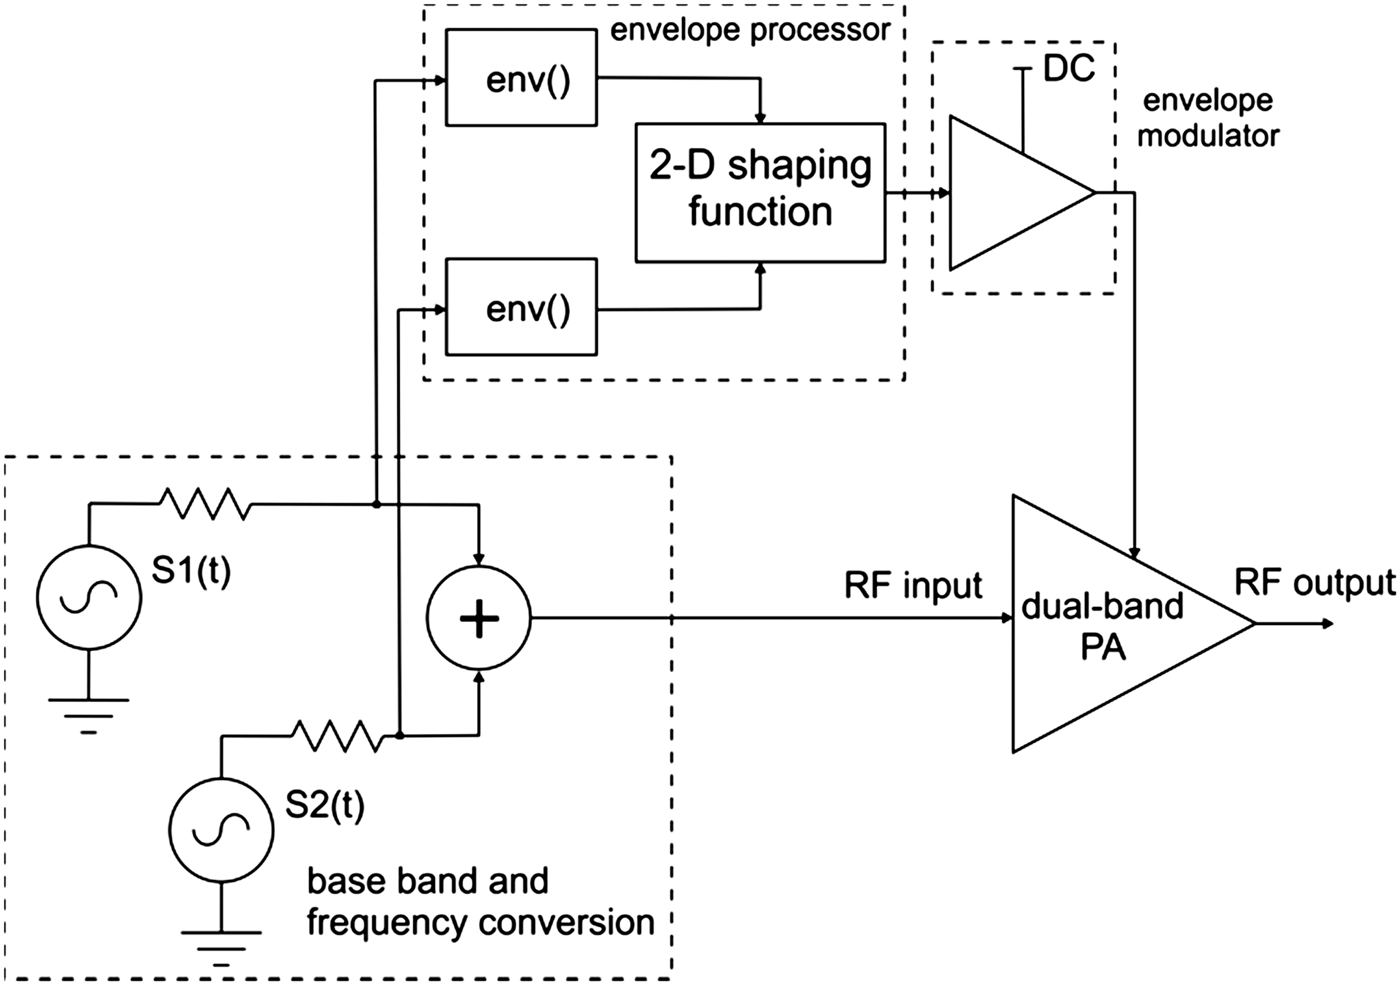
In this paper, we introduce a detailed analysis of the ET-PA prototype performance for both single band and concurrent dual-band. The analysis here included considers the different trade-offs between linearity and average energy efficiency as a result of the adoption of different shaping functions. The paper presents a detailed ET-PA system-level experimental characterization with multi-channel WCDMA excitations. Specifically, with reference to the architecture of the dual-band ET system schematically depicted in Fig. 1, in this paper, we extend the previous results by introducing a 2D shaping function. This 2D shaping function is numerically implemented within the baseband processor and it is driven by the two independent signal envelopes of S1(t) and S2(t), as it is depicted schematically in Fig. 1. Thus, the output of the 2D shaping function provides the driving signal to the envelope modulator. The technology and the implementation issues of the latter block is beyond the scope of the present paper.
Schematic diagram of the concurrent dual-band ET power amplifier. S1 and S2 are two digitally modulated signals at non-commensurate carrier frequencies.

The paper it is organized as follows. In Section II, we present the device characterization technique based on a calibrated pulsed harmonic load-pull set-up. The implementation of the dual-band GaN PA prototype for ET operations is reported in Section III, whereas its characterization is reported in Section IV. Section V discusses extensively the energy efficiency and the linearity trade-off by the envelope shaping control. The conclusions about the optimum ET driving are also reported in Section V in terms of system-level analysis by using WCDMA signals and a commercially available envelope modulator. Finally, in Section VI, we introduce the 2D shaping function and discuss extensively its exploitation in the characterization of the concurrent dual-band ET-PA prototype.
II. DEVICE CHARACTERIZATION
The experimental data that follow are related to the GaN-HEMT RF3934, a DC-4 GHz, and 130 W peak power device when biased in class AB mode at 48 V. The characterization was carried out at 870 and 2140 MHz.
A) Pulsed harmonic load-pull device characterization
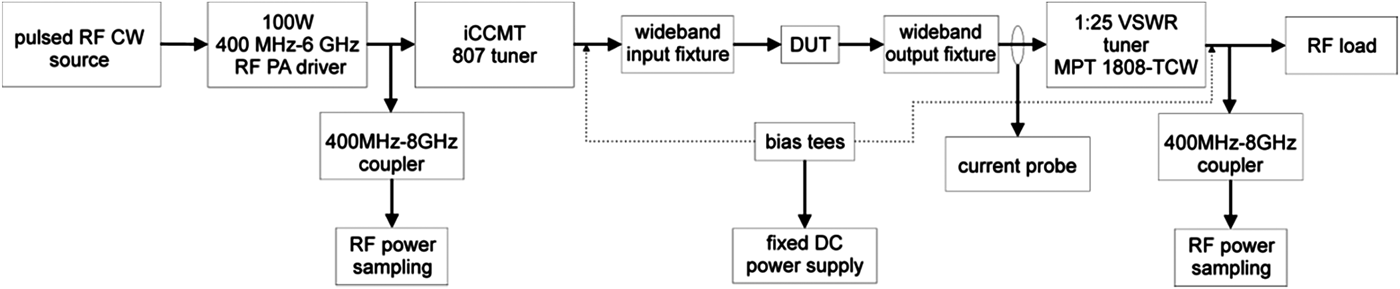
To enable a fully optimized design for the multi-band ET PA, an extensive pulsed continuous wave (CW) load-pull characterization at transistor level has been performed. The test bench block diagram is reported in Fig. 2. A preliminary Computer Aided Design (CAD) analysis drove the search and gave an initial estimation of the proper second and third harmonic terminations capable of optimizing efficiency performance during ET operations. We found experimentally that the harmonics manipulation is capable of increasing the DE significantly (up to 20%) when compared to that achieved by a class-AB with second and third harmonics terminated by a short circuit. The load-pull characterization was developed combining power and voltage sweeps for the ET-mode analysis. The additional feature of employing 500 ns pulsed RF with 5% duty cycle for power and voltage sweep analysis allowed us to explore with a realistic signal dynamic, the device dispersion effects due to device traps, thermal effects, and bias circuit induced memory effects, which would be completely neglected during a CW bias dependent load-pull characterization. The pulsed measurement helps the device to run cooler, thus the measurement results were proven to be more reliable and accurate.
Schematic diagram of the pulsed harmonic load-pull measurement setup adopted for device characterization.
In general terms, the results of the pulsed harmonic load-pull analysis enable the collection of output power, Pout, and drain efficiency (DE) as a function of load termination, at fundamental and drain voltage, Vdrain:
 $$P_{out} = P_{out} \left(P_{in}\comma \; Z_{load}\comma \; V_{drain} \right)$$
 $$DE = DE\left(P_{in}\comma \; Z_{load}\comma \; V_{drain} \right)$$
Both of the above maps are collected for any frequency of interest. As our goal is to define the optimum terminations, as a function of the excitation statistics, the power, pdf, are to be introduced. The pdf expresses the probability to observe a given instantaneous power level, for a given radio access technology. In the experimental data that follows, we focus on the WCDMA 3GPP down link pdf. Being the DE map defined symbolically by (2), and evaluated for the entire range of drain voltage and input power sweep, we can evaluate the corresponding mean DE map as a function of the load termination:
 $$DE\left(Z_{load} \right)= \vint_0^{P_{RF\max}} DE\left[Z_{load}\comma \; f_{ET} \left(P_{RF} \right)\right]pdf \left(P_{RF} \right)dP_{RF}$$
where f ET(P RF) is the shaping function that maps the drain voltage from the instantaneous RF amplitude. The function:
 $$V_{drain} = f_{ET} \left(P_{RF} \right)$$
is determined on the basis of a trade-off between maximum mean DE and gain flatness, and represents a key feature for optimization of the entire system performance; a detailed discussion of the mapping in equation (4) is given in Section V. The mean DE is calculated by:
 $$\left\langle DE \right\rangle = \displaystyle{\vint\limits_0^{P_{RF\max}} P_{RF} \cdot pdf \left(P_{RF} \right)dP_{RF} \over \vint\limits_0^{P_{RF\max}} P_{DC} \left[P_{RF}\comma \; f_{ET} \left(P_{RF} \right)\right]\cdot pdf\left(P_{RF} \right)\cdot dP_{RF}}$$
which is achieved at the optimum termination:
 $$\left\langle Z_{opt} \left(f_C \right)\right\rangle = \vint_0^{P_{RF\max}} Z_{opt} \left[f_{ET} \left(P_{RF} \right)\comma \; f_C \right]pdf\left(P_{RF} \right)dP_{RF}$$
where Z opt(V drain, f C) is the optimum termination for maximum DE for each drain bias voltage at carrier frequency f C. A detailed analysis of the ET-PA performance sensitivity versus the termination at fundamental is provided in [Reference Cidronali, Mercanti, Giovannelli, Maddio and Manes13]. The above equations are derived assuming that:
 $$\vint_0^{P_{RF\max}} pdf\left(P_{RF} \right)dP_{RF} = 1$$
B) Single-band device optimum performance
The objective of the dual-band design consists of achieving the single-band performance with a dual-band design suitable for digitally modulated signals. In the following experiments, we considered a 5-MHz WCDMA downlink signal with a reduced peak-to-average power ratio (PAPR) equal to 6.5 dB, and a 3-dB PA gain compression at peak power. In this phase of the characterization process, the ideal shaping function, f ET, maps the RF power to the V drain with the objective to maximize the DE, thus neglecting any other consideration about the linearity.
The load-pull characterization at fixed bias led to the data reported in Tables 1 and 2, respectively at 870 and 2140 MHz. The optimum load, Zopt, in the two tables reflects the value required to achieve the maximum DE at each bias voltage; the tables also report the corresponding peak output power.
CW pulsed load-pull characterization at different fixed biases at 870 MHz.

CW pulsed load-pull characterization at different fixed biases at 2140 MHz.
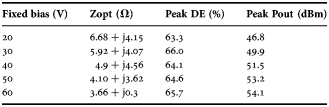
The optimum load values show a decreasing trend as the fixed voltage bias increases; whereas the peak DE varies only slightly as the result of its optimization, the peak output power increases as the bias increases. This trend of the real part is consistent with the general theory of efficiency enhancement for class-AB PA [Reference Cripps14]. When the data of Tables 2 and 3 are processed by the formulation of equation (3), the resulting mean DE isoclines are shown in Figs 3 and 4, respectively at the two design frequencies. From the plots it can be easily observed that on moving from fixed bias and CW to ET operation with PAPR = 6.5 dB, the calculation led to significantly different Zopt, which are summarized in Table 3. Specifically, at 60 V fixed bias, the Zopt are 5.74 + j4.86 Ω at 870 MHz and 3.66 + j0.34 Ω at 2140 MHz, whereas the Zopt referring to ET operation at 6.5 dB PAPR are 4.87 + j4.4 Ω at 870 MHz and 5.49 − j1.17 Ω at 2140 MHz.
Mean DE load-pull contour plots for optimum ET drain bias for a signal statistic with PAPR = 6.5 dB at 870 MHz.
Mean DE load-pull contour plots for optimum ET drain bias for a signal statistic with PAPR = 6.5 dB at 2140 MHz.
Mean DE calculated at device level and optimum terminations; data calculated with ideal ET shaping and PAPR = 6.5 dB.

At this point we can draw the conclusion that the signal dynamic acts twofold on the ET-PA performance. The first consists of a reduction of the mean DE with respect to the peak value. Secondly, it determines a shift of the Zopt, thus justifying the need to consider the actual signal pdf during the device characterization stage for optimum ET operation.
III. ENVELOPE TRACKING A DUAL-BAND PA PROTOTYPE
The technique described in [Reference Fagotti, Cidronali and Manes11] was applied to the design of a dual-band PA suitable for ET operation with a WCDMA 3GPP DL with frequency bands centered at 870 MHz and 2.14 GHz, respectively. The approach permits us to control the terminations at the two design fundamentals along with their second and third harmonics for a total of six frequencies. The characterization presented in the previous section was adopted to determine the target load terminations with PAPR = 6.5 dB, whereas the input impedances were found to be 1−j0.1 Ω and 2.5−j2.8 Ω at 870 and 2140 MHz, respectively. The resulting output matching network is composed of a pair of open circuited stubs cascaded with a four sections transformer implemented by microstrip technology; whereas the input matching network involves a two sections microstrip lines transformer. The prototype was implemented on the Taconic RF-60A laminate 0.64 mm thickness with copper cladding 2oz/sq. ft. An extensive set of large-signal and electromagnetic simulations helped in the final prototype design. The layout of the prototype is reported in Fig. 5, where the input and matching network's sections are labeled and whose dimensions are reported in Table 4; the part numbers of the passive components are also included. Finally, in the lower right corner of the picture, the dashed area includes an RC additional tuning network that is used to achieve a maximally flat video frequency response, along with the input connector. This latter section requires a careful design to ensure system stability and a low impedance termination to optimize the video bandwidth response.
Layout of the prototype implementation by microstrip technology, the picture reports the parts number of surface mount passives; dimensions are: 125 × 75 mm.
Dimension of the transmission lines adopted in the prototype design, implemented Taconic RF-60A substrate, thickness 0.64 mm, and copper cladding 2oz/sq ft.

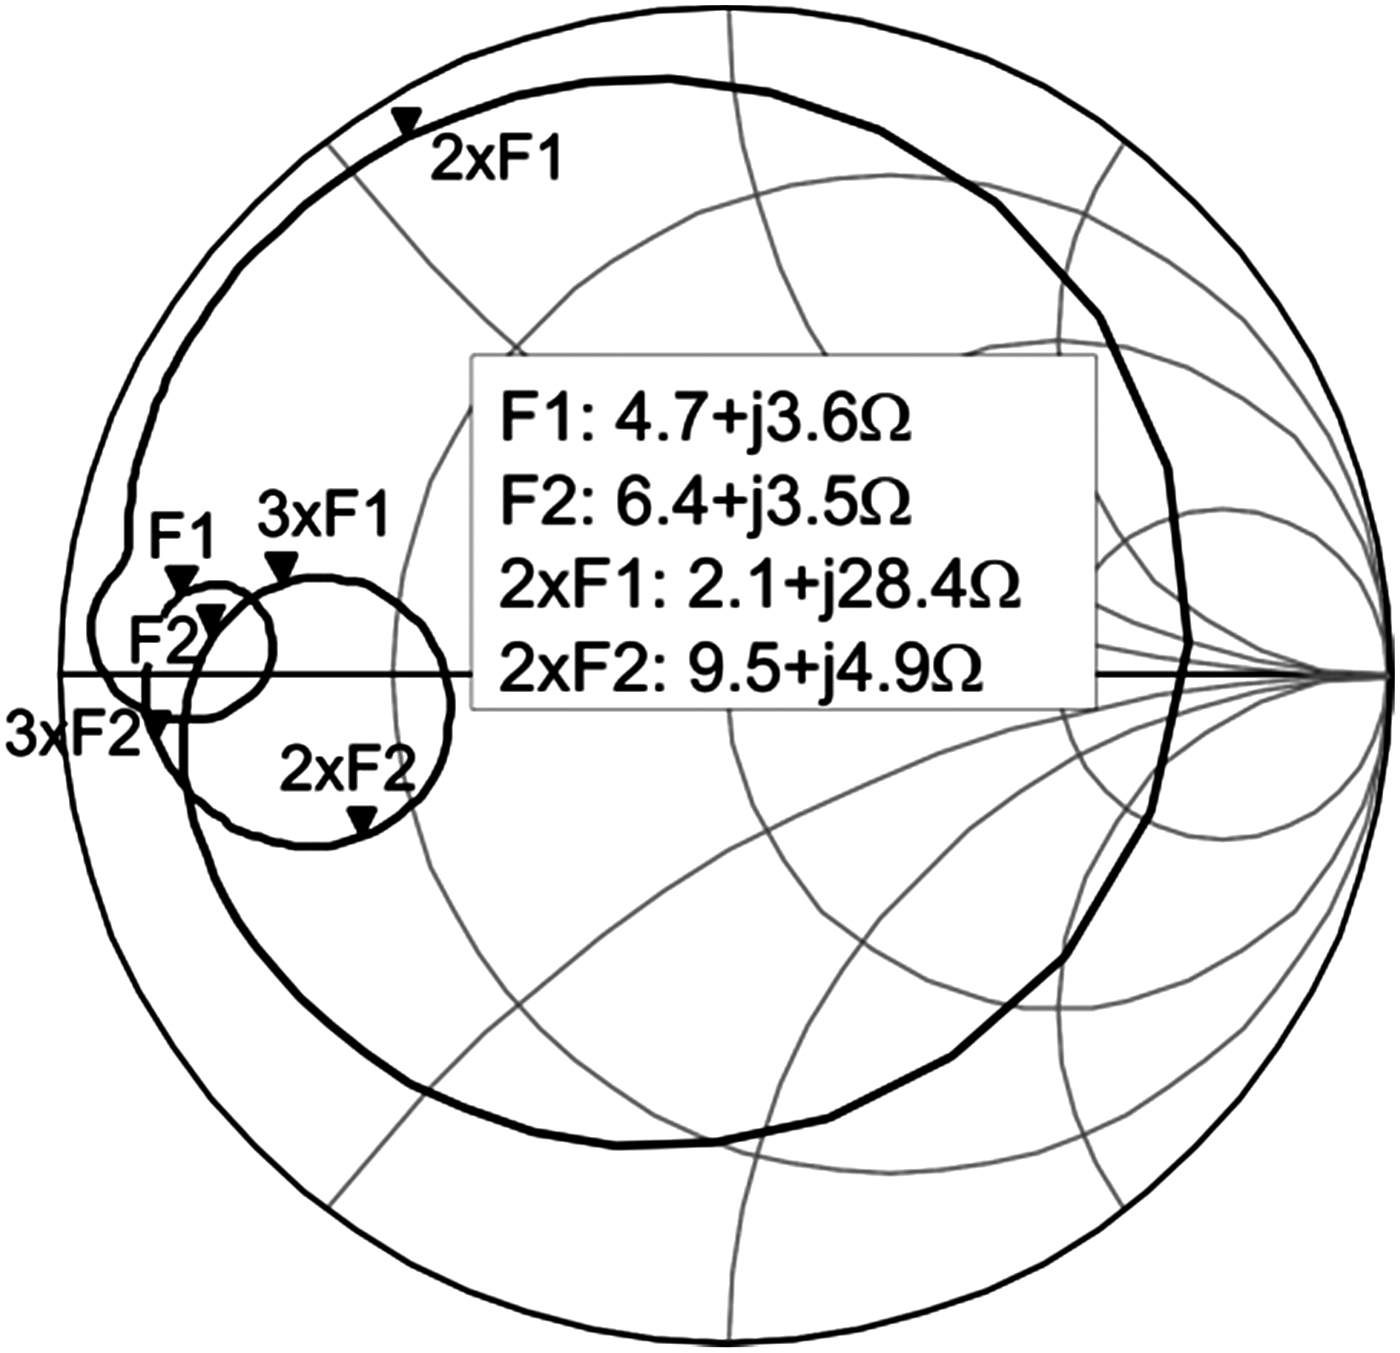
The assembled prototype is shown in Fig. 6, which reports the large inductor necessary to the switching stage of the envelope modulator (not shown in the figure), and the RC components required to optimize the bandwidth of the interface between the PA and the envelope modulator. Before the final assembly, the input impedance of the output matching network, which corresponds to the load termination seen at the section of the device drain flange toward the load, was measured at the two carrier frequencies of interest and their respective second harmonics. The data are reported in Fig. 7 and show the achieved degree of approximation with respect to the desired data values of Table 3. The prototype was initially characterized in a small signal regime, at 48 V and 480 mA bias point; the measured S21 versus frequency exhibited a value between 19 and 20 dB within 750 and 915 MHz, whereas for the higher band, the gain is between 10.8 and 11.8 dB within 2.075 and 2.175 GHz; the input and output measured reflection coefficients were better than −8 dB at the mentioned frequency bands.
Dual-band GaN ET PA prototype.
Resulted device output termination versus frequency, measured on the prototype before the final assembly. F1 = 870 MHz, F2 = 2140 MHz, 2 × F1 = 1740 MHz, 2 × F2 = 4280 MHz, 3 × F1 = 2610 MHz, and 2 × F2 = 6420 MHz.
IV. PULSED CW BIAS DEPENDENT EFFICIENCY AND POWER PROTOTYPE CHARACTERIZATION
A) Large signal single tone pulsed characterization
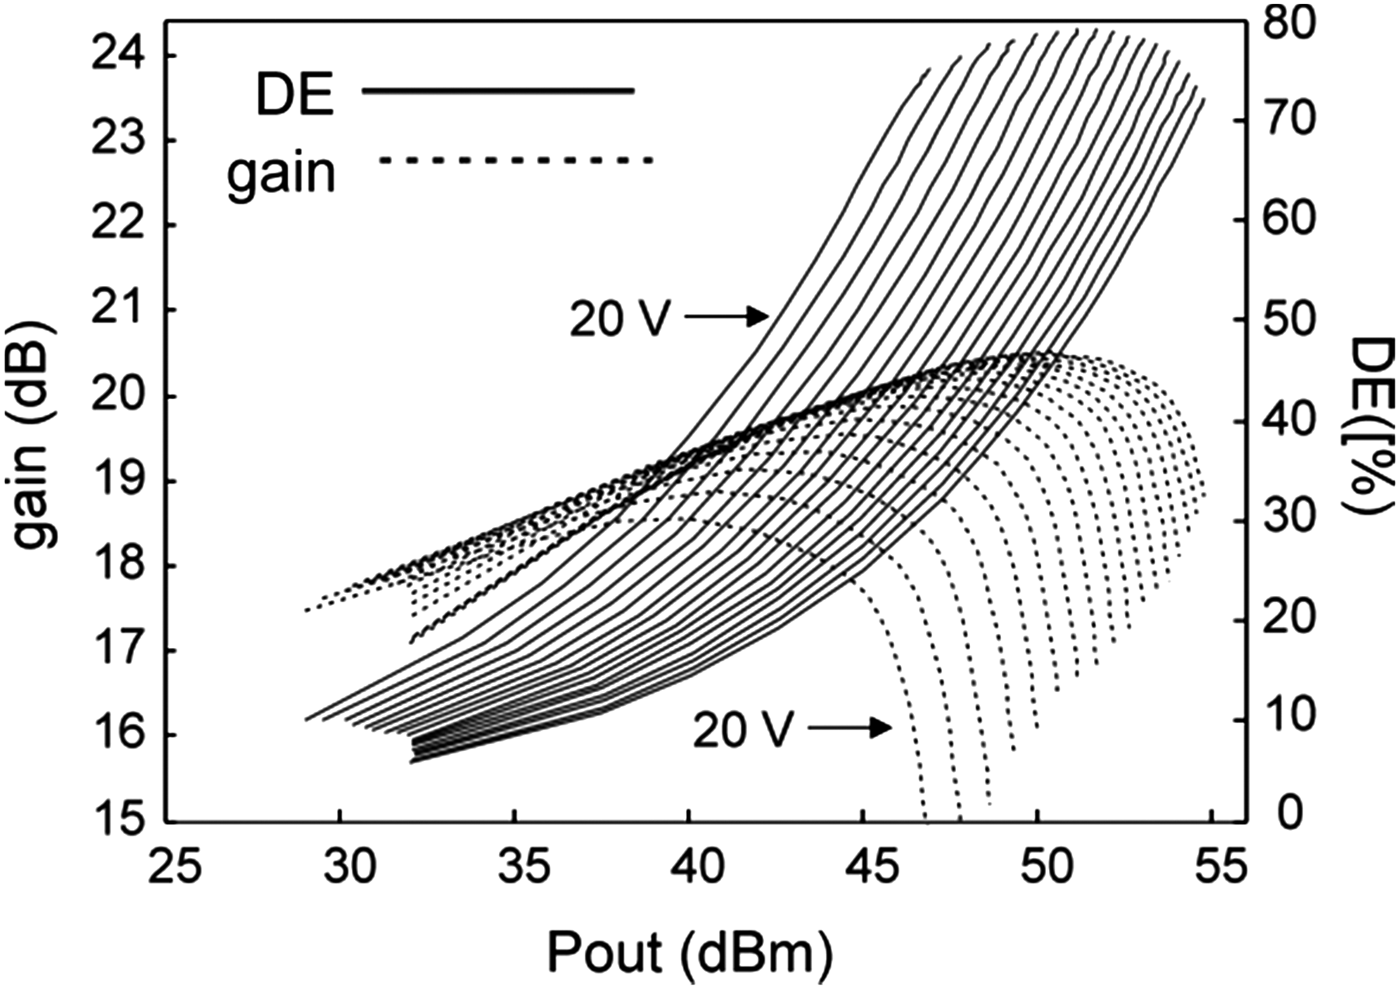
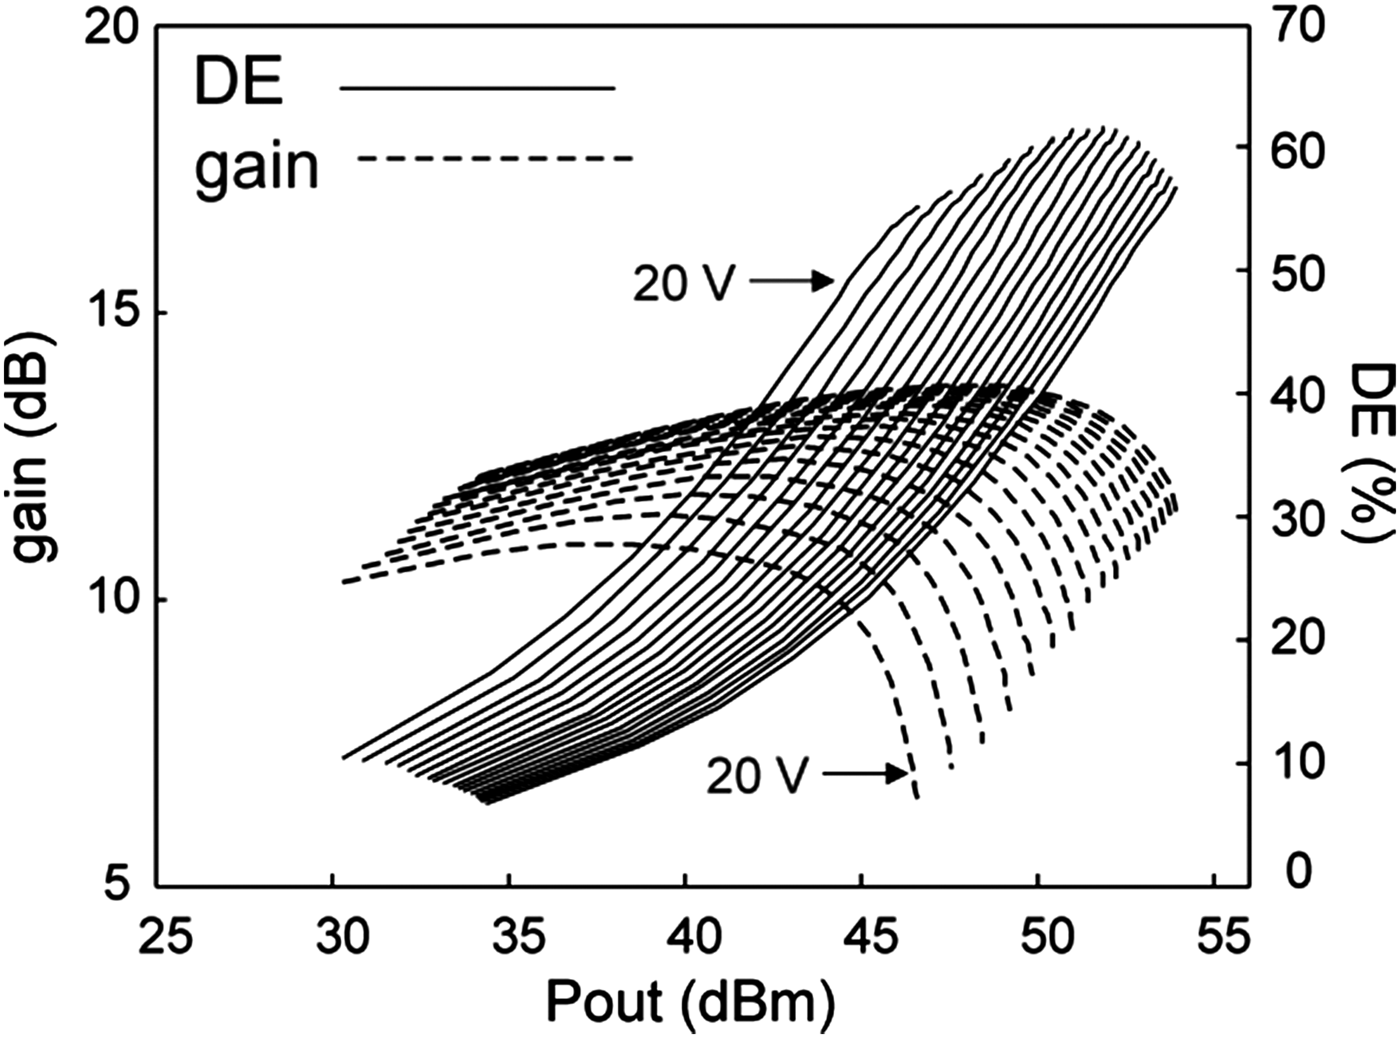
A CW pulsed large signal characterization at the two carrier frequencies was performed. This permitted us to test the prototype in a controlled environment, capable of resembling the envelope peaks occurring in a digitally modulated signal, and thus controlling the thermal and the electrical long-term memories of the DUT. This approach enabled a better insight of the prototype behavior. The results of this characterization are reported in Figs 8 and 9, respectively, for the lower and upper frequency bands. The plots show the comparison between gain and DE when the drain voltage spans in a large bias voltage range with gain compression up to 3-dB; while, for the lower frequency band, the measurements stop at the absolute maximum drain voltage of 65 V, for the higher band case, the maximum drain voltage was retained at 55 V, as beyond this level the DE drops significantly. The achieved peak power is in excess of 54.86 dBm with a peak DE of 78.5%, for the lower band, while a corresponding 53.96 dBm and 61.5% are achieved in the high band.
DE and gain data obtained by pulsed CW excitation of the dual-band ET-PA prototype, at 870 MHz, sweeping drain bias from 20 to 65 V.
DE and gain data obtained by .pulsed CW excitation of the dual-band ET-PA prototype, at 2140 MHZ sweeping drain bias from 20 to 55 V.
B) Broadband characterization
The prototype was also characterized by sweeping the carriers in a broad bandwidth around the design frequencies. The measurement results show a peak power with a ±0.5 dB ripple across 100 MHz bandwidth centered at 890 MHz, and a maximum peak power value of 55.1 dBm at 840 MHz. The peak power at the higher-frequency band reported a similar bandwidth extension, with a peak power in excess of 54.1 dBm at 2180 MHz. For the upper band, the peak power ripple is less than 0.5 dB across more than 100 MHz centered about 2180 MHz. The mean DE of the prototype was also evaluated across the two frequency bands by assuming an ideal shaping function, i.e. the one that maximizes the average efficiency for a signal with 7.5 dB PAPR. The results of this evaluation are shown in Figs 10 and 11 for the lower and higher frequency bands, respectively. When compared with the data in Table 3, we observe a reduction that can be attributed to the losses in the output matching network. The wide bandwidth observed is due to the involved multi-section matching network, which reduces the dispersion of the optimum matching conditions when compared to single section approaches.
Prototype mean DE across the lower bandwidth, calculated with PAPR = 7.5 dB.
Prototype average DE across the higher bandwidth, calculated with PAPR = 7.5 dB.
V. EFFICIENCY AND LINEARITY ENHANCEMENTS BY ENVELOPE SHAPING CONTROL
To achieve the best efficiency from the ET-PA, the shaping function has to be properly defined. In the literature, several approaches are suggested, some of them are aimed at reducing the bandwidth specifications of the modulator, like e.g. in [Reference Jeong, Kimball, Kwak, Chin, Draxler and Asbeck15, Reference Montoro, Gilabert, Vizarreta and Bertran16], while in other approaches the envelope modulator efficiency versus linearity trade-off is investigated, like in [Reference Hoversten and Popovic17]. In this section, we discuss the impact of the selection of the shaping function on the average efficiency and linearity performance of the ET-PA. Then we analyze the performance of the dual-band ET-PA prototype at the system level when driven by communication signal and operating with a commercial envelope modulator.
A) Envelope shaping functions
The prototype presented in Section III, was analyzed by the shaping functions discussed in [Reference Cidronali, Zucchelli, Maddio, Giovannelli and Manes12], in the context of a GaAs PA developed for significantly lower-power levels, and here applied to a GaN device and for significantly higher output power. The most effective shaping function, that is capable of maximizing the mean DE, without any other considerations on the ET-PA linearity, is defined by the “argument of the maximum” mathematical function:
 $$V_{bias} \left(P_{RF} \right)= \arg \max \left\{DE\left(P_{RF}\comma \; V_{bias} \right)\right\}$$
which returns the bias voltage that maximizes the peak DE for a given RF power level; it relies on a priori characterization of the PA stored in the memory of the baseband controller. For a specific RF level the envelope modulator provides the bias voltage that maximizes the DE, while a given level of gain compression (3 dB in the present case) is attained. Other shaping functions adopted here are, the raised-cosine shaping:
 $$V_{RC} \left(x \right)= V_{\min} \left(\displaystyle{\pi \over \pi - 2} \right)\left[1 - \left(\displaystyle{2 \over \pi} \right)\cos \left(V_e \left(x \right)\displaystyle{\left(\pi - 2 \right)\over 2V_{\min}} \right)\right]$$
and the so-called N = 6 shaping:
 $$V_{n6} \left(x \right)= \left[V_{\min}^6 + V_e^6 \left(x \right)\right]^{1/6}$$
where V min is the minimum level of the envelope voltage, whereas V e is the unshaped envelope voltage representing the baseband envelope magnitude.
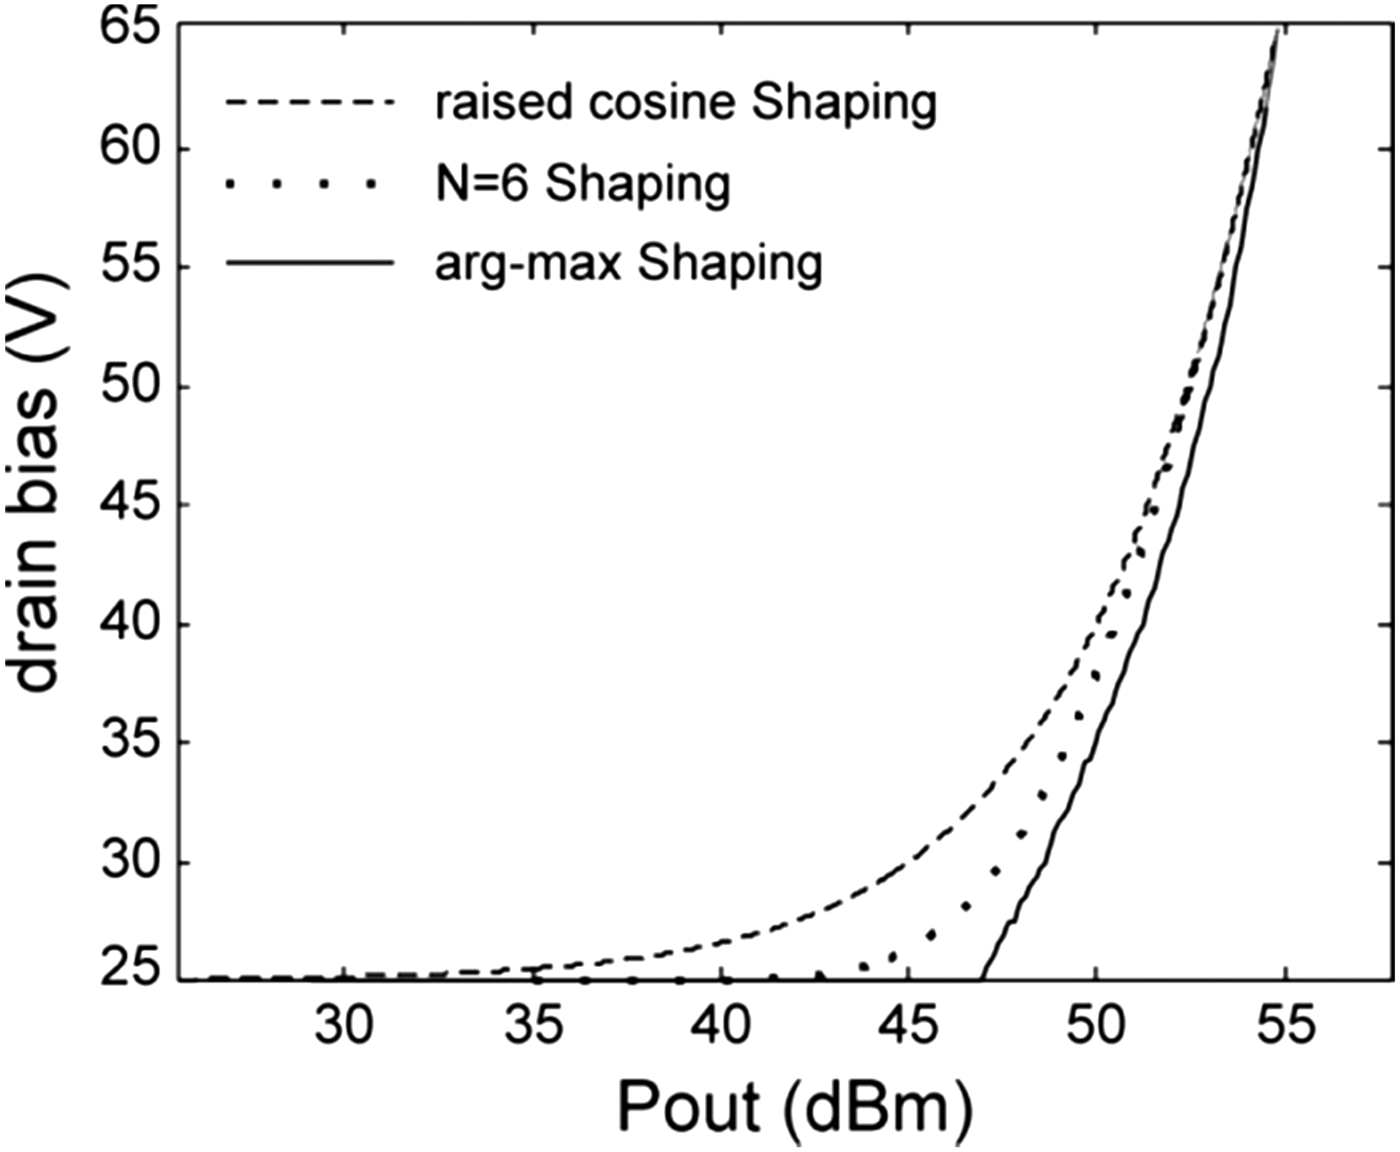
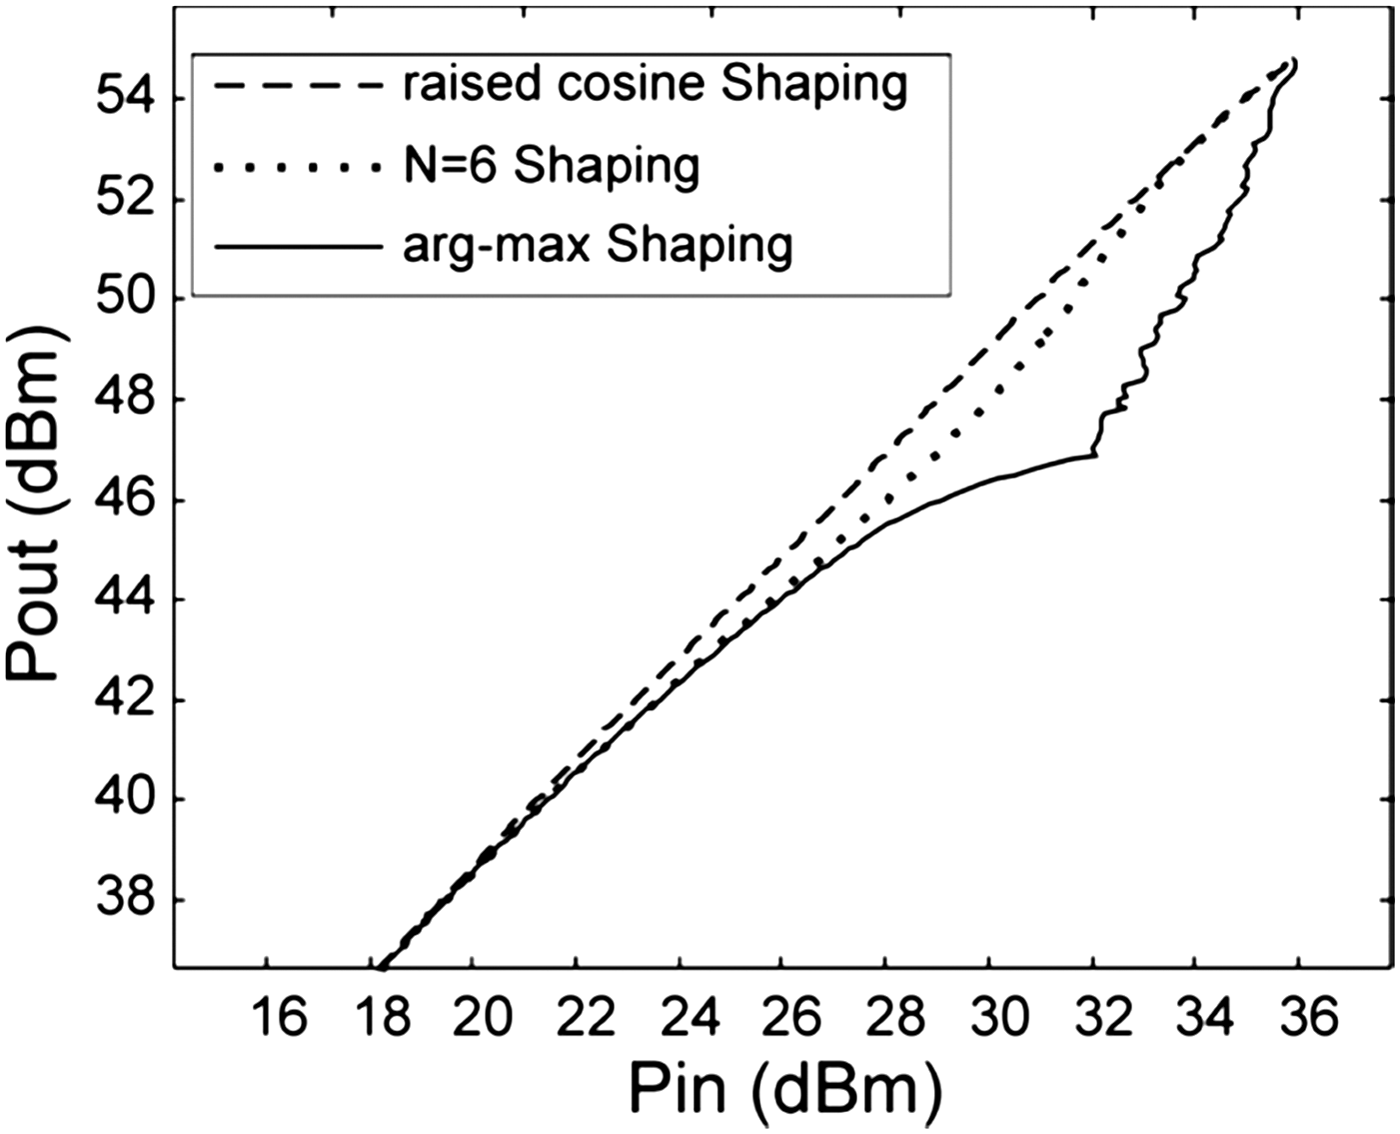
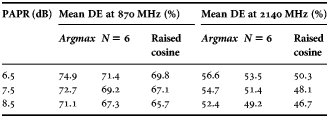
The application of the above described three shaping functions resulted in the DE versus output power behavior reported in Figs 12 and 13, respectively, for the lower and higher bands. These figures also show the pdf for a 5-MHz WCDMA downlink signal by which the mean DE was estimated. The DE shapes corresponding to the ET operation by different shaping functions are compared with the DE at different fixed bias values. The figure indicates that the N = 6 shaping function leads to a slightly higher value of DE, with respect to the raised cosine shaping function. A significant insight view on the trade-off between linearity and efficiency derives from observing the graphs reported in Figs 14 and 15, where are shown the graphs of the three shaping functions and their effects on the AM\AM response of the ET-PA prototype at 870 MHz. As expected, different shape functions provide different trade-offs between gain linearity and DE. In particular from Fig. 15, we can summarize the differences between several shaping functions. The ideal shaping, the argmax function, though maximizing the DE, results in a highly nonlinear gain, thus increasing significantly the required envelope bandwidth. The raised cosine shaping requires the narrowest bandwidth operation and while providing a flatter AM\AM response it also leads to the lowest DE performance at the low-power level. Finally, the N = 6 shaping exhibits a slightly non-monotonic AM\AM response, it requires a higher bandwidth than the raised cosine shaping, but provides DE values closer to maximum. Table 5 summarizes the comparison between the mean DE evaluated by different shaping functions. From the above discussion it is possible to draw the following general conclusions: the envelope shaping is a tool to adjust gain and efficiency performance across the power range; the higher the envelope bandwidth, [Reference Jeong, Kimball, Kwak, Chin, Draxler and Asbeck15, Reference Montoro, Gilabert, Vizarreta and Bertran16], the better it is possible to maximize efficiency; the AM\AM can be “flattened” across power dynamic range hence improving system linearity (provided no major AM/PM modulation is exhibited by the PA).
Measured DE and Gain for drain voltage spanning from 20 to 65 V (light lines), at 870 MHz, and locus for different shaping functions for a signal statistic with PAPR = 6.5 dB (dotted line).
Measured DE and Gain for drain voltage spanning from 20 to 55 V (light lines), at 2140 MHz, and locus for different shaping functions for a signal statistic with PAPR = 6.5 dB (dotted line).
Comparison between different shaping maps evaluated on the DE and gain data at 870 MHz.
Prototype input-output response at different shaping maps at 870 MHz.
Prototype mean DE, by means N = 6 and raised cosine shaping functions, for different PAR levels.
B) ET-PA prototype system level experimental results
The prototype was tested in a single-band multi-carrier ET evaluation platform composed by the Nujira coolteq.h NCT-4010 commercial modulator and a predictive digital pre-distortion (DPD) system developed as part of the same evaluation platform. The prototype complete characterization in a concurrent dual-band ET system evaluation platform has not been possible at present. The development of such a system evaluation platform, although its principle of operation was thoroughly investigated, does require major effort to be effectively implemented in practical hardware. In addition to this, a 2D dual-band DPD is still in a feasibility phase, [Reference Bassam, Helaoui and Ghannouchi18], consequently, the complete characterization of the developed prototype in concurrent ET dual-band mode will be addressed in a future work.
The first set of results consists of the comparison of the output spectra for a two channels WCDMA 5 MHz 3 GPP DL signal of about 870 MHz, when N = 6 and raised cosine shaping functions are adopted; in Fig. 16 are shown both the spectra which are acquired at the output of the prototype when a memory predictive DPD was involved in the platform. The results show a total output power of 48.5 dBm for both the cases; the N = 6 shaping case exhibited a mean DE of 68.5% and an adjacent channel power measured at 5 MHz offset of −51.16 dBc, while for the case of the raised cosine shaping the values are: 64.5% and −55.82 dBc, respectively. When two 5 MHz WCDMA channels were applied at 2.14 GHz, the measured output spectra with and without memory DPD reported average power of 47.4 dBm and mean DE of 45.4% (46.8 dBm and 48.5% were observed at 2.17 GHz). In this case, the adjacent channel power measured at 5 MHz offset was −57.26 dBc with the predictive correction algorithm turned on. Finally, in Fig. 17 is reported the output spectra when four channels of 5 MHz WCDMA signal, again with and without memory DPD, were applied to the ET-PA about 2.14 GHz. The observed total power level was 47.2 dBm with a mean DE of 43.1%. In this case with DPD, the adjacent channel power measured at 5 MHz offset was −46.6 dBc.
Comparison between output spectra for 2 3GPP DL WCDMA signals PAR = 7.5 dB with N = 6, and raised cosine, both cases with memory DPD.
Comparison between output spectra for 4 3GPP DL WCDMA signals at the center frequency of 2.14 GHz, when N = 6 are adopted, with and without DPD.
VI. CHARACTERIZATION OF THE CONCURRENT DUAL-BAND ET-PA OPERATION
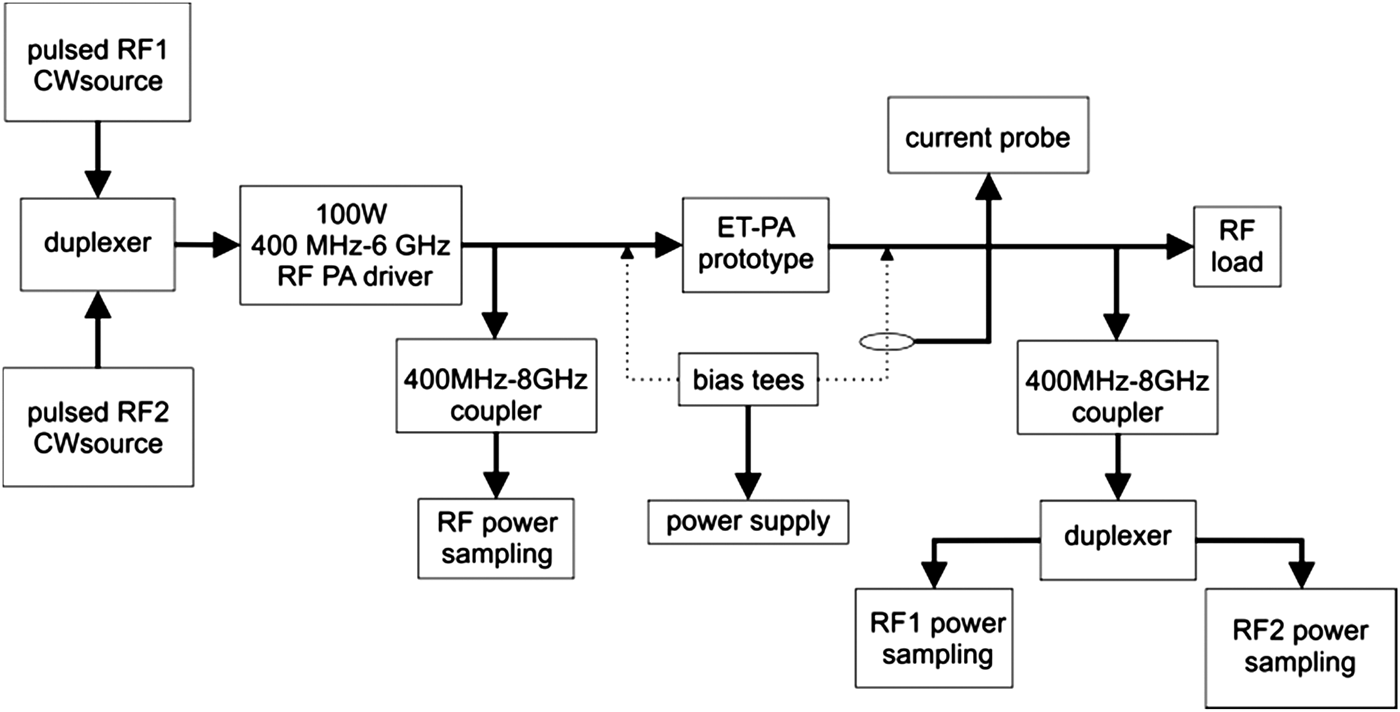
This section presents the extension of the envelope shaping functions described here in the case of a 2D envelope, and discusses the prototype performance when operating in a concurrent dual-band ET mode. The concurrent dual-band PA characterization was achieved by using the measurement setup described previously, properly modified to include the combination of two independent CW signals at the PA input, whereas the PA prototype load was kept fixed at 50 Ω; the schematic representation of the measurement setup is reported in Fig. 18. The ET-PA evaluation that follows is obtained by considering the 2D signal power distribution calculated as the multiplication of two equal WCDMA signal distributions with PAPR = 6.5 dB. The resulting bi-variate pdf it is shown in the contour plot of Fig. 19. The difference between the expected power values at F1 (870 MHz) and F2 (2140 MHz) are those that determine a proper PA compression level.
Schematic representation of the measurement set up for the concurrent dual-band ET-PA prototype with two pulsed signals at F1 = 870 MHz and F2 = 2140 MHz.
The two-dimensional pdf associated to the WCDMA signals at F1 = 870 MHz and F2 = 2140 MHz adopted for the concurrent dual-band ET-PA characterization.
The first step of the analysis considers the bi-dimensional argmax (2D-argmax) shaping function, which returns the bias voltage maximizing the PA DE for any possible input level pair P RF1 and P RF2, that is:
 $$V_{drain} \left(P_{RF_1}\comma \; P_{RF_2} \right)= \arg \max \left\{DE\left(P_{RF_1}\comma \; P_{RF_2}\comma \; V_{drain} \right)\right\}$$
where the DE is calculated as follows:
 $$DE = \displaystyle{P_{out}^{RF_1} + P_{out}^{RF_2} \over P_{DC}}.$$
Having extracted the bias voltage by means of (11), the DE is hence uniquely determined and the contour plot of Fig. 20 reports such values for any input level pair. Fig. 20 shows a broad region over which the DE is maintained higher than 60%, with a peak DE of 75% achieved at {30, 28}dBm input power respectively for the 870 and 2140 MHz signals.
DE for the 2D-argmax shaping function.
The corresponding total output power, calculated as the coherent summation of the levels at the two carriers, is shown in Fig. 21, where a value of 47.8 dBm is achieved in correspondence to the {30,28} dBm input power pair. Figs 22 and 23 report an interesting insight about the combined effect of the cross modulation between the two carriers and the bias modulation. In particular, at constant input power lower than 30 dBm at 870 MHz, a significant gain compression due to the increase of the carrier at 2140 MHz is observed. This behavior appears as a bending in the isogain contour, which is much less evident at the higher band. A further effect of the cross modulation in the ET operation can be observed in Fig. 24, which reports the comparison between the output signal distributions associated to the two WCDMA signals at the output of the ET-PA. It is possible to observe the effect of the distortion which makes sharper the shape of the pdf at F2, while at F1 we observe a spread of the pdf; this effect is due to the distortion introduced by the 2D-argmax shaping function in the process to maximize the DE. By Fig. 24 the expected value for the ET-PA output power at 2140 MHz is 45 and 42 dBm at 870 MHz. The mean DE was estimated by using the following equation:
 $$\left\langle {DE} \right\rangle=\vint\!\!\!\vint_{\scriptstyle P_{RF_1} \hfill \atop \scriptstyle P_{RF_2} \hfill} {\displaystyle{{pdf\left({P_{RF_1} } \right)\cdot P_{out}^{RF_1}+pdf\left({P_{RF_2} } \right)\cdot P_{out}^{RF_2} } \over {P_{DC} \left({V_{drain} \left({P_{RF_1}\comma \; P_{RF_2} } \right)\comma \; P_{RF_1}\comma \; P_{RF_2} } \right)}}dP_{RF_1} dP_{RF_2} }$$
where using the 2D-argmax shaping the mean DE was estimated at 60.4%, whereas the mean total power was 47.0 dBm. The second shaping function adopted to evaluate the prototype performance, was derived from the results of the previous section. Indeed, the N = 6 shaping function has proven a good compromise between efficiency and linearity, thus its extension to the 2D case is justified. Thus, the two-dimensional N = 6 (2Dn6) shaping function reads:
 $$V_{2Dn6} \left(x \right)=\left[V_{\min }^6+V_{e1}^6 \left(x \right) + V_{e2}^6 \left(x \right)\right]^{1/6}$$
where V e1 and V e2 are the unshaped envelope voltages representing the baseband envelope magnitude of the two signals at the ET-PA input. Applying the above shaping to the same dataset considered above, leads to the resulting DE contour plot shown in Fig. 25. As we can see from the figure, the values of the DE are now slightly lower than those reported in Fig. 20, getting a DE maximum of 70% and resulting in a mean DE value of 57.1%. For this case, we report the power levels associated to the two signals at the ET-PA output, respectively, for the lower band signal, Fig. 26, and the higher band signal, Fig. 27. From the latter figure, the effect of the combined cross modulation between the two carriers and bias modulation, which reflects into bended isoclines, is seen. The corresponding total output power, evaluated as summation of the power at the two frequencies is reported in Fig. 28. By weighting the total output power with the distribution probability of Fig. 19 and then integrating across the entire 2D power level domain, we obtained a mean value of 49.5 dBm.
Total output power for the 2D-argmax shaping function.
Output power at the carrier frequency F1 = 870 MHz as function of P1 and P2, for the 2D-argmax shaping function.
Output power at the carrier frequency F2 = 2140 MHz as function of P1 and P2, for the 2D-argmax shaping function.
Signal distribution at the output of the ET-PA prototype, for the 2D-argmax shaping function.
DE as function of P1 and P2, for the 2Dn6 shaping function.
Output power at the carrier frequency F1 = 870 MHz as function of P1 and P2, for the 2Dn6 shaping function.
Output power at the carrier frequency F2 = 2140 MHz as function of P1 and P2, for the 2Dn6 shaping function.
Total output power as function of P1 and P2, for the 2Dn6 shaping function.
The shape of the isoclines shown in Fig. 28, when compared to those reported in Fig. 21, suggest that the 2Dn6 shaping leads to a more linear behavior of the ET-PA. The better linearity of the ET-PA can be quantitatively evaluated by observing the distribution of the output power, which in the ideal linear case has to be the same as at the input. The comparison between the output signal distributions at the two frequencies is reported in Fig. 29, from which some conclusions can be drawn. The first is about the shape of the distributions that at the lower frequency is significantly similar to the input distribution shape. Secondly, the mean output power is higher than the previous case, as in this case the ET-PA can deliver 49.5 dBm output power; hence 2.5 dB higher than in the previous case. These features are achieved at the expense of a marginal reduction of the mean DE, which in the case of the 2Dargmax is 3.3% higher. Finally, we can confirm the effectiveness of the 2Dn6 shaping as a reasonable trade-off between efficiency and linearity for the concurrent dual-band operation mode. Tables 6 and 7 show a summary of the data discussed in this section, in which for a better comparison the data at fixed biased are also reported, this latter calculated by equation (13) with 60 V drain bias. It also reports the corresponding PAPR calculated on the output signal data at each frequency for both the cases.
Input signal distribution at the output of the ET-PA prototype, for the 2Dn6 shaping function.
Summary of the output power at each carrier in concurrent dual-band ET operation.

Summary of the mean DE and mean total Pout for the concurrent dual-band ET-PA.

As a final remark we can assess that the 2Dn6 shaping function does not increase the required envelope modulator bandwidth when compared with the single-band case. This is explained by the quasi-linear behavior of both equations (10) and (14), provided that the Vmin is sufficiently small when compared with the envelope magnitude Ve. Thus, the envelope modulator bandwidth requirement is mainly determined by the calculation of the magnitude of the baseband complex signal components, and the concurrent dual-band operation does not increase further its bandwidth requirement.
VII. CONCLUSION
This work has demonstrated the feasibility of a dual-band ET-PA designed with an accurate pdf conscious approach, which takes into account the 3GPP WCDMA downlink signal for the ET-PA optimization. A prototype working at 870 and 2140 MHz was developed with the RFMD RF3934 GaN HEMT and designed with a multi-section transformer based matching technique. The prototype provided a peak power in excess of 240 W in both bands with a mean DE higher than 69 and 54% across more than 80 MHz of bandwidth around the two design frequencies. The prototype exhibited an RF bandwidth in excess of 100 MHz with a DE degradation of less that 5% and peak power ripple of less than ±0.5 dB. The ET-PA prototype was also included in a real system, which was composed of a commercial modulator and a predictive DPD engine; several multi-channels WCDMA 3GPP DL signals were adopted for the system-level characterization. The measured mean DE was found in good agreement with the estimated levels. The adjacent channel power ratio was better than −51 dBc for the two channels cases at 870 MHz and better than −46 dBc in the case of a four channels WCDMA signal at 2140 MHz
The paper has also analyzed the effect of ET shaping on the linearity and the efficiency for the ET-PA prototype, in both single and concurrent dual-band modes, concluding that a proper shaping function enables us to maintain values of mean DE close to ideal operation with very good linearity. Specifically, we found that in the concurrent dual-band mode with two WCDMA signals at 6.5 dB PAPR each, the ET-PA exhibited a mean total power of 49.5 dBm with 57.1% mean DE.
The experimental system-level test in ET concurrent dual-band mode was not feasible at present due to the substantial lack of an established approach for a dual-band 2D linearization technique. In addition, the processing of the 2D shaping function requires additional work and investigation for its effective implementation in the digital part of the system that will be considered in a future work.
ACKNOWLEDGEMENT
The authors would like to acknowledge RF Micro Device for providing the GaN HEMTs necessary to this work, and Nujira Ltd. for providing the commercial ET modulator and support for the ET-PA prototype system test.
 Alessandro Cidronali is an Associate Professor of Electronics at the Department of Information Engineering, University of Florence, where he teaches courses on electron devices and integrated microwave circuits. From 1999 to 2003, he was a Visiting Researcher with the Motorola Physics Science Research Laboratory. From 2002 to 2005, he was a Guest Researcher with the Non-Linear Device Characterization Group, at the National Institute of Standards and Technology (NIST). Under the frame of the IST-EU FP6 Network TARGET (IST-1-507893-NOE), he served as workpackage leader for the transmitters modeling/architectures for wireless broadband access work packages. His research activities cover the study of analysis and synthesis methods for nonlinear microwave circuits, the design of broadband monolithic microwave integrated circuits (MMICs) and the development of modeling for microwave devices and circuits. Prof. Cidronali was the recipient of the Best Paper Award presented at the 61st ARFTG Conference. From 2004 to 2006, he was an associate editor for the IEEE Transactions on Microwave Theory and Techniques. Prof. Cidronali is a member of the IEEE MMT-S TC-20 Wireless Technologies MTT Technical Committee.
 Niccolò Giovannelli received his Laurea degree and Ph.D. degree from the University of Florence, Italy, in 2007 and 2011, respectively, with dissertations on power amplifiers for radio communications. From 2008 to 2011, Dr. Giovannelli has worked for Nujira Ltd., Cambridge UK, developing envelope tracking RF power amplifiers for cellular wireless infrastructure, broadcast and military applications. He is currently working as Application Engineer-RF power semiconductors division with Infineon Technologies, Munich, Germany. He is also collaborating in research activities within the department of Electronics and Telecommunications with the University of Florence, in the field of cellular handset and base station applications.
 Massimiliano Mercanti received the Laurea degree in electronics engineering from the University of Catania, Catania, Italy. In 2011, he got the Ph.D. degree from the University of Florence, Florence, Italy. In 2010, he joined Nujira Ltd., Cambridge UK, for an RF Engineering internship where he is currently working as RF Engineer for developing RF power amplifiers for handset and broadcast applications. Dr. Mercanti collaborates with the department of Electronics and Telecommunications of the University of Florence and is carrying out research topics concerning concurrent dual-band PAs and power control techniques for highly efficient PAs.
 Stefano Maddio was born in Florence, Italy on September 3rd, 1978. He graduated in Electronic Engineering at the University of Florence in 2005. He received his Ph.D. with a thesis entitled “Circularly Polarized Smart Antennas for Wireless Sensor Network Devices” in 2009 and then he joined the staff of the Microelectronic laboratory (Department of Electronics and Telecommunications) at the University of Florence. His research activities cover the analysis and design of radiative system for microelectronics, especially in the field of smart antenna technology for wireless applications, with particular emphasis on the issues of wireless localization. His scientific interests also cover the area of numerical techniques for electromagnetic propagation.
 Gianfranco Manes is currently a Full Professor with the Electronics and Telecommunication Department, University of Florence, Florence, Italy. He is active in the field of microwave engineering and wireless technology, including wireless sensor networks. He is the founder and Head of the MIDRA Consortium, a joint venture between the University of Florence Autostrade Tech SpA and Motorola SpA and the Head of the Research Centre for ICT for Environment Quality and Safety, taking scientific responsibility for leading both national and international research projects. He has authored or coauthored over 150 papers published in books, society journals, and referenced international conferences. Prof. Manes was a Technical Program Committee (TPC) member and session chairman since 2002 to 2005 for the IEEE Microwave Theory and Techniques Society (IEEE MTT-S) International Microwave Symposium (IMS).