I. INTRODUCTION
The ever increasing demand for electronic devices for various applications has also given rise to the demand for reliable energy storage devices. Currently, rechargeable lithium-ion batteries are the leading energy storage technology for many portable electronic devices such as laptops and mobile phones as they offer high energy density and relatively long cycle-life.Reference Tarascon and Armand1 However, lithium-ion batteries do not meet the demands of all current and emerging applications.Reference Goodenough and Kim2 A number of challenges remain and future energy storage systems require better safety characteristics, higher power and capacity, and should feature faster recharging times. Another significant challenge for lithium-ion technology is the rarity of lithium and the materials associated with the cathode (e.g., Co) that brings about the relatively high cost of these batteries.Reference Palomares, Serras, Villaluenga, Hueso, Carretero-Gonzalez and Rojo3 For example, the estimated global lithium reserves are 15 Mt, which is considered to be insufficient to fulfill future demand for lithium batteries, especially if electric vehicles become more widely adopted.Reference Vikstrom, Davidsson and Hook4 This economical flaw of lithium-ion batteries drives the research for an alternative system.
Sodium-ion batteries are considered as a possible low-cost alternative for lithium-ion batteries. This is because sodium is easier to access and is more abundant than lithium, resulting in lower input costs.Reference Palomares, Serras, Villaluenga, Hueso, Carretero-Gonzalez and Rojo3 Importantly sodium is expected to feature similar intercalation or conversion chemistry to lithium, which allows for parallel implementation of the materials/techniques developed for lithium-ion battery technology into sodium-ion batteries. Nonetheless, sodium-ion batteries have their own challenges. Sodium typically features a lower energy density compared to lithium due to the increase in both standard reduction potential and size.Reference Palomares, Serras, Villaluenga, Hueso, Carretero-Gonzalez and Rojo3,Reference Hong, Kim, Park, Choi, Choi and Lee5 Energy density is calculated in energy stored per unit volume or mass and the increasing size and mass of sodium typically decrease energy density compared to lithium. Sodium-ion battery technology is likely to be initially applicable for stationary energy storage where mass is a less critical issue compared to reliability. The development of sodium-ion battery technology requires an anode material capable of reversible sodium insertion/extraction in large quantities. Carbon-based materials, such as graphite, commonly used in lithium-ion batteries, show poor performance in sodium-ion cells,Reference Palomares, Serras, Villaluenga, Hueso, Carretero-Gonzalez and Rojo3,Reference Wenzel, Hara, Janek and Adelhelm6 as sodium does not significantly intercalate into graphite. Therefore, other anode materials must be investigated to give satisfactory results to complement the cathodes under development. Anodes currently under investigation include TiO2, Na2Ti3O7,Reference Senguttuvan, Rousse, Seznec, Tarascon and Palacín7 NaTi2(PO4)3,Reference Park, Gocheva, Okada and Yamaki8 and some semimetals.Reference Mortazavi, Deng, Shenoy and Medhekar9,Reference Datta, Epur, Saha, Kadakia, Park and Kumta10
To investigate the electrode evolution in batteries, in situ studies are becoming more widely used, with in situ neutron powder diffraction (NPD) providing detail on the lithium distribution and evolution in lithium-ion batteries,Reference Pang, Peterson, Sharma, Shiu and Wu11–Reference Sharma, Yu, Zhu, Wu and Peterson13 and in situ synchrotron x-ray diffraction (XRD) detailing sodium distribution and evolution in sodium-ion batteriesReference Serras, Palomares, Rojo, Brand and Sharma14,Reference Sharma, Serras, Palomares, Brand, Alonso, Kubiak, Fdez-Gubieda and Rojo15 during discharge/charge. In particular, in situ XRD studies have been used by researchers to study the evolution of materials comprising lithium-ion batteries, such as graphite and LiCoO2,Reference Reimers and Dahn16,Reference Dahn17 and early studies investigated sodium-ion battery materials such as Na0.67[Ni1/3Mn2/3]O2.Reference Lu and Dahn18 Brant et al.Reference Brant, Schmid, Du, Gu and Sharma19 describe the evolution of in situ XRD based studies, discussing the various cell designs available and comparing the data that can be obtained from laboratory and synchrotron XRD instruments. Here we describe some considerations of conducting such in situ XRD-based experiments on sodium-ion cells, noting that only a few reports in the literature exist where sodium-ion batteries have been investigated in operando.Reference Serras, Palomares, Rojo, Brand and Sharma14,Reference Sharma, Serras, Palomares, Brand, Alonso, Kubiak, Fdez-Gubieda and Rojo15,Reference Lu and Dahn18,Reference Guignard, Didier, Darriet, Bordet, Elkaim and Delmas20–Reference Ellis, Hatchard and Obrovac27 Furthermore, some of this work use very slow charge/discharge rates and therefore are very close to equilibrium conditions, whereas a cell often cycles in applications at higher rates in nonequilibrium conditions.
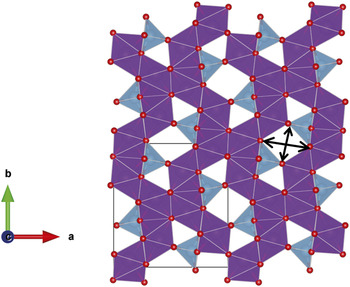
The use of in situ synchrotron XRD is demonstrated using an unconventional anode material Gd2TiO5. Gd2TiO5 can be applied in nuclear reactors as a neutron absorbing material, as it has good initial neutron absorption capability and irradiation resistance.Reference Kim, Joung, Lee, Kim and Sohn28 It can act as a safety margin, which controls excessive reactivity. Unfortunately, Gd is an excellent neutron absorber which makes it unfavorable for NPD experiments. Thus, using Gd2TiO5 as an electrode in a sodium-ion cell in conjunction with in situ synchrotron XRD can illustrate the evolution of sodium during discharge/charge. Gd2TiO5 features the Ti4+/Ti3+ redox couple, similar to the commercialized lithium-ion battery anode (Li4Ti5O12).Reference Sun, Zhao, Pan, Lu, Gu, Hu, Li, Armand, Ikuhara, Chen and Huang29 This Ti4+/Ti3+ redox couple produces a stable voltage of ∼1.55 V versus Li, which makes the formation of metallic lithium dendrites (and lithium deposition on the anode) more unfavorable thus increasing the safety of the lithium-ion battery.Reference Pang, Peterson, Sharma, Shiu and Wu11,Reference Pang, Sharma, Peterson, Shiu and Wu12,Reference Du, Sharma, Kimpton, Jia, Peterson and Guo30–Reference Sudant, Baudrin, Larcher and Tarascon32 Thus, the Li4Ti5O12 anode produces longer life and safer lithium-ion batteries. Taking the advantage of the similar Ti4+/Ti3+ redox couple, Gd2TiO5 features a structure with relatively large channels running along the c axis which may be feasible for Li or Na ion insertion/extraction, or a potential anode. Although lanthanides are intrinsically heavier than first row transition metals, limiting their electrode applicability in batteries for portable applications, there is very little fundamental and applied research on the use of lanthanide-containing compounds in the context of lithium- and sodium-ion battery electrodes. Most of their use is in solid state electrolytes based on the fast lithium ion conducting perovskites, e.g., Li3xLa(2/3)−x□(1/3)−2xTiO3 (0 < x < 0.16 and □ is a vacancy).Reference Stramare, Thangadurai and Weppner33 Thus there is an opportunity to explore the lanthanide series with conventionally occurring oxides and an appropriate redox couple. Gadolinium is initially selected as it is located in the middle of the lanthanide series and is a good starting point to investigate the influence of lanthanide elements in electrode electrochemical processes. Gd2TiO5 features an interstitial-rich channel-containing structure (Fig. 1) that maybe suitable for Li+ or Na+ insertion/extraction during discharge/charge. Typical modes of ion transport in electrodes tend to be site-vacancies or intercalation, whereas this material may provide the opportunity for ion transport via mobile interstitials. The crystal structure adopts orthorhombic Pnam symmetry with lattice parameters a = 10.476(2) Å, b = 11.319(2) Å, and c = 3.756(6) Å.Reference Aughterson, Lumpkin, de los Reyes, Sharma, Ling, Gault, Smith, Avdeev and Cairney34,Reference Hayun and Navrotsky35 The 2 Gd sites are 7-fold coordinate and the Ti site is 5-fold coordinate and two sets of channels are found along the c axis direction, a small channel that appears as a triangle in Fig. 1, and a larger channel that appears as a rhombus. The rhombus-type channel has dimensions 4.945(14) × 4.161(14) Å (Ref. Reference Hayun and Navrotsky35) corresponding to the arrows in Fig. 1, approximately in the a and b axis directions respectively. The smaller channel adjacent to the rhombus-type channel has a minimum O–O distance of 2.713(17) Å and O–Ti distance of 4.03(4) specifying the smallest dimensions in this channel. Both of these channels can accommodate Li+ and Na+ during insertion, and both channels are adjacent to the TiO4 tetrahedra where the change in oxidation state (Ti3+/4+) is likely to occur. These factors make Gd2TiO5 an interesting material to investigate as a possible alternative anode for lithium- and sodium-ion batteries, even though the mass may be prohibitive for portable applications. Here, we report the use of Gd2TiO5 as an anode material for lithium- and sodium-ion batteries, including the in situ electrochemical properties and structural evolution of Gd2TiO5 as it is used as an anode material in sodium-ion batteries.
Crystal structure of Gd2TiO5 illustrating the tunnels or channels along the c axis direction. The unit cell is taken from Ref. Reference Hayun and Navrotsky35. Seven-coordinate Gd–O units are shown in purple, trigonal bipyramidal Ti–O units are shown in blue, and oxygen atoms as red spheres. Arrows indicate the dimensions of the larger channel.

II. EXPERIMENTAL
Bulk, polycrystalline samples were prepared by mixing stoichiometric amounts of Gd2O3 and TiO2 (Aldrich, 99.9% purity) and pressing into pellets using a cold uniaxial press. These were further consolidated using a cold isostatic press operated at 400 MPa. Pellets were sintered at 1550 °C for 48 h with a heating and cooling rate of 5 °C per minute.
Scanning electron microscopy (SEM) was carried out on a Zeiss Ultra Plus Gemini operated at 15 keV, fitted with an in-lens angle selective backscatter electron detector. The backscattered electron images were used to confirm the homogenous distribution of elements within the material (sensitivity ∼1% for the ∼50 nm of surface under analysis). The SEM was also equipped with an Oxford X-Max silicon drift detector energy dispersive x-ray spectrometer (EDX) used for confirmation of stoichiometry and homogeneity of the Gd2TiO5 sample. EDX data were collected and analyzed using the Oxford INCA Microanalysis software system. The purity of the sample was confirmed using SEM imaging and microanalysis.Reference Aughterson, Lumpkin, de los Reyes, Sharma, Ling, Gault, Smith, Avdeev and Cairney34
For electrochemical characterization, Gd2TiO5 was mixed with carbon black and polyvinylidene fluoride (PVdF) in a 75:15:10 ratio. N-Methyl-pyrrolidone (NMP) was added to the mixture as a solvent and left to mix overnight. The electrode slurry was deposited onto the copper current collector foil using a notch bar and the electrodes were dried under vacuum at 100 °C. Electrodes were then pressed followed by redrying at 100 °C under vacuum and transferred to an Ar filled glove box.
Research scale coin cells (CR 2032) were assembled using Na metal (∼1 mm thickness) and glass fiber separators with 1 M NaPF6 dissolved in dimethyl carbonate and ethylene carbonate (1:1 wt%) electrolyte solution. Lithium-ion cells were constructed in a similar manner with the use of Li metal, LiPF6, and polyethylene separators. The cells were cycled at a relatively slow rate of 4 mA/g between 2.5 and 0.01 V using an MTI corporation battery cycler.
In situ synchrotron XRD datasets were collected continuously on the powder diffraction beamline at the Australian Synchrotron using a wavelength of 0.706495(1) Å as determined using NIST SRM LaB6 660b. XRD data on the pure powder packed in a capillary was collected on the same beamline using a wavelength of 0.729590(1) Å. Coin cell sample preparation for the in situ XRD experiment was undertaken using the same procedure as above, except for windows in the coin cell casing and spacers, as described in our previous works,Reference Serras, Palomares, Rojo, Brand and Sharma14,Reference Sharma, Serras, Palomares, Brand, Alonso, Kubiak, Fdez-Gubieda and Rojo15,Reference Brant, Schmid, Du, Gu and Sharma19,Reference Gummow, Sharma, Feng, Han and He36 with the cell being constructed 3 days before the experiment. Data were collected in transmission mode. Each synchrotron XRD dataset was collected for 3 min per detector position with the Mythen II detector moving between two detector positions halfway through collection (6.38 min per pattern). The Mythen II microstrip detectorReference Schmitt, Bronnimann, Eikenberry, Gozzo, Horrmann, Horisberger and Patterson37 is a silicon strip detector. As implemented at the Australian Synchrotron, it comprises 16 detector modules, each containing 1280 channels and covering 5° 2θ, giving a total angular coverage of 80° 2θ. There is a physical gap of 0.5° between each module. Thus, to obtain a continuous 2θ scale, say between 5 and 85° 2θ, 2 detector positions are collected, offset by 0.5° 2θ, and merged in post processing. Slow discharge/charge currents of 4 mA/g were used. Rietveld refinements were carried out using the GSASReference Larson and Von Dreele38 software suite with the EXPGUIReference Toby39 software interface.
III. RESULTS AND DISCUSSION
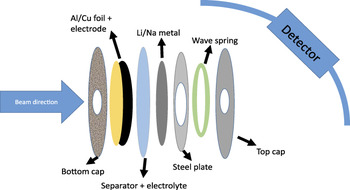
Initially, the beamline setup and some aspects of the in situ cell and data analysis are discussed before detailing the results from this anode material. Figure 2 shows a schematic of the coin cell with respect to the beam direction and detector. The electrode slurry is pasted on Cu for lithium-ion batteries or Al for sodium-ion batteries and the Cu or Al is in the beam path, prior to encountering the electrode. Thus, the beam only interacts with the kapton tape seal and the Cu or Al before the electrode material. The beam subsequently passes through the reminder of the cell as does the diffracted beam. This orientation of the cell appears to work best, as the diffractometer center can be determined relatively precisely and the electrode can be placed relatively accurately at the center. The center of the diffractometer with respect to the electrode layer in the coin cell is determined by first collecting data on a standard, in this case LaB6 in a capillary (centered with respect to the diffractometer). The capillary is switched over to the coin cell stage which is a stage that can be translated in all three dimensions. Burn paper is used initially to center the directions normal to the beam. To find the center parallel to the beam, LaB6 is coated on Cu or Al in a similar manner as the electrode slurry in a coin cell and a ‘standard cell’ is constructed with the LaB6 acting as the active material. The LaB6 reflections generated from inside the coin cell are standardized (i.e., matched) to the LaB6 reflections generated in the capillary, and in doing so the positions for the Cu or Al reflections in the coin cell are noted and hence standardized. The coin cell with the electrode under study is placed on the stage and the stage is adjusted such that the Cu or Al reflections match the standardized Cu and Al reflections from the ‘standard cell.’
Schematic of a typical coin cell that can be used for transmission based XRD studies. All the components are labeled and depending on whether the cell is lithium-ion or sodium-ion the components can be adjusted.

Further aspects that are crucial to this setup include: the steel plate that acts as a spacer has a hole that is ideally larger than the diameter of the holes in the caps of the coin cell (Fig. 2). Construction of the cell needs to minimize any displacement of the layers off the central position, e.g., the hole in the steel plate spacer should overlay the holes in the cap. Kapton tape with the edges of the tape glued on to the case (with an epoxy or similar) appears to work for most cells but should be constructed relatively close to beamtime (<3–4 days). The electrolyte can react with the adhesive on the tape and the tape itself. For transmission based experiments it is also important to choose an x-ray wavelength that can penetrate the components of the cell (e.g., ∼1 mm thick Na metal or Cu foil).
One issue that researchers may have, and that is discussed below, is the problem of sample preferred orientation. If we consider that the thickness of the electrode on the Cu or Al current collector is 200 μm and the beam diameter is 1 mm, the mass of sample in the beam is 0.018 mg and in our case this corresponds to 4.1 × 10⁻⁸ moles. Thus the number of particles in the beam is approximately 2.4 × 10¹⁶ particles. If, during the electrode coating process a sufficient fraction of the particles arrange such that there is a preferred crystallographic direction for adhering (or during drying) on to the Al or Cu surface this can manifest as preferred orientation in the diffraction patterns. A method to minimize preferred orientation is to rock the coin cell on the stage in a circular motion parallel to the beam, as rotating perpendicular to the beam will maintain the same preferred orientation issue. Unfortunately, the amount of sample rock that can be applied to the coin cell is directly related to the dimensions of the holes in the cap and spacer. This is because a large enough rock will produce reflections from the coin cell components, e.g., cap. If the sample rock does not work, the other means to account for preferred orientation is in the analysis of the diffraction data by modeling a preferred orientation term on one or more directions for Rietveld analysis or by undertaking Le Bail analysis where only the reflection positions are accounted for and the intensities are arbitrarily fitted. Note moving to Le Bail analysis limits the structural detail that can be extracted from such studies. Another alternative to alleviate preferred orientation issues is to use a 2D detector rather than the 1D Mythen detector. This can reduce or remove preferred orientation with appropriate integration of the data collected on the 2D detector.
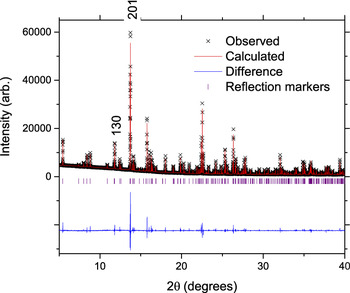
The results from an unconventional electrode in a coin cell, using the considerations outlined above, are discussed. An initial structural model of Gd2TiO5 was usedReference Hayun and Navrotsky35 and the Rietveld-refined lattice parameters were found to be a = 10.4946(5) Å, b = 11.3367(5) Å, and c = 3.75984(17) Å based on the first in situ synchrotron XRD dataset (with no applied current but with the electrode in the coin cell). The lattice parameters are similar to the reported valuesReference Hayun and Navrotsky35 and all reflections could be identified by Gd2TiO5, Al, and Na structural models. Before proceeding further we characterize the pure powder collected on the same beamline (Fig. 3). The lattice parameters are a = 10.48183(2) Å, b = 11.32450(1) Å, and c = 3.75735(1) Å using the same model as above, and slightly larger lattice parameters are observed in the coin cell.
The fit of the Rietveld model (red line) to the capillary XRD data of the Gd2TiO5 powder (black ×). The difference between the calculated model and the data is shown by the purple line. Vertical lines are Bragg reflection markers for the Gd2TiO5 phase. The figures of merit are a profile factor, R p = 3.54%, weighted profile factor, wR p = 5.13%, and the goodness-of-fit term, χ2 = 3.57.

For the electrode in the coin cell, the particle size broadening determined using the profile function in the refinements and the Scherrer equation was found to be 420 nm. SEM images confirmed a homogeneous distribution of Gd and Ti. Further structural characterization will be presented following the electrochemical results.
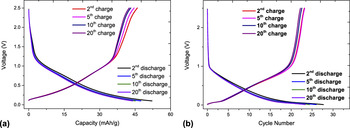
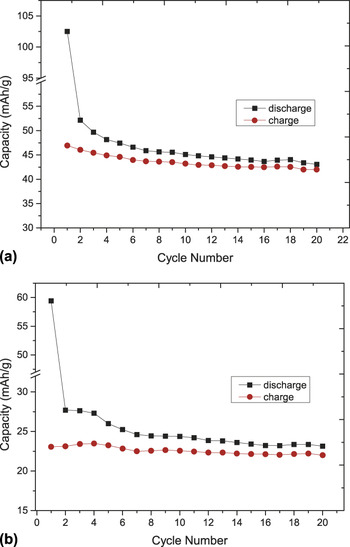
It is initially worthwhile to note that Gd2TiO5 is a good electrical insulator and with any electrochemical insertion/extraction reaction such insulating properties will adversely influence conductivity and battery function. It should be noted that poor electronic conductivity is also observed for Li4Ti5O12 and LiFePO4.Reference Du, Sharma, Kimpton, Jia, Peterson and Guo30,Reference Padhi, Nanjundaswamy and Goodenough40 With this information, very low current rates of 4 mA/g were used to ensure maximum Li or Na incorporation into the structure. The electrochemical discharge/charge curves are shown in Fig. 4 for both lithium- and sodium-ion cells. A larger amount of lithium can be reversibly cycled with Gd2TiO5 relative to sodium. The first discharge capacity of the lithium-ion cell is close to twice that of the sodium-ion cell, 102 mA h/g compared to 59 mA h/g. Lithium-ion cells show a reversible charge and discharge capacity of ∼45 mA h/g after 20 cycles while the sodium-ion cells show a reversible charge and discharge capacity of ∼23 mA h/g after 20 cycles (Fig. 5). The capacity equates to approximately 0.74 Li and 0.38 Na reversibly cycled with Gd2TiO5 between the second and twentieth cycle.
Comparison of the voltage versus capacity curves of (a) Li+ and (b) Na+ insertion/extraction with Gd2TiO5. The batteries were discharged to 0.1 V and charged to 2.5 V at 4 mA/g.

The cycling performance of the (a) Li+ and (b) Na+ insertion/extraction with Gd2TiO5. For lithium the first discharge capacity was 102 mA h/g and a cycled capacity of 47 mA h/g. While for sodium the first discharge capacity was 59 mA h/g and a cycled capacity of 23 mA h/g.

It is interesting to note that the initial capacity of the lithium-ion cell exceeds the theoretical capacity of 60.6 mA h/g, while the sodium-ion cell is at 97% of theoretical capacity. A proportion of the first discharge capacity would be the insertion of Li/Na into the carbon black conductive additive used in the electrode preparation, 15 wt% in both cases. While this would account for the sodium-ion cell, the capacity in the lithium-ion cell is substantially larger. The contribution of carbon black toward capacity was further characterized in lithium-ion cells containing electrodes composed of 5% carbon black, 15% PVdF, and 80% active material which resulted in the first discharge capacity of ∼68 mA h/g and fourth discharge capacity of ∼32 mA h/g at a higher current rate of 13.6 mA/g. Capacities of ∼32 mA h/g in the fourth cycle coupled with the higher rates used indicates that most of the lithium-ions are interacting with the Gd2TiO5 active material and not only the carbon black additive in the electrode. An alternative explanation for the high capacity observed in the first discharge of the lithium-ion cell at 4 mA/g is the variation in the Gd oxidation state from 3+ to 2+, for example on the surface, to allow the incorporation of Li/Na. Although unlikely, x-ray absorption spectroscopy is required to elucidate in detail any oxidation state variation. Overall, the potential profiles show two features, on discharge a potential drop early in discharge and a more gradual reduction in potential later in discharge. The discharge capacities are larger than the charge capacities [Figs. 3(a) and 3(b)] and the cumulative capacity over 20 cycles shows a large difference between discharge and charge of 968.6 and 871.3 mA h/g, respectively against Li, and 384.2 and 358.4 mA h/g, respectively against Na.
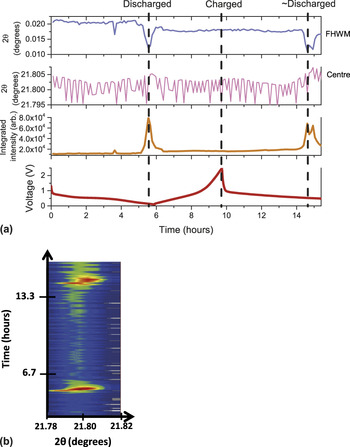
In situ synchrotron XRD experiments were performed during a discharge, a charge, and then another discharge of a sodium-ion cell with the goal to locate sodium sites in the Gd2TiO5 as we have shown in the Na3V2O2x(PO4)2F3−2x family.Reference Serras, Palomares, Rojo, Brand and Sharma14,Reference Sharma, Serras, Palomares, Brand, Alonso, Kubiak, Fdez-Gubieda and Rojo15,Reference Serras, Palomares, Alonso, Sharma, Lopez del Amo, Kubiak, Fdez-Gubieda and Rojo41 A single peak fitting routine (Gaussian function) applied to the evolution of the 431 reflection is shown in Fig. 6(a), a reflection showing a pronounced change at selected points in the electrochemical cell. Notably the peak position appears to be virtually unchanged (<0.01° change in the 2θ-value), and this is reproduced in the evolution of the lattice parameters during discharge/charge based on Rietveld sequential refinements (not shown). This suggests the insertion/extraction of sodium results in minor lattice or volume expansion during cycling, similar to the Li4Ti5O12 anode which exhibits <1% volume change.Reference Pang, Peterson, Sharma, Shiu and Wu11 This minor change may imply that the structure is compensating for Na insertion or that there is not enough Na insertion to cause major structural changes.
(a) Single peak fitting routine applied to the 431 reflection during discharge/charge, potential profile is also shown, and errors are omitted for clarity. (b) The corresponding evolution of this reflection (collated in situ synchrotron XRD patterns) during cycling of the battery where the color scale represents intensity, red is high intensity and blue is background.

Interestingly, the full width at half maximum (FWHM) and integrated peak intensity of the 431 reflection show a sharp decrease and rise respectively near the discharged state [Fig. 6(a)], which is evident in the collated diffraction patterns of the in situ synchrotron XRD experiment shown in Fig. 6(b). FWHM and integrated peak intensity appear to return to their original values at the charged state, however, they are subtly different with a smaller FWHM and larger integrated intensity.
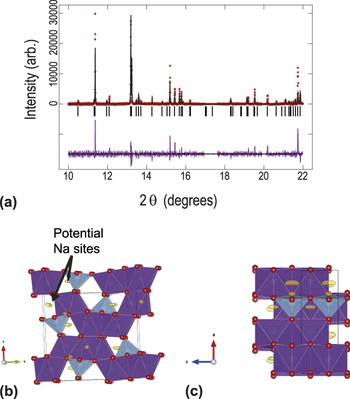
The key aspect of the structural model is the larger channel along the c axis direction which has dimensions 4.945(14) × 4.161(14) ÅReference Hayun and Navrotsky35 corresponding to the arrows in Fig. 1, approximately in the a and b axis directions respectively, and a smaller channel adjacent to it. In the Rietveld refinements, the reflection positions matched to the Gd2TiO5 structural model with refinement of the lattice parameters, zero-offset, background terms, and profile function. However, the reflection intensities were difficult to fit (see Fig. 7(a) as an example). Various permutations were trialed beginning with atomic parameters, but Ti and O atoms appeared to drift off their positions and only the heavy Gd atomic positions were stably refined. The atomic displacement parameters (ADPs) were also refined with all oxygen ADPs constrained to be equal, but the mismatch in peak intensity was still present. Note, the electrode is a thin layer on an Al substrate and there is the possibility of preferred orientation as the cell was stationary during data collection. This can be caused by the majority of the Gd2TiO5 crystallites in the path of the synchrotron x-ray beam aligning in a preferred direction, e.g., along the 〈130〉 direction, with respect to the beam, as discussed above. The inclusion of a preferred orientation parameter improved the fit but some mismatch of calculated and observed reflection intensity remained. Capillary synchrotron XRD data of the pure Gd2TiO5 powder (Fig. 3) also show that the peak intensities of the electrode in the cell feature preferred orientation as the 130 reflection (2θ ∼ 11.4°) is more intense than the 201 reflection (2θ ∼ 13.2°) in the cell, while in the capillaries the 130 reflection is only ∼20% as intense as the 201 reflection (Fig. 3 labeled).Reference Aughterson, Lumpkin, de los Reyes, Sharma, Ling, Gault, Smith, Avdeev and Cairney34 Taking a closer look at the Fourier difference maps, the presence of positive scattering density was revealed in the smaller interstitial sites [Figs. 7(b) and 7(c)] which may indicate other factors contributing to the intensity distribution. The positive Fourier density is most likely to be sodium. Although the location of the sodium is at the smaller channel in the structure, it appears similar to our recent workReference Pramudita, Godfrey, Whittle, Alam, Hanley, Brand, Schmid and Sharma42 that sodium uptake is occurring during cell construction and storage. The slightly larger lattice parameters observed in the coin cell relative to the pure powder (Fig. 3) may also indicate that this process is occurring. This is further evidenced by measuring the open circuit potential following cell construction, the lithium-ion cell drops by 1.6 V and the sodium-ion cell by 0.6 V after 24 h.
(a) The refined structural model of Gd2TiO5 with synchrotron XRD data. The sample is in the in situ cell. Data are shown as crosses, the calculated model as a line through the data, and the difference between the data and the model as the line below the data. The vertical reflection markers correspond to Gd2TiO5. Excluded regions correspond to Al or Na reflections. The Gd2TiO5 crystal structure and remaining Fourier electron density (yellow) along the (b) c and (c) b directions. Seven-coordinate Gd sites shown in purple and five-coordinated Ti sites shown in blue and oxygen in red.

Modeling sodium sites is complicated by the shape of the positive electron density [Figs. 7(b) and 7(c)] which suggests multiple sodium partially occupied sites. Furthermore, two sodium sites are required to account for the observed positive electron density, one corresponding to the x ∼ 0.85, y ∼ 0.025, z ∼ 0.25 and another to the x ∼ 0.85, y ∼ 0.72, z ∼ 0.25 crystallographic sites. Attempts were made to model these sites and small improvements in the fits were noted χ2, R p, and wR p dropping marginally from 4.26 to 4.14, 3.06 to 2.99, and 6.28 to 6.09, respectively.
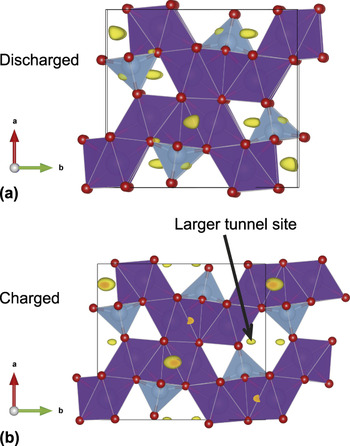
For comparison, the original model without sodium sites was used to model the discharged electrode and only the lattice, zero-offset, profile, Gd positions, and ADPs were allowed to refine. The largest increase in intensity involved the 431 reflection as shown in Fig. 6. The Fourier difference map shows similar positions of sodium sites compared to the initial electrode material, in the smaller channels. Using the same model and procedure with the charged (e.g., one full cycle) dataset shows evidence of sodium occupation at sites in the larger tunnel and the largest change in reflection intensity is found for the 310 reflection (Fig. 8).
The Gd2TiO5 crystal structure and remaining Fourier electron density (yellow) in the (a) discharged and (b) charged state. Seven-coordinate Gd sites shown in purple and five-coordinated Ti sites shown in blue and oxygen in red.

Thus, our analysis suggests that the smaller tunnel is active in the electrochemical process rather than the larger tunnel for the first discharge, and the larger tunnel appears to become occupied after this initial process or during the subsequent charge. This may suggest some Na+ migration occurs in the electrode. The larger or smaller tunnel may act to accumulate sodium and thus lower capacity after the first cycle, but further evidence is required to understand this behavior in detail. However, the quality of the fits may indicate further subtleties with the structural model of the electrode once placed into an electrochemical cell which are not completely captured. Nonetheless, an indication of both the electrochemical performance and structural consequence of sodium insertion/extraction is provided by this study.
IV. CONCLUSIONS
Using an unconventional example, this study illustrates some of the considerations that need to be accounted for in an in situ synchrotron XRD study on electrode materials. Although Gd2TiO5 is an effectively insulating material, both lithium and sodium ions can be reversibly electrochemically cycled using it as an electrode. The capacities are found to be ∼45 mA h/g in lithium-ion cells and ∼23 mA h/g in sodium-ion cells after 20 cycles when cycled at a rate of 4 mA/g. Minor changes were observed in the reflection positions during discharge/charge illustrating minimal volume expansion/contraction due to the insertion/extraction of lithium or sodium ions. Changes in the reflection profile, intensity, and FWHM were noted at the discharged state for the 431 reflection. Sodium appeared to locate on the smaller channels along the c axis direction in the structure during initial discharge and then move to the larger channels at the charged state.
This study does tackle an unusual material which may find alternative applications, the lithium- and sodium-inserted material (extracted discharged electrode) will in the future be investigated for its radiation tolerance. This provides an opportunity to use electrochemical cells as synthesis tools to generate modified lithium- or sodium-containing materials.
ACKNOWLEDGMENTS
Dr. Sharma would like to thank AINSE Ltd for providing support through the research fellowship scheme. Part of this research was undertaken on the powder diffraction beamline at the Australian Synchrotron, Victoria, Australia.