Introduction
Surface-enhanced Raman spectroscopy (SERS) is a powerful analytical technique that allows for highly sensitive structural detection of low concentration analytes [Reference Kneipp, Kneipp, Itzkan, Dasari and Feld1, Reference Pieczonka and Aroca2, Reference Sharma, Frontiera, Henry, Ringe and Duyne3]. To obtain high-quality SERS spectra, design of SERS substrates with a high enhancement factor (EF) has been a hot research topic. It is well known that gaps, crevices, or sharp features of the micro-/nanostructured noble metal (mainly Ag and Au) particles can act as “hot spots” to enhance Raman signal dramatically [Reference Chattopadhyay, Lo, Hsu, Chen and Chen4, Reference Lu, Li and Shi5, Reference Lu, Huang, Liu, Zhang, Song, Zhang, Zhang and Chen6]. Based on this concept, much effort is being devoted to fabricate novel SERS-active substrates with more hot spots. Recently, three-dimensional (3D) SERS substrates have attracted increased scientific interest. Compared with flat 2D SERS substrates, 3D SERS substrates can increase the accessible surface area for molecules to be detected, allow for the utilization of the full 3D focal volume of the incident laser, and create more bright hot spots within a certain area. Among 3D SERS-active substrates, noble metal micro-/nanostructures with 3D hierarchical architectures, such as sea-urchin-like Au particles [Reference Fang, Du, Lebedkin, Li, Kruk, Kappes and Hahn7], meatball-like Au particles [Reference Wang and Halas8], and flower-like Ag [Reference Liang, Li, Wang, Wu and Xu9] or Au [Reference Song, Zhou, Yang, Yang and Wang10] particles, have been reported. However, to fine-tune the surface topography of the above particles, kinetic process and surface passivation of nanoparticles (NPs) must be controlled precisely because any slight change in reaction parameter can result in drastic change in the morphology and size of the resultant crystalline structure [Reference Nhung and Lee11]. Compared with the harsh synthetic conditions of the above 3D SERS substrates, another 3D SERS substrate based on depositing noble metal NPs on 3D materials is promising. In this strategy, SERS enhancement mainly depends on the status of metal NPs on 3D materials rather than the morphology of single metal NP. The presence of 3D materials can increase the areal and volumetric density of metal NPs and reduce the gap distance between metal NPs, which can strongly enhance Raman signal [Reference Leem, Wang, Kang and Nam12]. For example, Nam and colleagues deposited Au NPs on the crumpled graphene sheets, which exhibited at least 1 order of magnitude higher SERS detection sensitivity than that of conventional, 2D flat graphene–Au NPs substrate [Reference Leem, Wang, Kang and Nam12]. Eychmüller and colleagues incorporated Au NPs into 3D ordered colloidal crystal film. The long-range ordering porous structure and the nanoscale roughness within this substrate enable higher Raman enhancement [Reference Lu, Randjelovic, Capek, Gaponik, Yang, Zhang and Eychmüller13].
Among the various 3D materials, the colloidosomes formed by the self-assembly of colloidal particles at an emulsion interface are 3D spherical structures [Reference Dinsmore, Hsu, Nikolaides, Marquez, Bausch and Weitz14]. After self-assembly or growth of noble metal NPs on their surface, the resulting materials can act as excellent SERS platforms because of high hot spots density across all spatial planes and high tolerance toward laser focus misalignment [Reference Zhang, Lee, Phang, Lee and Ling15, Reference Chuong, Quang, Lee, Phang and Ling16]. To date, the most promising method of fabrication of colloidosomes is based on Pickering emulsions and is first proposed by Granick and coworkers [Reference Hong, Jiang and Granick17]. Advantage of this method is that the obtained wax/silica colloidosomes are sufficiently stable because the silica spheres are “locked” tightly at frozen wax–water interfaces when the emulsions are cooled to room temperature [Reference Jiang, Schultz, Chen, Moore and Granick18]. Generally, this strategy is used to prepare silica-based Janus particles with tunable functionalities because the exposed side of the silica spheres assembled around solid wax can be further chemically modified. Assuming that the noble metal NPs can be deposited on wax/silica colloidosomes surface, the obtained wax/silica/metal colloidosomes should be ideal 3D spherical SERS substrates. However, to obtain perfect wax/silica/metal colloidosomes, the silica spheres stabilizing the colloidosome should be negatively charged to attract the positive noble metal precursor ions for NPs growth. Although amino-terminated silica (SiO2–NH2) spheres have been used widely to form wax/silica colloidosomes, SiO2–NH2 spheres with positively charged surface cannot attract metallic cations, such as [Ag(NH3)2]+ ions.
Herein, we used sulfonic acid group–terminated silica (SiO2–SO3H) spheres to form colloidosomes in wax/water Pickering emulsion. The SiO2–SO3H spheres with negatively charged surface favor the formation of the perfect wax/silica colloidosomes. More importantly, the negatively charged –SO3H groups can adsorb metal cations ([Ag[(NH3)2]+ or Au3+). Those adsorbed metal cations were in situ reduced to tiny Ag or Au NPs, which were employed as “seeds” for further growth of Ag(Au) nanostructures via seed-mediated growth technology in growth solution. To the best of our knowledge, there are no reports on fabrication of wax/silica colloidosomes and wax/silica/Ag(Au) colloidosomes using SiO2–SO3H spheres as building blocks. The size and coverage of Ag(Au) NPs on wax/silica colloidosomes were tuned by controlling reaction time in growth solution. Among the obtained wax/silica/Ag(Au) colloidosomes, wax/silica/Ag colloidosomes exhibited excellent SERS enhancement effect when 4-aminothiophenol (4-ATP) was used as probe molecules. In addition, well-defined silica/Ag(Au) Janus particles also were obtained via this strategy.
Results and discussion
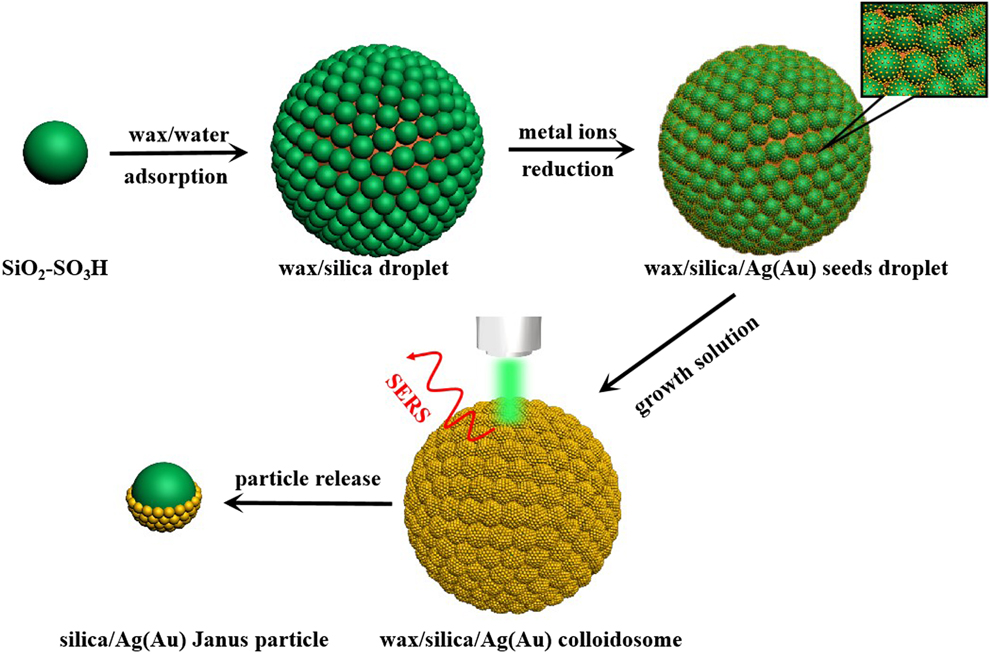
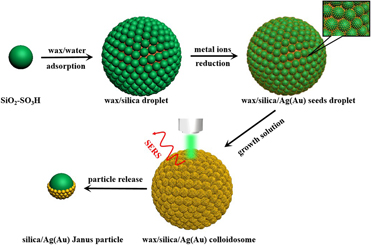
The strategy of fabrication of wax/silica/Ag(Au) colloidosomes is illustrated in Fig. 1. A wax/water Pickering emulsion stabilized by SiO2–SO3H spheres was first prepared and SiO2–SO3H spheres self-assembled at the wax–water interface (at 75 °C). After being cooled to room temperature, SiO2–SO3H spheres formed a monolayer around the solidified wax droplet. Because one side of SiO2–SO3H spheres was embedded in the solidified wax, the other side of SiO2–SO3H spheres adsorbed metal precursor ions, which were in situ reduced to tiny NPs (seeds). Finally, metal seed-decorated wax/silica colloidosomes were dispersed in growth solution containing metal precursor ions, and those “seeds” acted as nucleation sites for subsequent reduction, resulting in the formation of a dense coating of metal NPs on the exposed surface of SiO2–SO3H spheres. The wax/silica/Ag(Au) colloidosomes may act as 3D SERS substrates and the silica/Ag(Au) Janus particles also could be released from the wax/silica/Ag(Au) colloidosomes.
Schematic illustration of the fabrication of wax/silica/Ag(Au) colloidosomes and silica/Ag(Au) Janus particles.

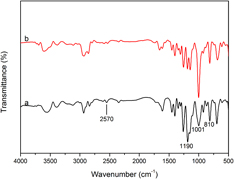
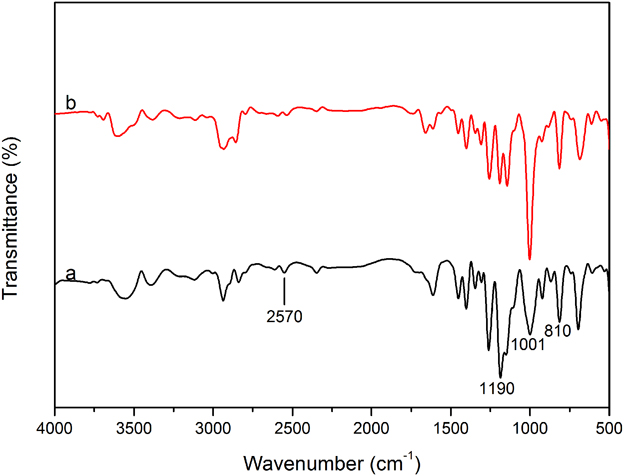
The Fourier transform infrared (FT-IR) spectra of SiO2–SH and SiO2–SO3H spheres are shown in Fig. 2. In Fig. 2(a), the bands at 810, 1001, and 1190 cm−1 are assigned to characteristic peaks of silica and the weak peak at 2570 cm−1 for the thiol stretching vibration is observed. In Fig. 2(b), this band was weakened after SiO2–SH spheres were treated with H2O2, indicating the formation of sulfonic acid species [Reference Shylesh, Sharma, Mirajkar and Singh19].
FT-IR spectra of (a) SiO2–SH and (b) SiO2–SO3H spheres.
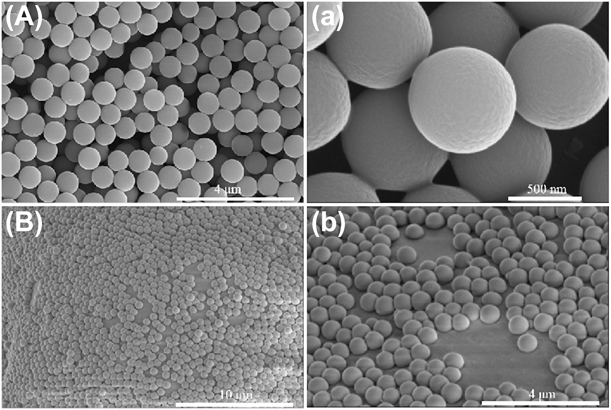
The scanning electron microscope (SEM) images of the SiO2–SO3H spheres used to form wax/silica colloidosomes are shown in Fig. 3(A, a), suggesting good uniformity in terms of size, shape distribution, and surface smoothness. According to the report by Aimable and colleagues [Reference Lebdioua, Aimable, Cerbelaud, Videcoq and Peyratout20], didodecyldimethylammonium bromide (DDAB) surfactant plays an important role in keeping Pickering emulsions stable by modifying silica spheres. In our experiment, the surface potential of the synthesized SiO2–SO3H spheres was measured and ζ potential is −32.8 mV. Because DDAB is a cationic surfactant, it is attracted to the negatively charged SiO2–SO3H spheres surface, which is beneficial to emulsions stability. The obtained wax/silica colloidosomes with 145–195 μm in diameter by Pickering emulsions exhibited spherical morphology and their surfaces were completely covered by SiO2–SO3H spheres (Fig. S1). As shown in Fig. 3(B, b), the SiO2–SO3H spheres had been immersed in the solidified wax and formed a well-organized shell around the solid wax droplet. The above SEM observation results demonstrate that the SiO2–SO3H spheres are ideal candidates for forming high-quality wax/silica colloidosomes.
SEM images of (A, a) SiO2–SO3H spheres and (B, b) SiO2–SO3H spheres immersed in the solid wax droplet.

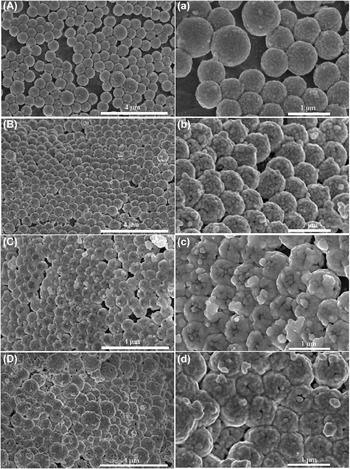
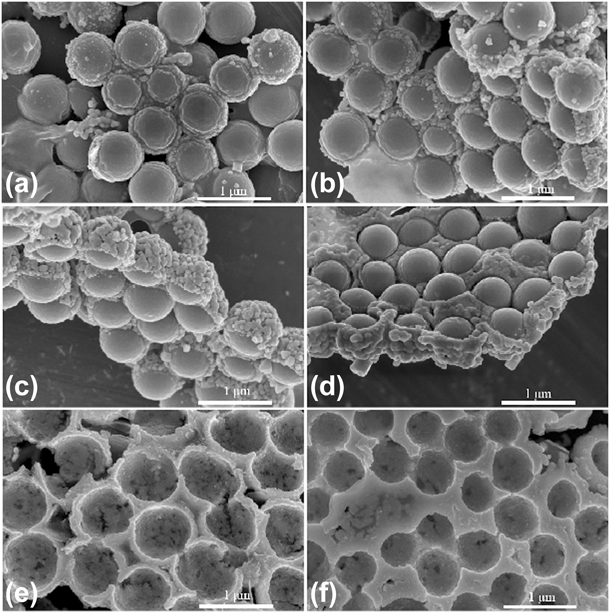
The above wax/silica colloidosomes were immersed in [Ag(NH3)2]OH solution. [Ag(NH3)2]+ ions were adsorbed on the exposed surface of SiO2–SO3H sphere and reduced to tiny Ag seeds by NaBH4. When seed-decorated wax/silica colloidosomes were re-dispersed in growth solution containing Ag(NH3)2OH and glucose for different time durations, the SEM images of the obtained wax/silica/Ag colloidosomes are shown in Fig. 4. From Fig. 4(A, a), it is found that small Ag NPs were formed on SiO2–SO3H spheres surface exposed toward the growth solution within short growth time (15 min). With the increase of growth time (30 min), both the size and the coverage of Ag NPs on SiO2–SO3H spheres were increased, as shown in Fig. 4(B, b). In Fig. 4(C, c), it is clear that the exposed surface of SiO2–SO3H spheres has been completely covered by Ag NPs and the crevices between SiO2–SO3H spheres became narrower by prolonging the growth time to 1 h. After 2 h, more reduced Ag0 not only continuously increased the thickness of Ag shell but also filled further the crevices between SiO2–SO3H spheres [as shown in Fig. 4(D, d)]. The SEM images of the whole wax/silica/Ag colloidosomes obtained at different growth time durations are shown in Fig. S2.
SEM images of Ag NPs on the surface of wax/silica colloidosomes for different growth time durations in growth solution: (A, a) 15 min, (B, b) 30 min, (C, c) 1 h, and (D, d) 2 h.

To observe further the coverage of Ag NPs on the exposed side of SiO2–SO3H spheres, the wax droplets were removed and the SEM images of relevant SiO2–SO3H/Ag composite spheres are shown in Figs. 5(a)–5(d). Well-defined SiO2–SO3H/Ag Janus particles were observed: the side of SiO2–SO3H spheres was coated by Ag NPs and the opposite side was free of Ag NPs. However, it is also found that short growth time resulted in only a few amount of Ag NPs on SiO2–SO3H spheres [Figs. 5(a) and 5(b)]. As the growth time increases, more reduced Ag0 gave rise to a dense Ag shell. At the same time, the crevices between SiO2–SO3H/Ag composite spheres were filled by the reduced Ag0, resulting in coalescing them to form ordered arrays [Figs. 5(c) and 5(d)]. Thicker Ag shell and the interconnection between SiO2–SO3H/Ag composite spheres endowed these arrays enough mechanical strength. Once the silica core was etched by hydrofluoric acid (HF) solution, Ag nanobowl arrays could be obtained [Figs. 5(e) and 5(f)].
SEM images of SiO2–SO3H/Ag Janus particles [different growth time durations in growth solution: (a) 15 min, (b) 30 min, (c) 1 h, and (d) 2 h] and (e and f) Ag nanobowl arrays.

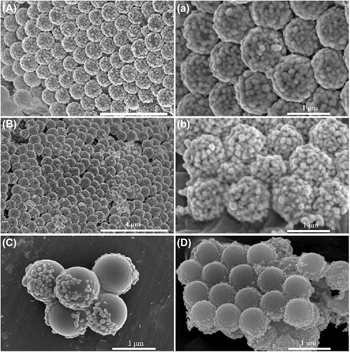
The same seed-mediated growth method is also used to grow Au NPs on wax/silica colloidosomes. However, it is found that the growth rate of Au NPs on the exposed surface of SiO2–SO3H spheres embedded in wax droplets is relatively slower than that of Ag NPs. Fig. 6(A, a) and Fig. 6(B, b) show the Au NPs grown on wax/silica droplets surface in growth solution for 4 h and 8 h, respectively. As seen from these SEM images, thicker and rougher Au shell was obtained with the increase in growth time. After the removal of wax droplets, relevant SiO2–SO3H/Au Janus particles were obtained [Figs. 6(C) and 6(D)].
SEM images of Au NPs on wax/silica colloidosomes for different growth time durations in growth solution (A-a: 4 h, and B-b: 8 h) and SiO2–SO3H/Au Janus particles (C and D).

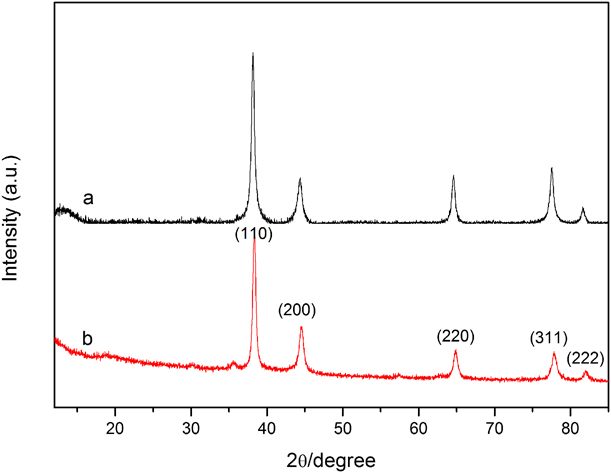
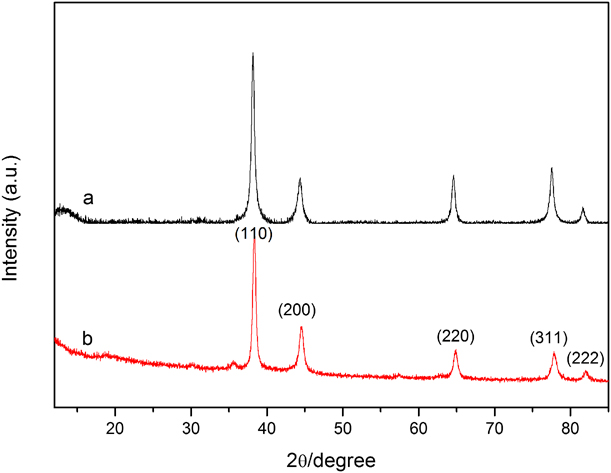
The X-ray diffraction (XRD) patterns of SiO2–SO3H/Ag and SiO2–SO3H/Au Janus particles are illustrated in Fig. 7. Figure 7(a) shows peaks at 2θ angles of 37.9, 44.1, 64.3, 77.2, and 81.4°corresponding to the reflections of the (111), (200), (220), (211), and (222) crystalline planes of the fcc structure of silver [Reference Deng, Chen and Wu21]. This result indicates that the crystalline Ag NPs have been formed on the surface of SiO2–SO3H spheres. According to the diffraction peak of (111), (200), (220), (311), and (222) in Fig. 7(b), it also indicated that highly crystalline, pure Au NPs have been successfully achieved [Reference Zhang, Liu, Wang, Zhan, Wang and Ming22] on the surface of SiO2–SO3H spheres by the seed-mediated growth method.
XRD patterns of (a) SiO2–SO3H/Ag and (b) SiO2–SO3H/Au Janus particles.
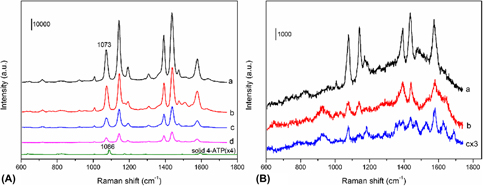
To investigate the SERS performance of the obtained 3D wax/silica/Ag(Au) colloidosomes, 4-ATP was chosen as probe molecules. Figure 7(a) shows the Raman spectra of 4-ATP with a concentration of 10−5 M on 3D wax/silica/Ag colloidosomes obtained for different growth time durations. From Fig. 8(A), it is found that the wax/silica/Ag colloidosome [growth time: 30 min, SEM image shown in Fig. 4(B)] exhibits the best Raman enhanced signal. Since Ag NPs within wax/silica/Ag colloidosomes had no especial nanostructures (such as sharp tips and edges), we considered the hot spots were mainly located in periodic crevices formed from close-packed SiO2–SO3H/Ag spheres and gap between Ag NPs. Compared with the sample (growth time for 15 min), the obtained sample (growth time for 30 min) provided narrower crevices and gaps due to the increase in the size of Ag NPs. According to the previous reports [Reference Lu, Huang, Liu, Zhang, Song, Zhang, Zhang and Chen6, Reference Liu, Goyal, Forrester, Ma, Miller, Mansoorieh, Henjum, Zhou, Cochran and Jiang23], narrower crevices and gaps can strongly enhance surface plasmon effect and Raman signals. However, more growth time (1–2 h) resulted in reducing the amount of the hot spots because those crevices and gaps were gradually filled. In addition, the surface curvature became smaller as Ag NPs grew bigger, which also lowered the SERS enhancement.
(A) Raman spectra of 4-ATP (10−5 M) on the wax/silica/Ag colloidosomes obtained for different growth time durations in growth solution (a: 30 min, b: 15 min, c: 1 h, and d: 2 h). (B) Raman spectra of 4-ATP of various concentrations (a: 10−7 M, b: 10−8 M, and c: 10−9 M) on wax/silica/Ag colloidosomes obtained in growth solution for 30 min.

To determine the enhancement effect of 4-ATP molecule (10−5 M, 10 μL) adsorbed on wax/silica/Ag colloidosome quantitatively, the EF of 4-ATP is calculated by the following expression [Reference Sun, Wang, Sun, Guo, Yang, Liu, Xu and Li24]:
 $${\rm{EF}} = {{{I_{{\rm{SERS}}}}{N_{{\rm{bulk}}}}} / {{I_{{\rm{Raman}}}}{N_{{\rm{surface}}}}\quad ,}}$$
where I SERS and I bulk stand for the intensity of a vibrational mode in the SERS spectrum of 4-ATP and that of solid sample, respectively. N bulk and N surface are the number of 4-ATP molecules adsorbed on the SERS substrate and bulk molecules illuminated by the laser light to obtain the corresponding SERS and ordinary Raman spectra, respectively. According to the previous report [Reference Kneipp, Wang, Kneipp, Perelman, Itzkan, Dasari and Feld25], N bulk is 8.9 × 10⁹ in the detected solid sample area (the diameter of the laser spot is 1 μm and the penetration depth is 2 μm). The density of the molecules on the SERS substrate was assumed to be 10−5 M × 10 µL × NA/cm2, namely, 6.0 × 10¹³ molecules/cm2. The surface area of the laser spot with 1 μm diameter is about 7.9 × 10⁻⁹ cm2, so N surface is 4.7 × 10⁵. For the calculation of EF values, the intensity of the υcs at 1073 cm−1 was used. The EF was calculated to be 5.3 × 10⁵ for the wax/silica/Ag colloidosome. This value is equal or close to that of other Ag or Au substrates using the same probe molecules [Reference Liu, Cao, Song, Ai and Lu26, Reference Wang, Guo, Chen and Wang27, Reference Hu, Wang, Wang and Dong28]. The SERS performance of 4-ATP on the wax/silica/Au colloidosomes is shown in Fig. S3 and their Raman enhancement ability is relatively weaker than that of wax/silica/Ag colloidosomes. Figure 8(B) depicts the intensities of the Raman spectra of 4-ATP with lower concentrations (10−7 to 10−9 M) on wax/silica/Ag colloidosome. The detection limit of 4-ATP reached 10−9 M, implying that the wax/silica/Ag colloidosomes have high sensitivity to the target molecule, even at very low concentrations.
Conclusions
In summary, we reported the synthesis of silica/wax/Ag(Au) colloidosomes by integrating Pickering emulsion method and seed-mediated growth technology of noble metal NPs. The SiO2–SO3H spheres played important roles in fabricating perfect wax/silica colloidosomes and chemical deposition of Ag(Au) NPs. By this strategy, both silica/Ag(Au) Janus particles and silica/wax/Ag(Au) colloidosomes could be obtained. The silica/wax/Ag colloidosomes exhibited excellent SERS performance for detection of 4-ATP molecules. Although Ag(Au) NPs were selected to grow on wax/silica colloidosomes surface, our system can be used to design similar structures for other functional materials with tunable topologies and functionalization for various applications.
Experimental section
Materials
3-Mercaptopropyl trimethoxysilane (MPTMS), paraffin wax (melting point: 54–56 °C), and 4-ATP were purchased from Sigma-Aldrich (Saint Louis, Missouri). AgNO3, HAuCl4·4H2O, ammonium hydroxide (NH4OH, 25%), hydrogen peroxide (H2O2, 30%) dilauryldimethylammonium bromide (DDAB), potassium carbonate (K2CO3), glucose, hydroxylamine hydrochloride, and chloroform purchased from Sinopharm Chemical Reagent Co., Ltd., (Shanghai, China). All agents were used without further purification.
Synthesis of SiO2–SO3H spheres
Monodisperse SiO2–SH spheres were synthesized according to our previous report [Reference Ren, Wang, Shang, Zou and Cheng29]. First, 0.5 mL of MPTMS was added dropwise into 50 mL of deionized water under vigorous stirring. Then, the mixed solution was heated to 40 °C. When a transparent solution was obtained, 0.5 mL of NH4OH was added to the above solution under stirring. After 6 h, the products were collected by centrifugation and rinsed several times with ethanol. Finally, the product was vacuum dried at 50 °C for 24 h.
The obtained SiO2–SH spheres (0.2 g) were dispersed in 20 mL of H2O2 solution, and the mixed solution was stirred for 3 h. The obtained SiO2–SO3H spheres with a diameter of about 780 ± 20 nm were separated and rinsed with deionized water and then vacuum dried at 50 °C.
Synthesis of wax/silica Pickering emulsions
Pickering emulsions were prepared on the basis of a wax-in-water emulsion presented in Reference Hong, Jiang and GranickRefs. 17 and Reference Lebdioua, Aimable, Cerbelaud, Videcoq and Peyratout20. In a typical experiment, 0.2 g of SiO2–SO3H spheres was dispersed in 8 mL of deionized water, and the mixed solution was heated to 75 °C. Then, 2 mL of DDAB aqueous solution (60 mg/L) and 1.65 g of wax were added to the above solution under stirring at 900 rpm for 15 min at 75 °C. Finally, the mixture was stirred vigorously in a modular homogenizer at 15,000 rpm for 160 s. The whole system was cooled down to room temperature, and the obtained wax/silica droplets were filtered and washed multiple times with deionized water to remove free or weakly attached silica spheres.
Synthesis of wax/silica/Ag colloidosomes and silica/Ag Janus particles
0.2 g of the solidified wax/SiO2–SO3H droplets was dispersed in 20 mL of the freshly prepared Ag(NH3)2OH solution (0.01 mM) under stirring for 1 h. Then, 10 mL of NaBH4 aqueous solution (0.01 M) was added to the mixed solution. After 1 h, the obtained wax/SiO2–SO3H droplets decorated with tiny Ag NPs (as seeds) were filtered and redispersed in 10 mL of Ag(NH3)2OH solution (0.12 mM). Subsequently, 15 mL of glucose solution (0.56 M) was added to the above suspension and the reaction was allowed for different time durations (15 min, 30 min, 1 h, and 2 h) at 0 °C. Finally, the products were filtered, washed with ethanol, and vacuum dried at room temperature. To release SiO2–SO3H/Ag Janus particles from wax, the wax was dissolved in chloroform at room temperature for 24 h. Then, the resulting particles were further treated with HF to etch SiO2–SO3H particles and the Ag nanobowls were obtained.
Synthesis of wax/SiO2–SO3H/Au colloidosomes and silica/Au Janus particles
0.05 g of K2CO3 and 3 mL of HAuCl4 aqueous solution (1%) were added to 100 mL of deionized water. After 30 min of stirring, the solution became colorless, indicating the formation of gold hydroxide solution [Reference Shi, Sahoo, Swihart and Prasad30]. 0.2 g of the solidified wax/SiO2–SO3H droplets was dispersed in 30 mL of gold hydroxide solution under stirring for 4 h. Then, 10 mL of NaBH4 aqueous solution (0.15 M) was added to the mixed solution. After 2 h, the obtained solidified wax/SiO2–SO3H droplets decorated with tiny Au NPs (as seeds) were filtered and redispersed in the growth solution containing 50 mL of deionized water and 1.6 mL of HAuCl4 solution (1%). Subsequently, 8 mg of hydroxylamine hydrochloride was added to the above solution and stirred for different time durations. Finally, the products were filtered, washed with ethanol, and vacuum dried at room temperature. The SiO2–SO3H/Au Janus particles were obtained by immersing wax/SiO2–SO3H/Au colloidosomes in chloroform solution for 24 h.
SERS measurement
10 μL of 4-ATP ethanol solution with different concentrations was dropped on the wax/silica/Ag(Au) colloidosomes. Then, the samples were dried under high-purity flowing N2 for Raman examination.
Characterization
The FT-IR spectra of the samples were obtained using Nicolet 6700 spectrophotometer (Nicolet Instrument Corporation, Madison, Wisconsin). The morphology of the products was observed by field-emission scanning electron microscopy (Nova NanoSEM650, FEI, Hillsboro, Oregon; and TM3000, Hitachi, Tokyo, Japan). ζ potential measurement was performed using a Zeta sizer NanoZS (Malvern Instruments, Malvern, United Kingdom). The products were characterized by XRD by carrying out on a Rigaku D/max-RA X-ray diffractometer (Rigaku, Tokyo, Japan) using Cu Kα radiation (λ = 1.5418 Å). The Raman spectra were recorded by using a microscopic confocal Raman spectrometer (Renishaw PLC, London, England) employing a 633 nm laser beam (1 μm laser spot) and a charge-coupled detector with 4 cm−1 resolution.
Supplementary material
To view supplementary material for this article, please visit https://doi.org/10.1557/jmr.2019.116.
Acknowledgments
This work was sponsored by K.C. Wong Magna Fund in Ningbo University and the Natural Science Foundation of Zhejiang (LY18E030003).