Cheese is a widely consumed dairy product and its market is growing significantly (Shahbandeh, Reference Shahbandeh2024). Up till now, more than 1000 different cheese varieties have been described, and they can be classified by several parameters, for example, the origin of the milk, cheese-making process, cheese composition, ripening time (Ritschard and Schuppler, Reference Ritschard and Schuppler2024). In the same direction, it has been reported that consumers are more and more interested in fermented foods due to the rising evidence of their benefits to human health (Gänzle et al., Reference Gänzle, Monnin, Zheng, Zhang, Coton, Sicard and Walter2024).
The maturation stage plays a key role in developing cheese flavour. Depending on the cheese variety, this period could range from one or two months to many (e.g., mild vs. extra mature Cheddar cheese). Proteolysis, glycolysis, and lipolysis are the main metabolic pathways involved during the ripening of cheese (Smit et al., Reference Smit, Smit and Engels2005; Azarnia et al., Reference Azarnia, Robert and Lee2006; Blaya et al., Reference Blaya, Barzideh and LaPointe2018). Different type of enzymes, including indigenous milk enzymes, exogenous enzymes and endogenous enzymes are involved. Specifically, proteases, peptidases and transaminases from non-starter lactic acid bacteria (NSLAB) have a significant impact on the quality of most cheese varieties (Blaya et al., Reference Blaya, Barzideh and LaPointe2018). NSLAB is a group of microorganisms originating from raw milk and factory environments that dominate cheese microbiota during ripening (Settanni and Moschetti, Reference Settanni and Moschetti2010). The effect of a given NSLAB on the cheese flavour may be positive (flavour-producing bacteria) or negative (off-flavour-producing bacteria). Considering the unpredictable and dynamic nature of these communities the control of cheese quality can be a challenge (Broadbent et al., Reference Broadbent, Houck, Johnson and Oberg2003).
The use of selected strains of lactobacilli as secondary cultures in cheese making is widely employed to control the cheese microbiota and increase the levels of enzymes that are of interest for cheese ripening (González and Zárate, Reference González and Zárate2015; Khattab et al., Reference Khattab, Guirguis, Tawfik and Farag2019; Oberg et al., Reference Oberg, McMahon, Culumber, McAuliffe and Oberg2022). In this context, hundreds of strains have been characterized as potential adjunct cultures (Williams et al., Reference Williams, Noble, Tammam, Lloyd and Banks2002; Williams et al., Reference Williams, Withers, Brechany and Banks2006; De Angelis et al., Reference De Angelis, Calasso, Di Cagno, Siragusa, Minervini and Gobbetti2010; Stefanovic et al., Reference Stefanovic, Kilcawley, Rea, Fitzgerald and McAuliffe2017; Stefanovic et al., Reference Stefanovic, Kilcawley, Roces, Rea, O'Sullivan, Sheehan and McAuliffe2018). In addition, there are many studies that have shown the benefits of the addition of lactobacilli strains with key enzymatic activities as secondary cultures to boost cheese flavour and accelerate the ripening process (Settanni and Moschetti, Reference Settanni and Moschetti2010; Gobbetti et al., Reference Gobbetti, De Angelis, Di Cagno, Mancini and Fox2015). Besides the microbial enzymatic abilities, the accessibility of these enzymes to their substrates also has a key role during cheese ripening (Wilkinson et al., Reference Wilkinson, Timothy, Guinee, O'Callaghan and Fox1994; Smit et al., Reference Smit, Smit and Engels2005; Wilkinson and LaPointe, Reference Wilkinson and LaPointe2020). In this regard, several disruptive (cell lysis) treatments, including chemical, mechanical and enzymatic methods, have been proposed to enhance the cell membrane permeability of the adjunct cultures with a concomitant increase of the enzymatic activity due to release of intracellular enzymes (Geciova et al., Reference Geciova, Bury and Jelen2002; Gobbetti et al., Reference Gobbetti, De Angelis, Di Cagno, Mancini and Fox2015). For instance, mechanical treatments using high-pressure homogenization (Yarlagadda et al., Reference Yarlagadda, Wilkinson, O'Sullivan and Kilcawley2014; Peralta et al., Reference Peralta, Aguirre, Bürgi, Martínez, Albarracín, Menzella, Pozza, Hynes and Bergamini2023a) and sonication probes (Di Cagno et al., Reference Di Cagno, De Pasquale, De Angelis and Gobbetti2012), as well as enzymatic treatments (Coolbear et al., Reference Coolbear, Pillidge and Crow1994; Peralta et al., Reference Peralta, Bergamini and Hynes2019) have been reported as lysis methods. Other methods involve partial damage to the cell envelope that allows substrates (amino acids, small peptides, carbohydrates) to enter the cell more easily. For example, chemical methods using ethanol and SDS have been reported as effective permeabilizing agents (Somkuti et al., Reference Somkuti, Dominiecki and Steinberg1998). Both lysis and permeabilization methods applied on adjunct cultures can increase the accessibility of their enzymes to their substrates, increasing the metabolic reactions during the ripening. However, the effectiveness of these methods should be validated for each case because it depends on many factors, such as the type of microorganism (genera, specie, strain), growth conditions (growth media, growing time), the type and intensity of the treatment, and so forth (Doolan and Wilkinson, Reference Doolan and Wilkinson2009; Peralta et al., Reference Peralta, Bergamini and Hynes2019).
As for enzymatic methods, both mutanolysin and lysozyme (LZ; EC 3.2.1.17; peptidoglycan N-acetylmuramoylhydrolase) have been used as lytic enzymes to release key enzymes from lactic bacteria. Thirty years ago, Coolbear et al. (Reference Coolbear, Pillidge and Crow1994) reported the use of the combination of mutanolysin and LZ to lyse Streptococcus thermophilus cells. Later, Bunthof et al. (Reference Bunthof, Van Schalkwijk, Meijer, Abee and Hugenholtz2001) and Peralta et al. (Reference Peralta, Bergamini and Hynes2019) used mutanolysin to lyse Lactococcus lactis subsp. lactis MG1363 and two S. thermophilus strains, respectively. These treatments have the advantage that they do not require any additional equipment. LZ is used as a preservative in food (cheese, beer, and wine) due to its antimicrobial activity against spoilage microorganisms (Khorshidian et al., Reference Khorshidian, Khanniri, Koushki, Sohrabvandi and Yousefi2022; Lambré et al., Reference Lambré, Barat Baviera, Bolognesi, Cocconcelli, Crebelli, Gott, Grob, Lampi, Mengelers, Mortensen, Rivière, Steffensen, Tlustos, Van Loveren, Vernis, Zorn, Andryszkiewicz, Kovalkovicova, Liu, di Piazza, Ferreira de Sousa and Chesson2023). LZ can hydrolyse (1–4)-beta-linkages between N-acetyl-D-glucosamine residues and N-acetylmuramic acid in peptidoglycans of bacterial cell walls. In the dairy industry, LZ is added to the cheesemilk due to its ability to inhibit the growth of vegetative cells of Clostridium tyrobutyricum and hinder the germination of its spores, a process that would otherwise produce late gas blowing in cheese (Fox, Reference Fox, Kelly and Larsen2021). Considering that LZ is safe to be used in food, this practice is allowed in many parts of the world (Lambré et al., Reference Lambré, Barat Baviera, Bolognesi, Cocconcelli, Crebelli, Gott, Grob, Lampi, Mengelers, Mortensen, Rivière, Steffensen, Tlustos, Van Loveren, Vernis, Zorn, Andryszkiewicz, Kovalkovicova, Liu, di Piazza, Ferreira de Sousa and Chesson2023). For instance, The European Food Safety Authority (EFSA) in Europe and Food and Drug Administration (FDA) in United States authorize the use of LZ as a preservative, as do other national food safety authorities including in Argentina.
Although LZ is widely used in cheese manufacture as a preservative and there is scientific evidence about its potential for the preparation of attenuated cultures, the lysis by LZ of an adjunct culture in situ during the ripening process has not been addressed until now. The objectives of this study were (i) to assess the effect of LZ on cell integrity and metabolic potential of Lactiplantibacillus plantarum 29 (L29) and Lacticaseibacillus rhamnosus 77 in an in vitro study and (ii) to evaluate the influence of a secondary culture of L29 alone or in combination with LZ, as well as the influence of a cell-free extract of L29 on the ripening parameters of a miniature mature cheese.
Materials and methods
Bacterial strains
Lactiplantibacillus plantarum 29 (L29) and Lacticaseibacillus rhamnosus 77 (L77) belong to the INLAIN collection (Santa Fe, Argentina). The strains were activated by growing twice in MRS broth (Biokar Diagnostics, Beauvais, France) at 37°C for 18 h. The strains were selected due to their partial sensibility to LZ reported by Ugarte et al. (Reference Ugarte, Guglielmotti, Giraffa, Reinheimer and Hynes2006) and key enzyme profiling in ripening process reported by Peralta et al. (Reference Peralta, Bergamini and Hynes2016). L29 and L77 were isolated from a raw milk artisanal cheese and a Cremoso cheese, respectively.
In vitro study
In the first experiment, sensitivity to LZ was studied on both L29 and L77. The activated cells were inoculated in MRS media (40 ml) at 2% (v/v) and incubated at 37°C for 20 h. After incubation, the cell suspensions (109 cfu/ml) were centrifuged at 10 000 × g for 10 min at 4°C and the cells were washed twice using potassium phosphate buffer (50 mM, pH 7). Then, the cells were treated with LZ (25 ppm) (Lysozyme hydrochloride granulate, Bioseutica, The Netherlands) in the wash buffer for 22 h at 37°C. Controls were cell suspensions incubated in the same conditions but without the addition of LZ. Three independent replicates for each experimental condition were performed. The LZ-treated cell suspensions of L29 and L77 were named 29T and 77T, respectively; meanwhile, their respective controls were named 29C and 77C. During the incubation, the reduction of turbidity (optical density) was evaluated in a spectrophotometer (UV/VIS Lambda 20, Perkin Elmer) at 600 nm. At the endpoint (22 h), cell culturability, cell physiological profile, and cell architecture were studied. Cell culturability was carried by plate counts in MRS. Cell physiological profile was analysed by fluorescence microscopy and flow cytometry (FC) after dyeing cells with thiazole orange and propidium iodide (Doherty et al., Reference Doherty, Wang, Ross, Stanton, Fitzgerald and Brodkorb2010). The cell viability kit (BD Biosciences, CA, USA) was used according to the manufacturer's instructions. The dyed cells were analysed in a fluorescence microscope (Eclipse Ti, Nikon, Japan) using a high-resolution camera (Digital sight DS-U3, Nikon, Japan). FC analysis was carried out in a Guava® EasyCyteTH cytometer (Guava Technology, USA). Acquisition and analysis of FC data were performed using Guava CytoSoftTM 3.6.1 software and FlowJo 10 (BD Biosciences), respectively. Cell architecture was examined in a Zeiss SUPRA 55VP scanning electron microscope as outlined by Bequer Urbano et al. (Reference Bequer Urbano, Albarracín, Ordoñez, Farías and Alvarez2013).
The activities of lactate dehydrogenase (LDH) and β-galactosidase (β-GAL) were assessed as per Daryaei et al. (Reference Daryaei, Coventry, Versteeg and Sherkat2010) and Vinderola and Reinheimer (Reference Vinderola and Reinheimer2003), respectively, in the cell-free extracts (CFE). CFE were obtained after centrifugation of the cell suspensions at 10 000 × g for 10 min and filtration using a 0.22 μm PVDF membrane filter (GVS North America, Sanford, USA). The CFE from 29T, 77T, 29C, and 77C were named CFE-29T, CFE-77T, CFE-29C, and CFE-77C, respectively. Both enzymes are traditional indexes of cell permeabilization or lysis.
In the second experiment, an aliquot of CFE-29T was used as a ripening agent in a miniature mature cheese. Furthermore, the potential of LZ to lyse L29 cells in situ in cheese was assessed as described below.
Cheese manufacture
Four miniature cheeses (Cheeses A, B, C and D) were made in triplicate as per Peralta et al. (Reference Peralta, Beret, Bürgi, Ale, Martínez, Albarracín, Wolf and Bergamini2023b). Briefly, the raw milk from a dairy plant (Milkaut, Franck, Santa Fe) was batch pasteurized (at 63°C for 30 min) and then supplemented with calcium chloride (0.02% w/v). Cheese A was manufactured with Streptococcus thermophilus (106 cfu/ml: ST12, Chr. Hansen, Argentina) as starter culture and no ripening agent was added. Cheese B was made with the same starter culture and L29 cells (106 cfu/ml) as ripening agent. Cheese C was made with the same starter culture and L29 cells (106 cfu/ml) together with LZ (25 ppm) as ripening agent. Cheese D was made with the same starter culture and CFE-29T (10 ml/l) as ripening agent. Coagulant (ChyMax, Chr. Hansen, Argentina) was added to the cheese milk in a dose of 34 IMCU/L. The curd was cut until reaching the size of a corn grain and cooked, under stirring, at a rate of 1°C/min to reach 45°C. After eliminating most of the whey, the curd was moulded in perforated small plastic beakers. The curd was covered with the perforated lids, pressed, and acidified inside an acidification chamber at 45°C to reach a pH of 5.3. The cheeses were salted in cold sterile brine and then stored in a maturation chamber at 12°C. After a week, the cheeses were coated with a commercial paint coating, vacuum-packed in plastic bags, and maturated (12°C; 80% relative humidity) until 8 months old. A picture of the cheeses before and after painting them is illustrated in online Supplementary Fig. S1. Microbiological counts, overall composition (moisture, protein, and fat), pH, minerals, carbohydrates, organic acids, peptidases and peptide profiles were analysed at the end of ripening.
Overall composition, pH and minerals of cheeses
Moisture, protein and fat of cheese were analysed by standard methods (ISO, 2014, 2008, 2004). The pH was assessed by mixing 10 g of cheese with 10 g of deionized water (Bradley et al., Reference Bradley, Arnold, Barbano, Semerad, Smith, Vines and Marshall1993). Mineral composition of cheeses was assessed by inductively coupled plasma mass spectrometry (ICP-MS). Briefly, cheese samples were ashed in a muffle furnace (Estigia, Argentina) using the following temperature ramp: 3 h at 80°C, 3 h at 140°C, 4 h at 200°C, 4 h at 400°C, 10 h at 550°C, and then cooled to room temperature. Afterward, the ashed samples were resuspended in ultrapure nitric acid (Sigma Aldrich, Missouri, USA) and then diluted in ultrapure water and finally analysed using an Elan 9000 system (Perkin Elmer Life and Analytical Sciences, Shelton, USA). An ELAN 3.5 software (Perkin Elmer, USA) was used for the data acquisition.
Microbial enumeration of cheeses
Microbiological enumeration was made by plate counts. Cheese samples (10 g) were homogenized in 2% (w/v) sodium citrate solution (90 ml) using a Stomacher for 3 min at maximum speed (Bergamini et al., Reference Bergamini, Hynes, Meinardi, Suárez, Quiberoni and Zalazar2010). Then, decimal dilutions were prepared in 0.1% (w/v) peptone solution. MRS agar (de Man, Rogosa, and Sharpe agar) acidified at pH 5.4, MPCA agar (milk plate count agar), and BEA agar (bile esculin azide agar) were used to estimate the level of total lactic acid bacteria (LAB), lactobacilli, and enterococci, respectively. All plates were incubated for 48 h at 37°C under microaerobic condition. VRBL agar (violet red bile lactose agar) incubated at 32°C for 24 h was used to count coliforms. YGC agar (yeast extract glucose chloramphenicol agar) incubated at 25°C for 5 d was used to enumerate yeast and moulds.
Organic acids and carbohydrates analysis of cheeses
Organic acids and carbohydrates were analysed in cheese by high-performance liquid chromatography (HPLC) (Bouzas et al., Reference Bouzas, Kantt, Bodyfelt and Torres1991; Beret et al., Reference Beret, Bergamini, Giménez, Ale, Wolf and Peralta2024). Briefly, 5 g of cheese samples were homogenized in 0.01 M H2SO4 (25 ml) using an Ultraturrax® homogenizer. Then, the suspensions were heated at 40°C in a water bath for 15 min and then centrifuged (10 000 g, 30 min, 10°C). The aqueous phases were filtered using fast-flow filter paper and 0.45 μm PVDF membrane filter (GVS North America, Sanford, USA). Finally, they were injected into HPLC. The HPLC system (Series 200 and Flexar, Perkin Elmer, Norwalk, CT, USA) was equipped with an on-line degasser, a quaternary pump, a column oven, and two detectors connected in line: UV detector set at 210 nm and IR detector set at 35°C. The separation was carried out at 65°C by an HPX-87H column (Aminex, 300 × 7.8 mm, Bio-Rad Laboratories, CA, USA) and an isocratic elution using 10 mM H2SO4 with a flow rate of 0.6 ml/min.
Peptidase and peptide profiling of cheeses
Cheese extracts for aminopeptidase activities were obtained according to Juan et al. (Reference Juan, Ferragut, Buffa, Guamis and Trujillo2007), with some modifications. Briefly, the cheese samples (5 g) were homogenized in 10 ml of 50 mM potassium phosphate buffer (pH = 7) using an Ultraturrax® homogenizer (model T25, IKA, Staufen, Germany). Then, the suspensions were centrifuged at 10 000 g for 15 min at 4°C. The supernatants were filtered using a 0.22 μm PVDF membrane filter (GVS North America, Sanford, USA) and stored at −20°C until analysis. The activity of six peptidases was evaluated in the cheese extracts using p-nitroanilide derivatives (chromogenic substrates) (H-Val-pNA, H-Lys-pNA⋅2 HBr, H-Leu-pNA, H-Met-pNA, Z-Gly-Pro-pNA and H-Arg-pNA⋅2 HCl) obtained from Bachem (Torrance, CA, USA) (Ale et al., Reference Ale, Ibáñez, Wilbanks, Peralta, Ceylan, Binetti, Bolling and Lucey2023). After the reaction of the samples on each substrate, the absorbance at 405 nm was determined, using a microtitre plate scanner spectrophotometer (Multiskan FC, Thermo Scientific, USA). The results were calculated using a molar extinction coefficient of 8800 (M−1 cm−1). One unit of enzyme activity was defined as 1 nmol of NA released per minute per millilitre of cheese juice. The peptide profiles were analysed in soluble fractions of cheese by HPLC according to Bergamini et al. (Reference Bergamini, Hynes, Candioti and Zalazar2009). The HPLC system was the same for organic acids determination. The separation was carried out at 40°C using an Aquapore column (220 mm × 4.6 mm, OD-300 C18, 5 μm – 300 A°, 40°C, Perkin Elmer) at a flow rate of 1 ml/min with UV under an increasing linear gradient of acetonitrile in water in the presence of trifluoroacetic acid. The UV detector was set at 214 nm.
Statistical analysis
The results of the reduction of turbidity during the incubation as well as the results of cell culturability, cell physiological profile, LDH activity and β-GAL activity at the endpoint were analysed by means of the T test using InfoStat program and the correlation analysis with Spearman´s test using the R corrplot package (Wei and Simko, Reference Wei and Simko2021). The results of the cheese parameters were analysed in InfoStat by one-way ANOVA and Tukey's post-hoc (statistical significance assumed at P < 0.05). The peptide profiles were analysed in the statistical software R (www.r-project.org) by performing a principal components analysis (PCA) using the area of peaks. Finally, a PCA was carried out using the R Factoextra package (Kassambara and Mundt, Reference Kassambara and Mundt2020) to reveal the relationship between cheese samples (cheeses A, B, C and D) and cheese parameters (peptidase activities, peptide profiles, organic acids, microbiological counts).
Results and discussion
In vitro study
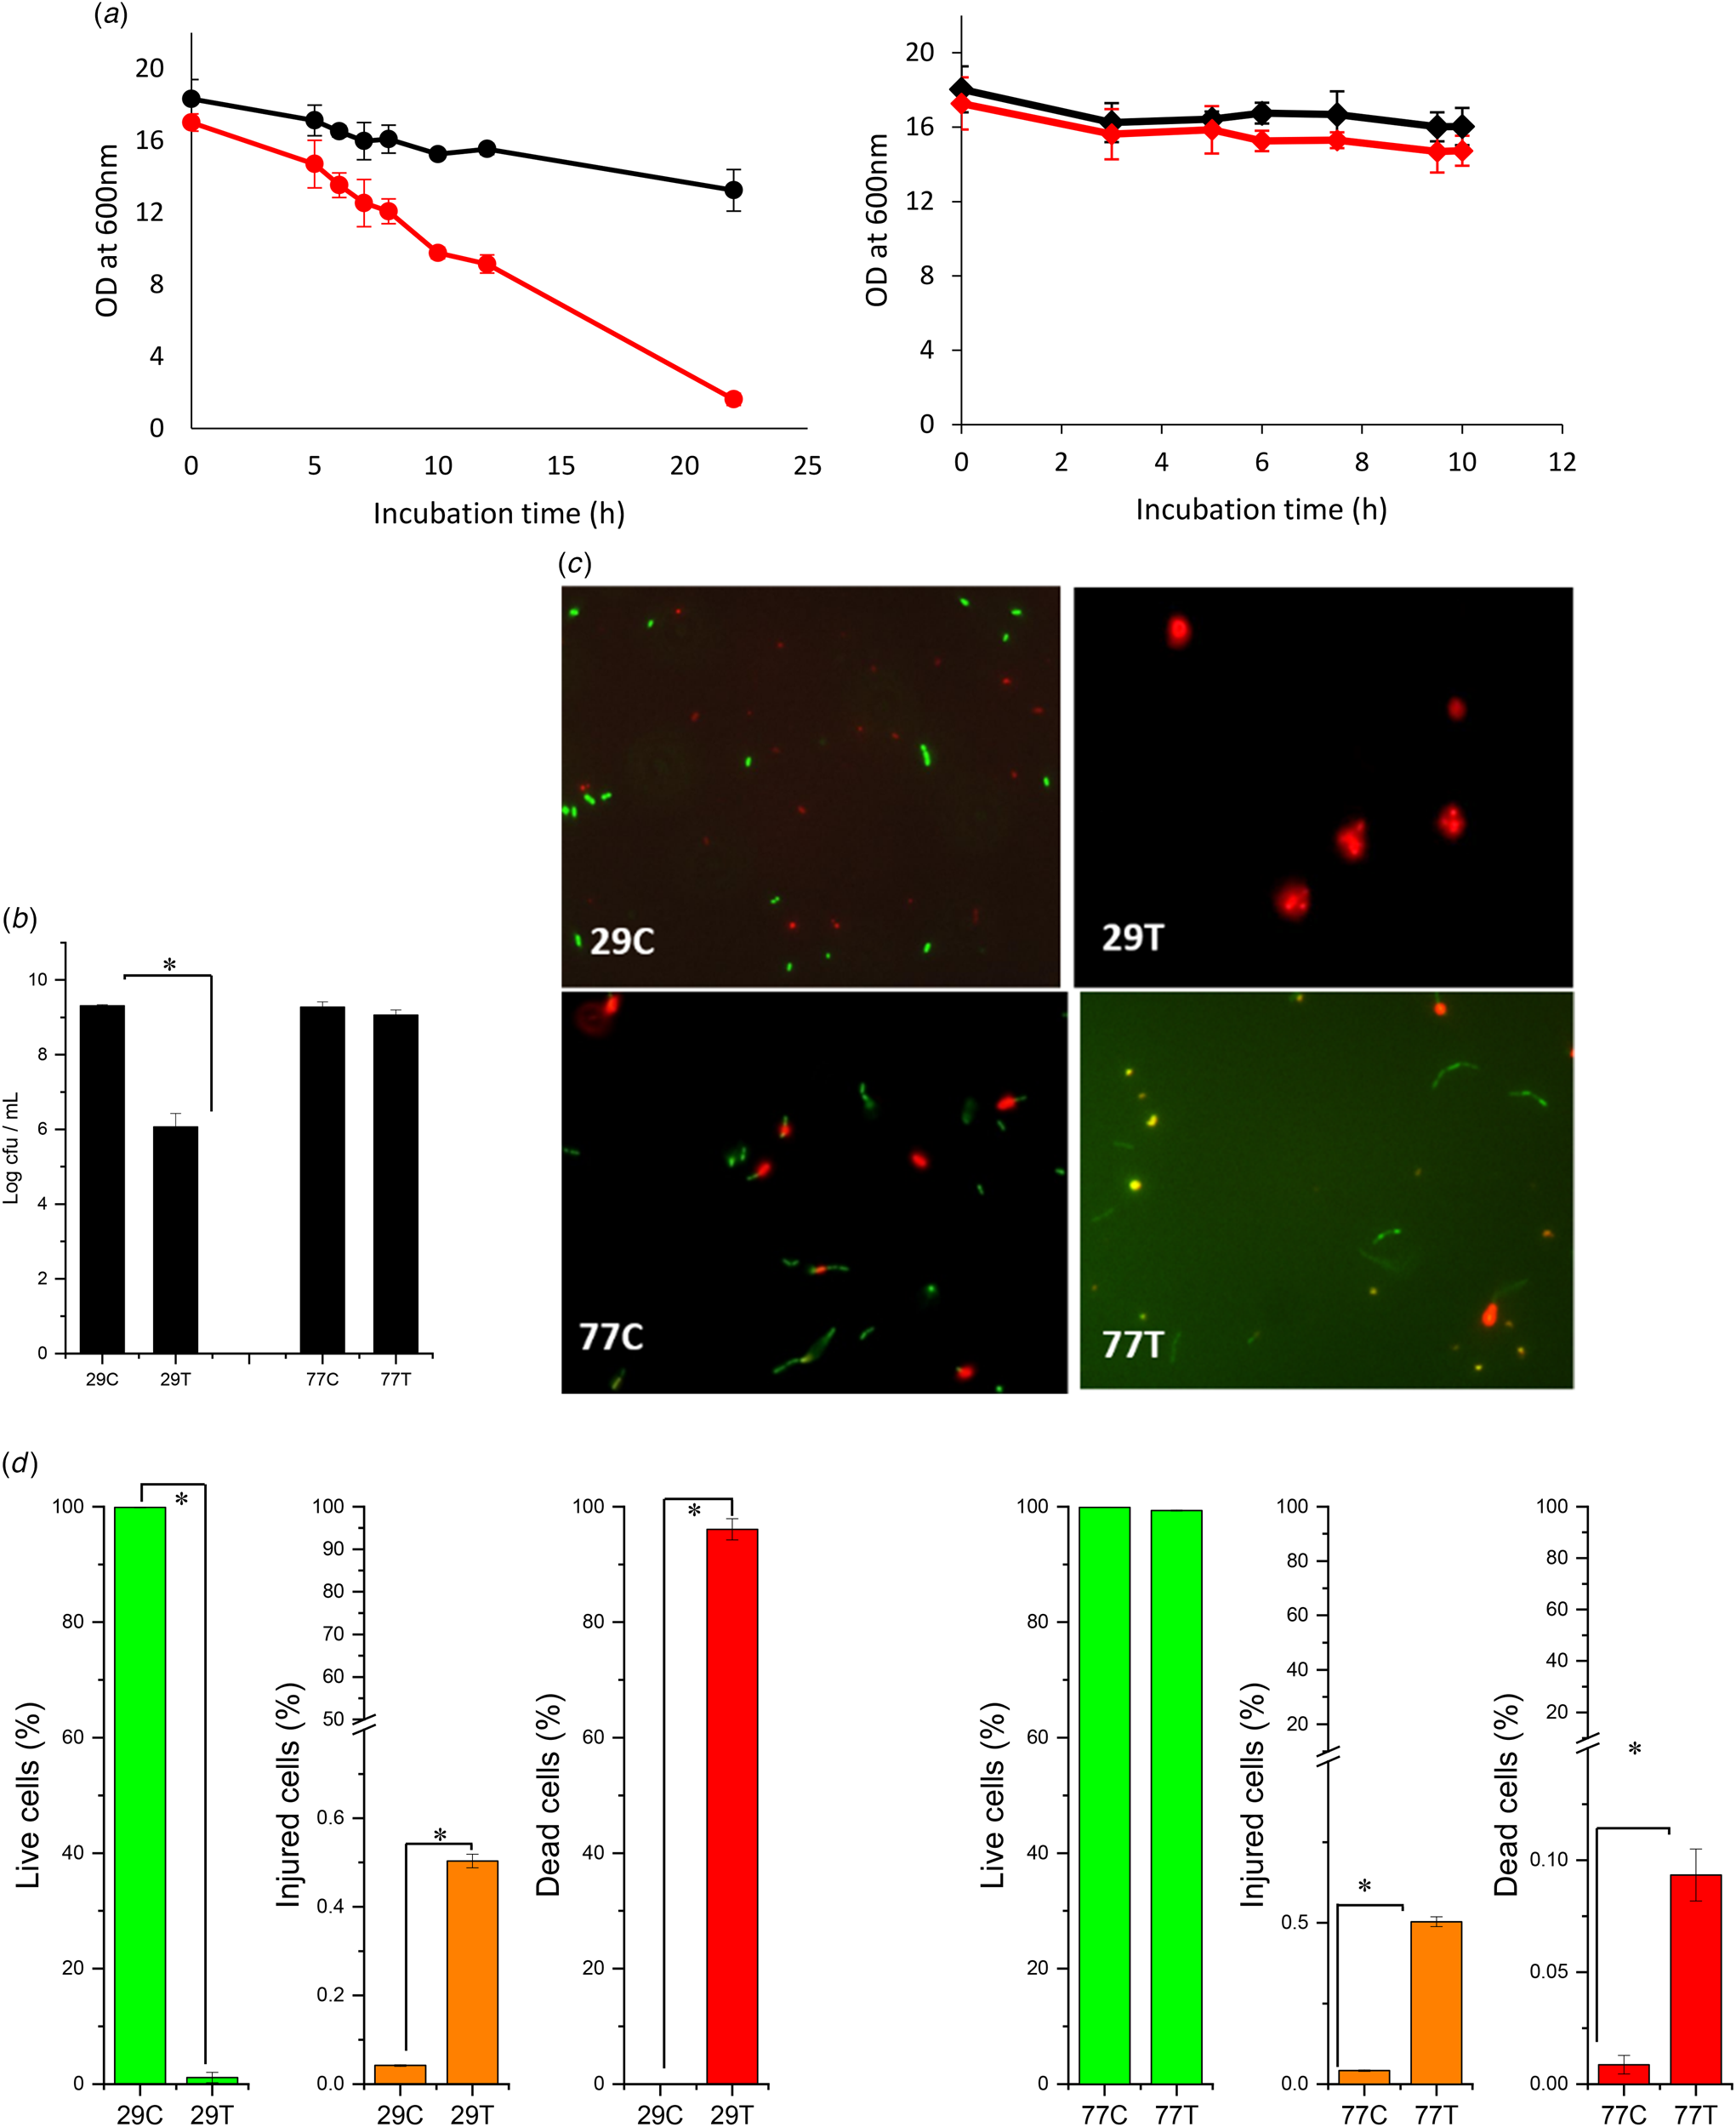
The measurements of optical density (OD) at 600 nm are shown in Fig. 1a. It is clearly seen that the reduction of the OD was considerably higher in 29T than in 29C, evidencing its high sensitivity to LZ. On the other hand, even though the reduction of the OD in 77T was higher than in 77C, its sensitivity to LZ was lower than it was for L29. The data of culturability (Fig. 1b) confirmed the higher effect of LZ on L29, showing a reduction of 3 log cfu/ml regarding the control.
Impact of LZ treatment (25 ppm) at 37°C for 22 h on L29 and L77 cell suspensions. a. Turbidity (optical density at 600 nm) during the incubation of the cell suspensions: 29C ( ), 29T (
 ), 77C (
 ), 77T (
 ). b. Culturability (log cfu ml−1) of the cells in MRS at the end of incubation; the asterisk (*) indicate significant differences (P < 0.05). c. Fluorescence microscopy images of cells (29C, 29 T, 77C, and 77 T) after incubation (live cells: green, dead cells: red). d. Physiological profile (%) of cells at the end of incubation analysed by FC; the asterisk (*) indicate significant differences (P < 0.05).

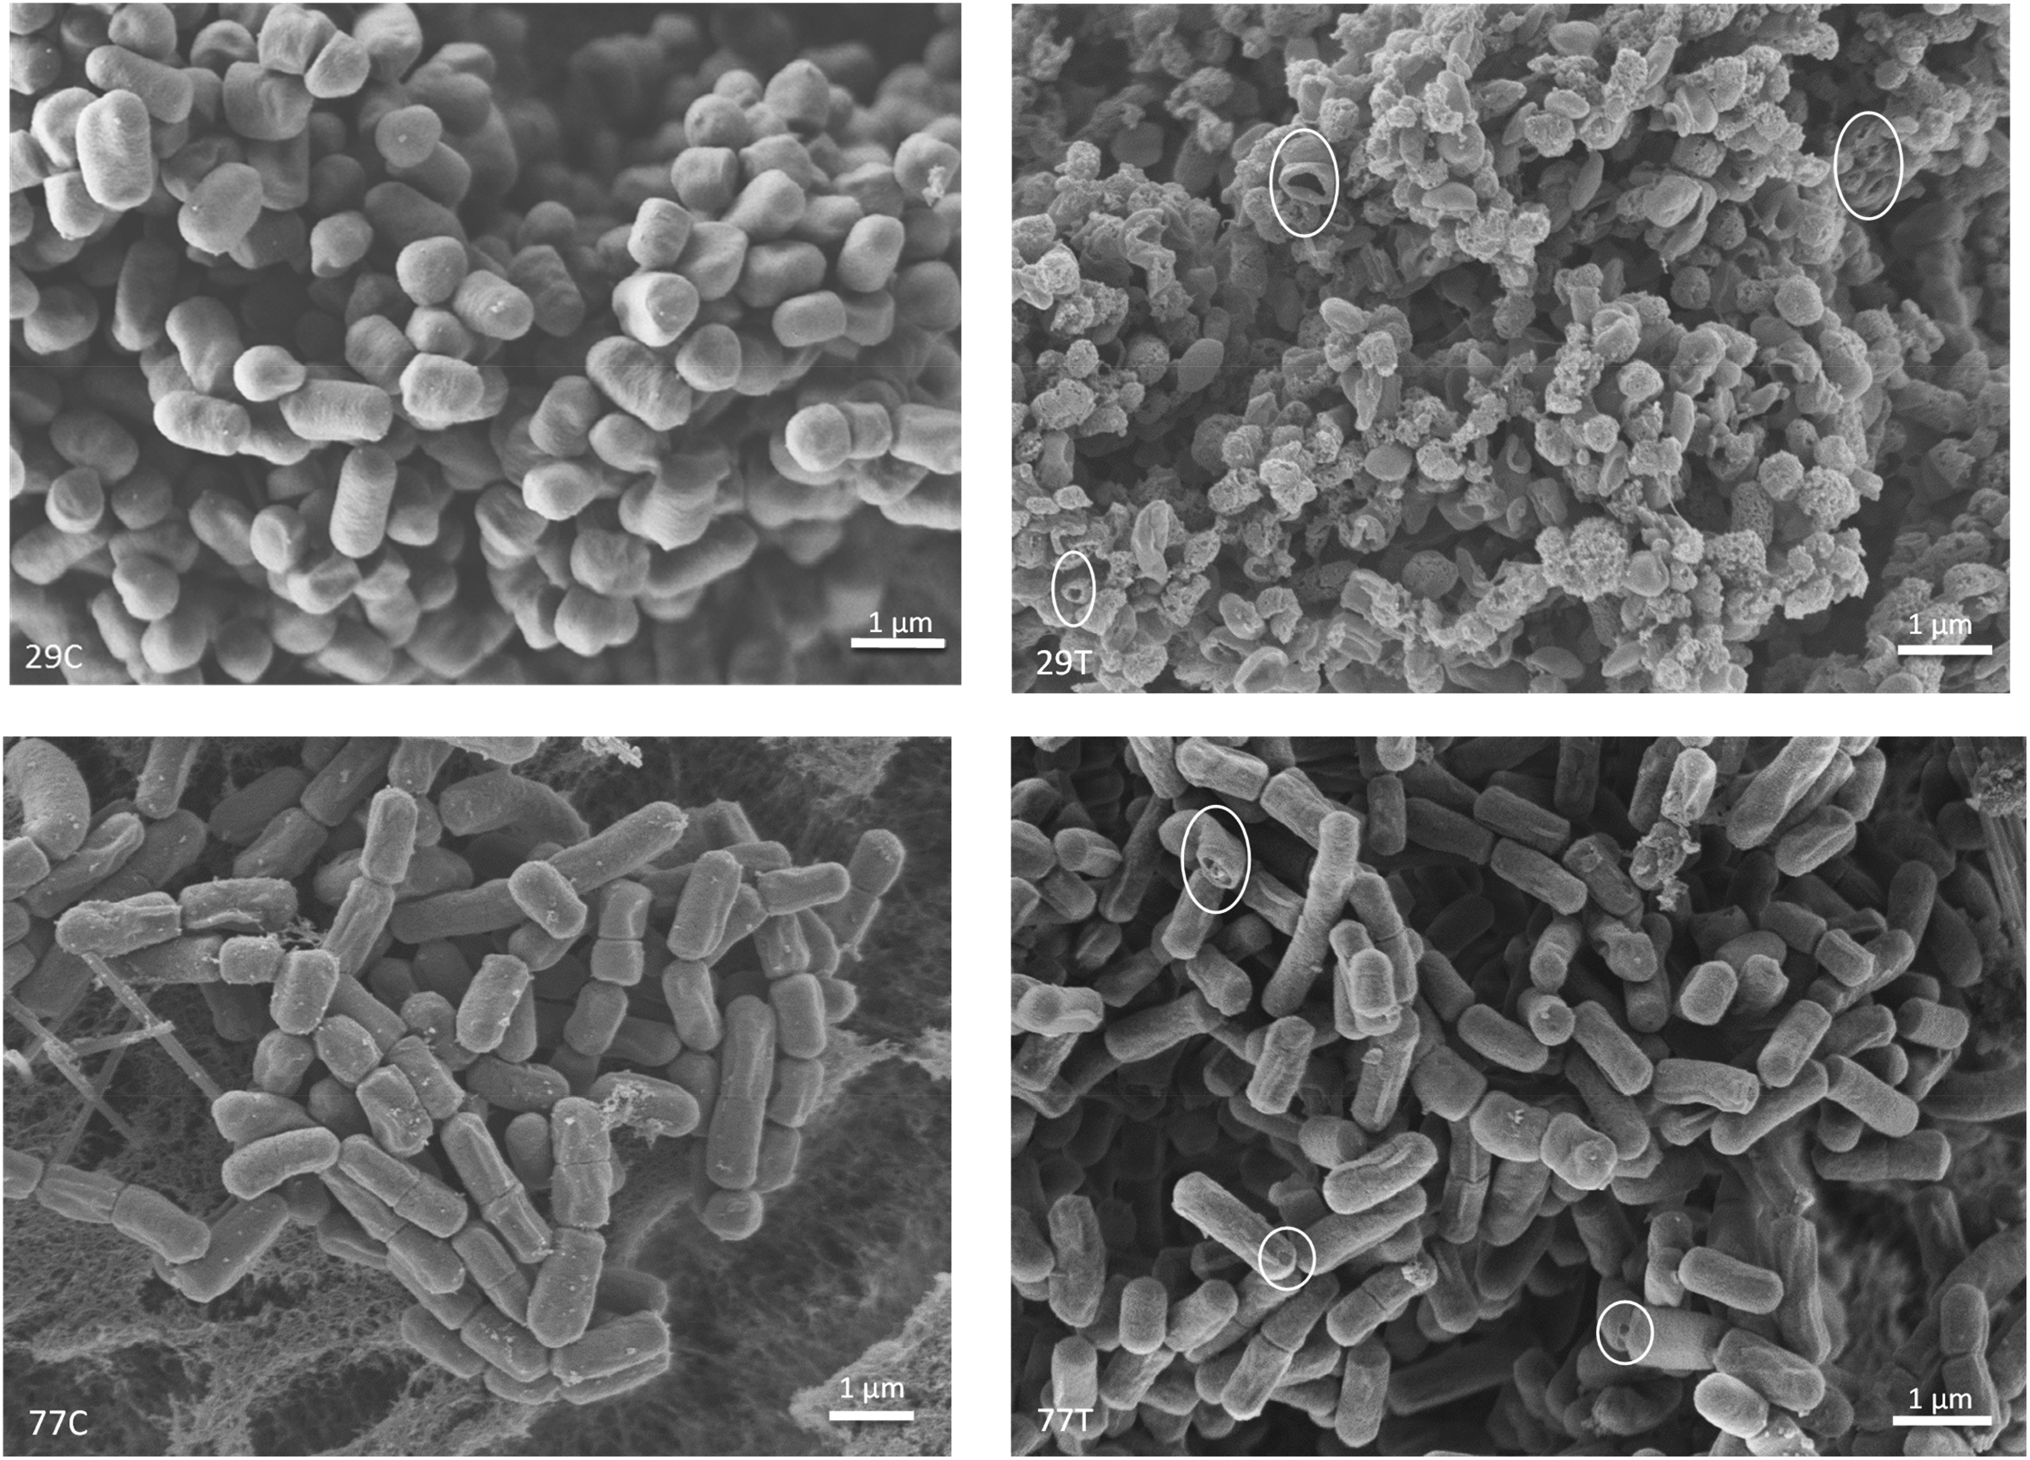
Fluorescence microscopy images of both treated and untreated cells are shown in Fig. 1c. As reflected in the micrographs, 77C, 77T and 29C showed both live (green) and dead (red) cells. Meanwhile, 29T only showed dead cells. In addition, the cell density was low in 29T due to the high levels of lysis. The percentages of the cell subpopulations (live, dead, and injured) analysed by FC (Fig. 1d) were in the same direction with the results of plate counts and OD. In accordance, the scanning electron microscopy images revealed the morphological and ultrastructural changes in both bacterial cultures upon exposure to lysozyme treatment (Fig. 2). L29 cells were, in control conditions, short rods (1.2 μm × 0.8 μm) with smooth surface. When exposed to lysozyme, 29T showed various degrees of cell wall fragmentation and collapse with complete and partial lysis. The resulting cell fragments observed in the images vary in size from 0.8 to 1 × 0.4 × 0.6 μm. We also detected many L29 cells in partial lysis stage showing the presence of extracellular vesicles, a phenomenon indicative of cellular stress response in the lactic acid bacteria (Bose et al., Reference Bose, Aggarwal, Singh and Acharya2020). These extracellular vesicles, often referred to as outer membrane vesicles (OMVs), are small, spherical structures budding from the bacterial cell membranes. They serve as a means for the stressed bacteria to release various cellular contents, including proteins, nucleic acids and other biomolecules, into the extracellular environment. This process of vesicle formation is part of the bacterial adaptation to environmental stress, and it can also function as a mechanism for intercellular communication (Bose et al., Reference Bose, Aggarwal, Singh and Acharya2020).
Scanning electron micrographs of cells (29C, 29T, 77C, and 77T) after incubation at 37°C for 22 h.

In contrast, the effect of lysozyme to L77 cells was less severe (Fig. 2). In control conditions, L77 were long rods with a longitudinal conspicuous raphe and various lengths (0.8–1.5 μm × 0.6 μm). When exposed to lysozyme, 77T cells exhibited less signs of deterioration than 29T; indeed, only in some cells were visible disruptions (holes), collapse and structural irregularities evident. Thus, L77 can be considered a resistant strain to the wall damage effect of the lysozyme treatment.
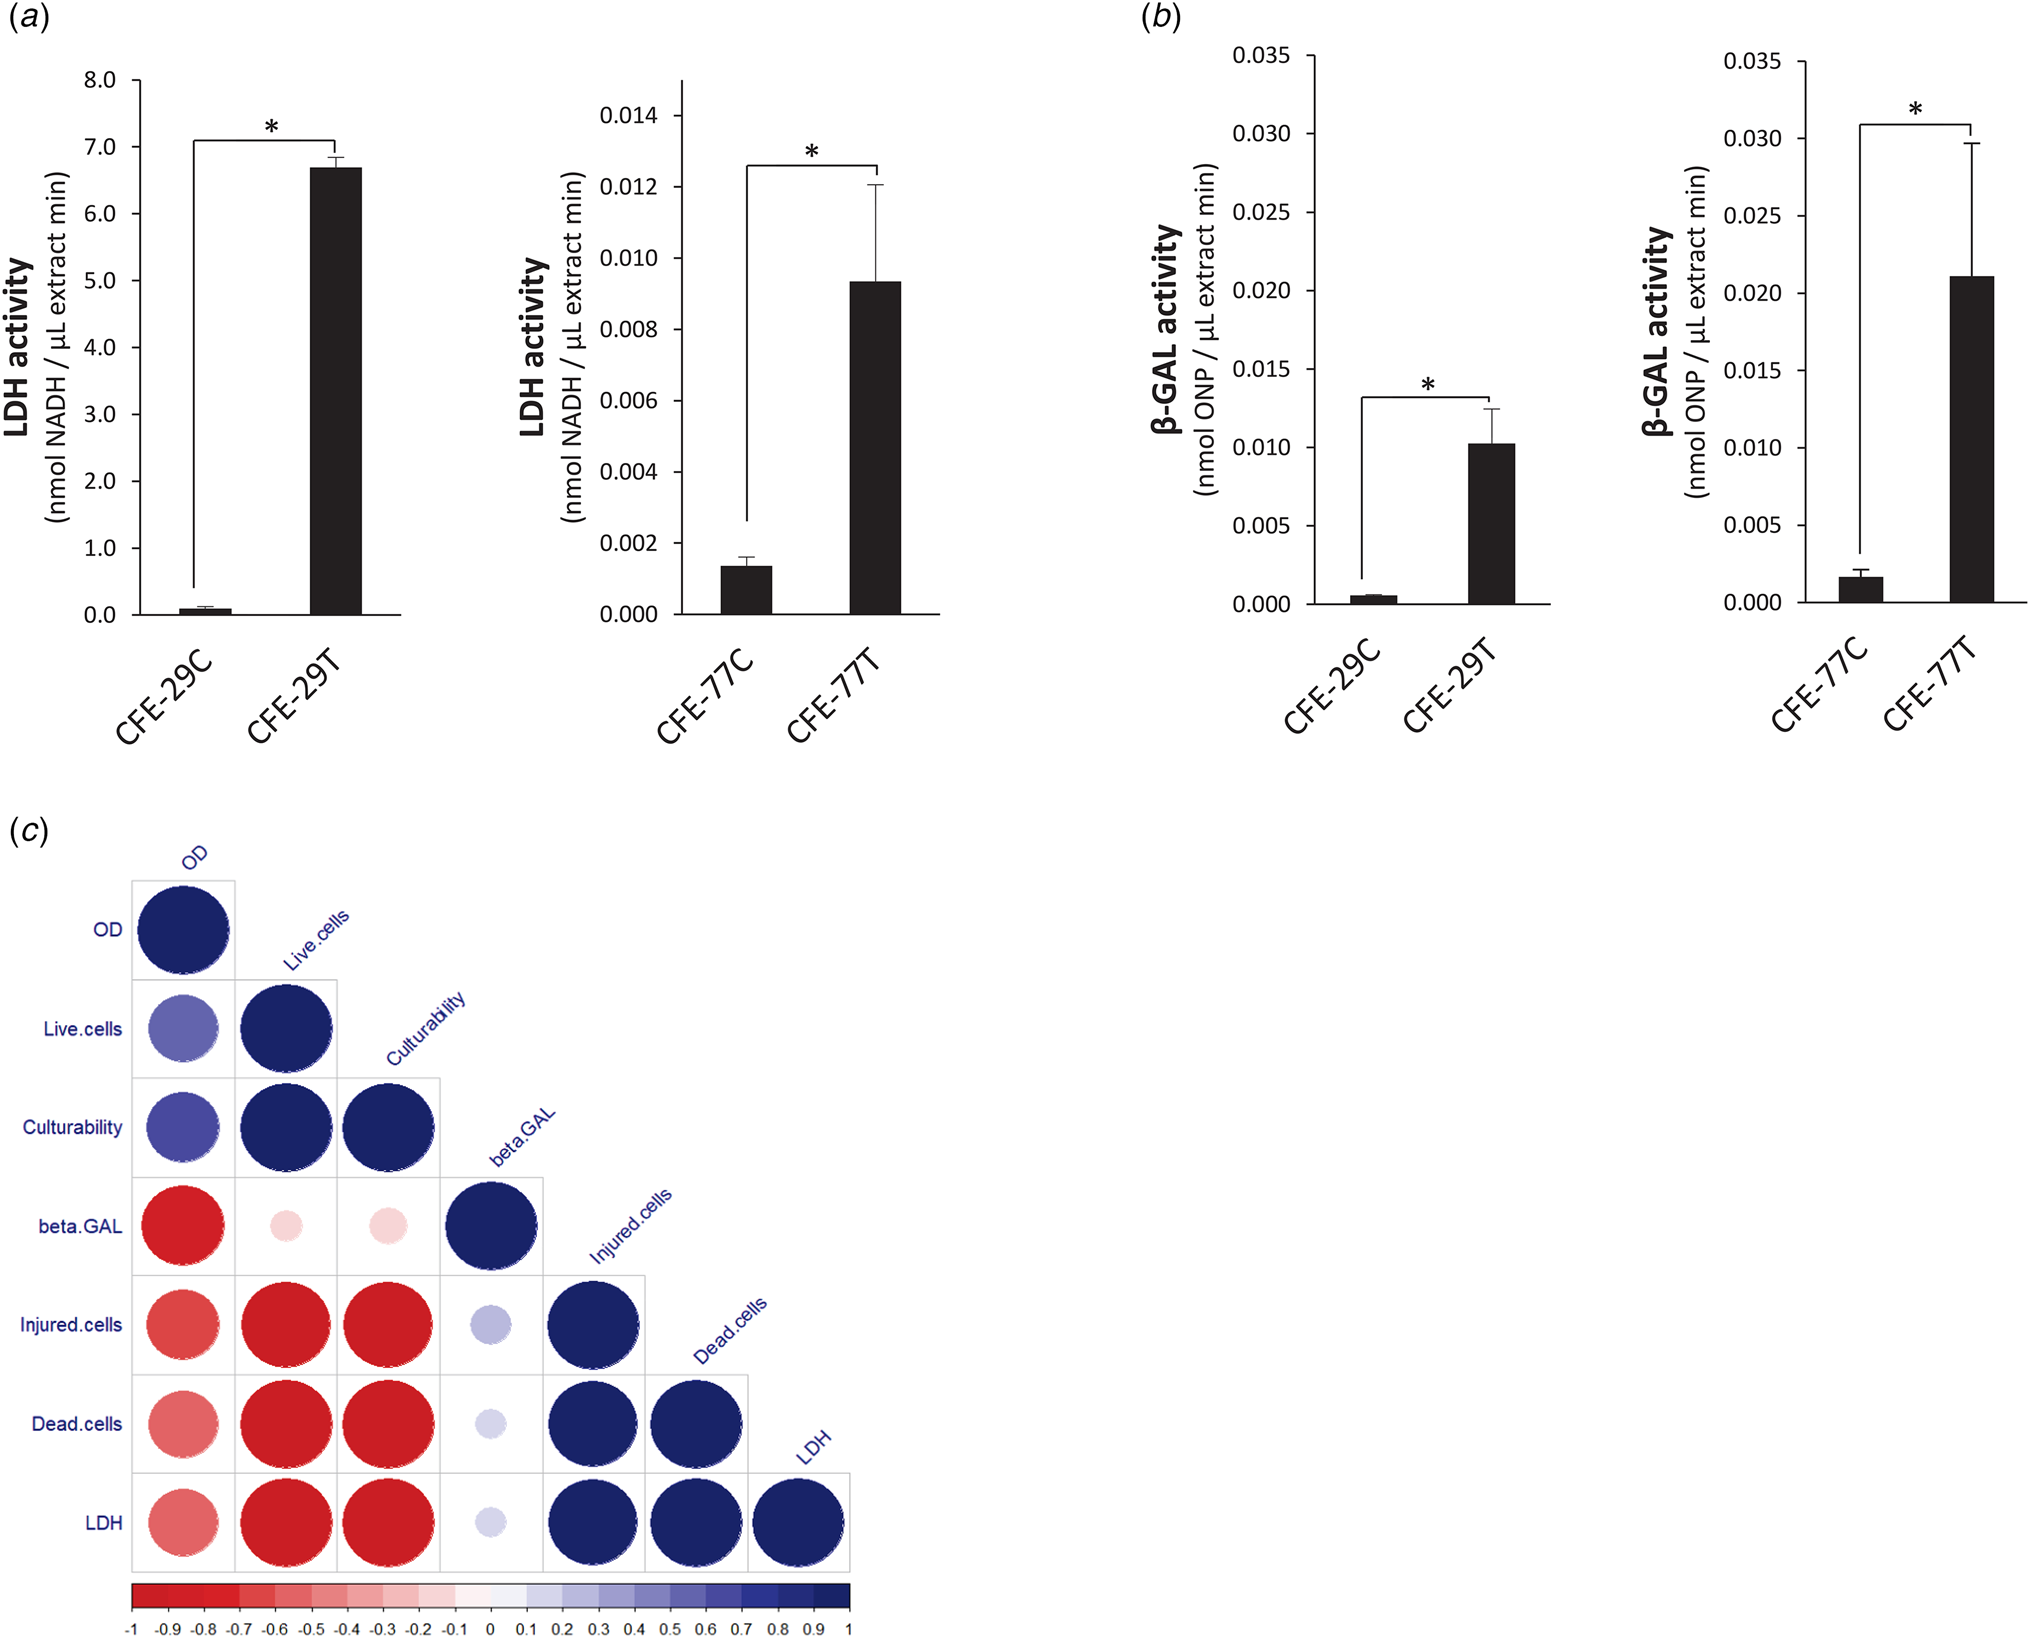
Two intracellular enzymes (LDH and β-GAL) were analysed in the cell-free extracts. According to Fig. 3a, both CFE-29T and CFE-77T showed high levels of LDH activity in comparison with their controls. In agreement with the above results, the levels for L29 were much higher than they were for L77. The levels of β-GAL also increased as a result of LZ treatment for L29 and L77 (Fig. 3b). LDH (EC 1.1.1.27) is a key enzyme in lactic acid bacteria that metabolizes pyruvate into lactic acid. This intracellular enzyme is commonly used as a marker for lysis (Wilkinson and LaPointe, Reference Wilkinson and LaPointe2020). β-GAL (EC 3.2.1.23) is also an intracellular enzyme that catalyses the hydrolysis of lactose into glucose and galactose, as well as catalysing transglycosylation reactions such as the synthesis of galacto-oligosaccharides (Ruiz-Ramírez and Jiménez-Flores, Reference Ruiz-Ramírez and Jiménez-Flores2023).
LDH (a) and β-GAL (b) activities of CFE from both untreated and treated cells with LZ of L29 and L77; the asterisk (*) indicate significant differences (P < 0.05). c. Spearman's rank correlation matrix among turbidity, culturability, physiological profiles, and intracellular enzymes.

The correlations between the studied variables are shown in the Fig. 3c. LDH and the dead and injured cells were positively correlated between them and negatively correlated with the live cells, culturability and DO. These last three variables were positively correlated between them.
Overall composition, pH, and minerals of cheeses
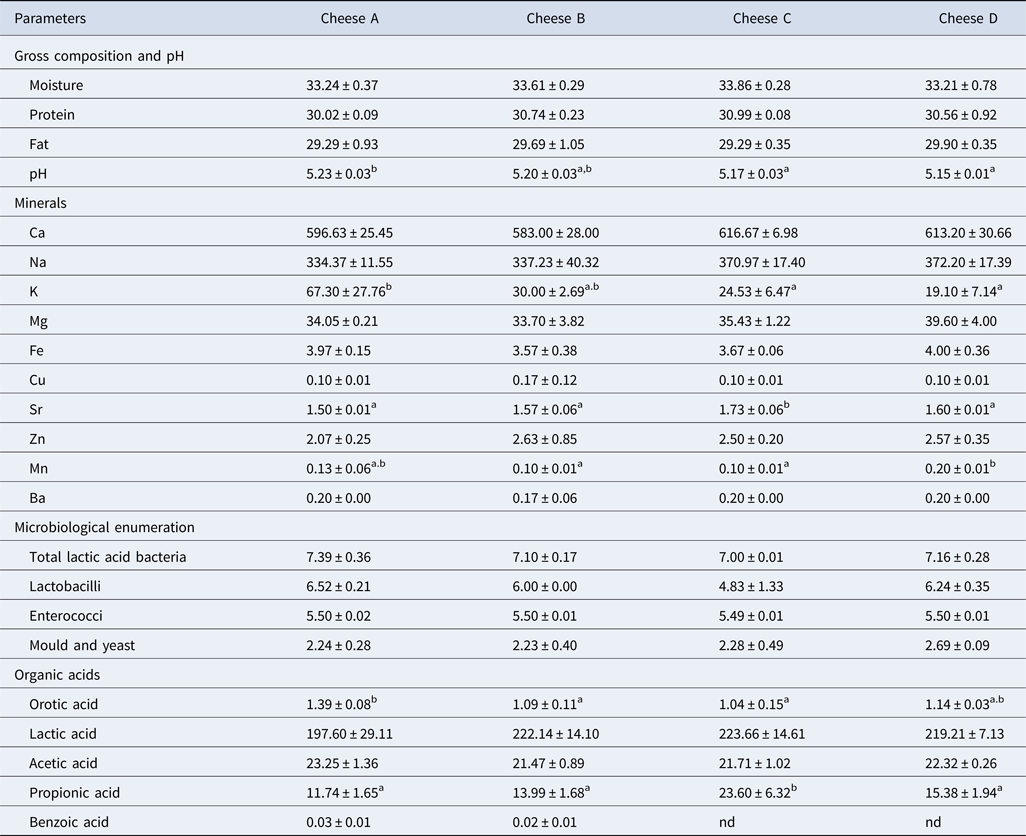
The gross composition, pH values, and minerals of the eight-month-old cheeses are summarized in Table 1. Statistical analysis of cheeses showed no significant differences among treatments for levels of moisture, protein and fat (all P > 0.05). pH values showed significant differences (P < 0.001) between treatments, however, the levels were very similar among samples, ranging between 5.23 and 5.15. These levels are similar to those reported previously for this cheese variety (Peralta et al., Reference Peralta, Beret, Bürgi, Ale, Martínez, Albarracín, Wolf and Bergamini2023b).
Gross composition (g/100 g cheese), pH values, minerals (mg/100 g cheese), microbiological enumeration (log cfu/ml) and organic acids levels (mM/kg) in cheeses at 8 months of ripening.

Values are means (± standard deviations) of three cheese replicates. Means within the same row not sharing common superscripts are different (P < 0.05). Cheese A: without ripening agent; cheese B: with L29 strain as ripening agent, cheese C: with L29 strain and LZ as ripening agent, cheese D: with CFE of L29 after treatment of LZ as ripening agent.
The concentration of coliforms, lactose, and galactose was below the detection limit.
The concentration of minerals showed significant differences among treatments for K, Sr and Mn (P < 0.01 or better). It is well known that bacteria require minerals for growth (Douglas and Beveridge, Reference Douglas and Beveridge2006; Huynh et al., Reference Huynh, Qiao, King, Trinh, Valdez, Haq and Zastrow2022). Thus, the L29 cells as well as the CFE of L29 added to milk could have influenced the minerals content in the cheeses. Furthermore, slight differences in curd draining due to small differences in pH values during the acidification could have affected the mineral equilibrium of cheeses before painting and vacuum packing. The remainder of the minerals did not show significant differences. To our knowledge, this is the first time that mineral composition has been determined in this type of miniature cheese.
Microbial enumeration and organic acids in cheeses
The results of microbial counts and organic acids are shown in Table 1. Statistical analysis of cheeses showed no significant difference (P > 0.05) among treatments for total LAB, lactobacilli (P = 0.07), enterococci and mould and yeast. Meanwhile, the level of coliforms in cheese was below the detection limit of the method. Lactobacilli counts did not show significant differences. It is interesting to underline that L29 colonies in cheeses B and C were easily distinguished in acidified MRS from the colonies in cheeses A and D (made without addition of L29) by colony morphology, colour and diameter. Lactobacilli in these last cheeses correspond to different NSLAB that grow during the ripening time. The differences of lactobacilli counts between cheese B and C could be related to the LZ activity on the L29 during the ripening. The levels found in MPCA agar were about 2 log lower in comparison with the levels previously reported by Peralta et al. (Reference Peralta, Aguirre, Bürgi, Martínez, Albarracín, Menzella, Pozza, Hynes and Bergamini2023a, Reference Peralta, Beret, Bürgi, Ale, Martínez, Albarracín, Wolf and Bergamini2023b); differences that could be related to the ripening time. In these previous studies, the cheeses were ripened for 120 d, while in this study cheeses were maturated for eight months. It is well known that the levels of starter culture gradually decline during a long ripening process due to no available lactose and galactose, acid and salted environment, as well as low ripening temperature (Broadbent, Reference Broadbent2022). The results for coliform, enterococci, mould and yeast were similar in magnitude to previous report in this type of cheese Peralta et al. (Reference Peralta, Beret, Bürgi, Ale, Martínez, Albarracín, Wolf and Bergamini2023b).
No significant difference was observed between cheeses for the concentration of lactic acid and acetic acid (Table 1). On the other hand, significant differences were observed for the concentration of orotic acid and propionic acid. The levels of orotic acid were lower in cheeses B and C in comparison to cheese A, indicating probably that L29 consumed this acid. Regarding propionic acid, it was higher in cheese C, reflecting that the addition of LZ influenced the metabolic pathways of L29. Also, the production of benzoic acid from hippuric acid was modified by treatments because it only was detected in A and B cheeses. In relation to the concentration of carbohydrates, neither lactose nor galactose was quantified because they were below the detection limit of the method in all the samples. When a cheese is maturated for several months at temperatures between 10 and 12°C as in the present study, it is expected that both lactose and galactose would be fully used as an energy source by the cheese microbiota (McMahon et al., Reference McMahon, Sorensen, Domek, Dai, Sharma, Oberg and Oberg2022). This means that the four cheeses could be consumed by lactose-intolerant and galactosemic individuals (Vitoria et al., Reference Vitoria, Melendreras, Vázquez-Palazón, Rausell, Correcher, González-Lamuño and García-Peris2023).
Peptidase activities and peptide profiling
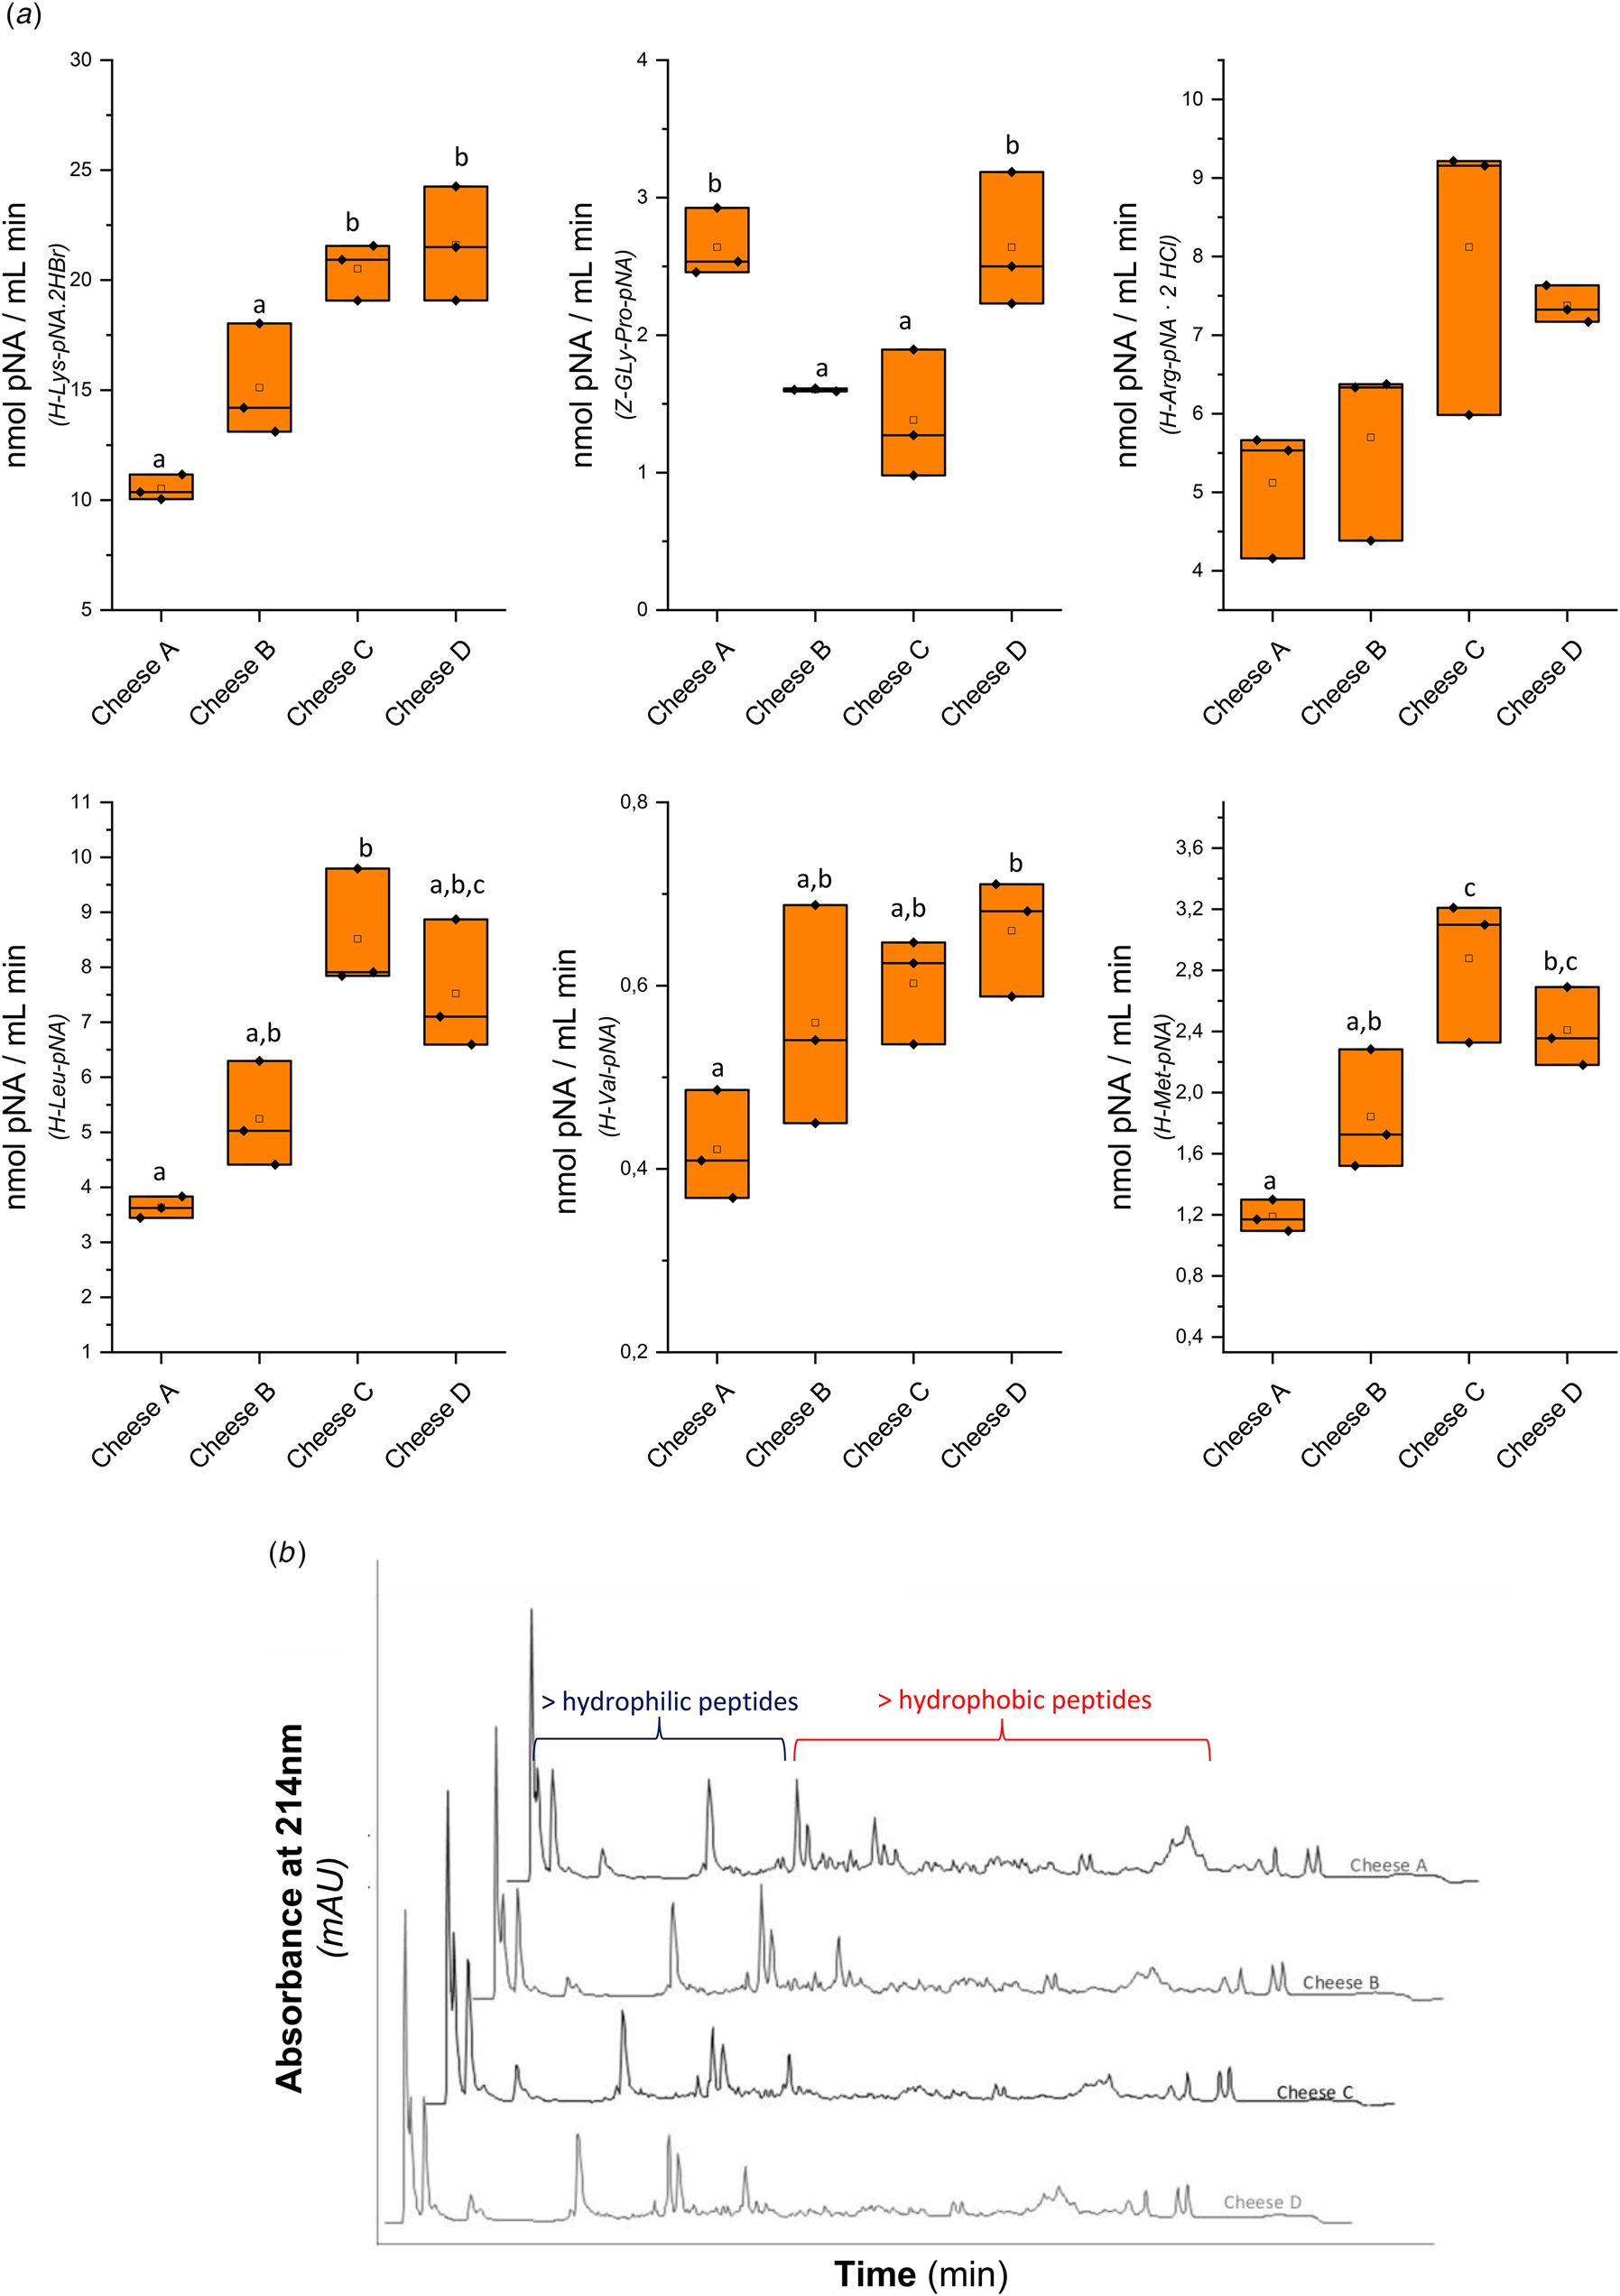
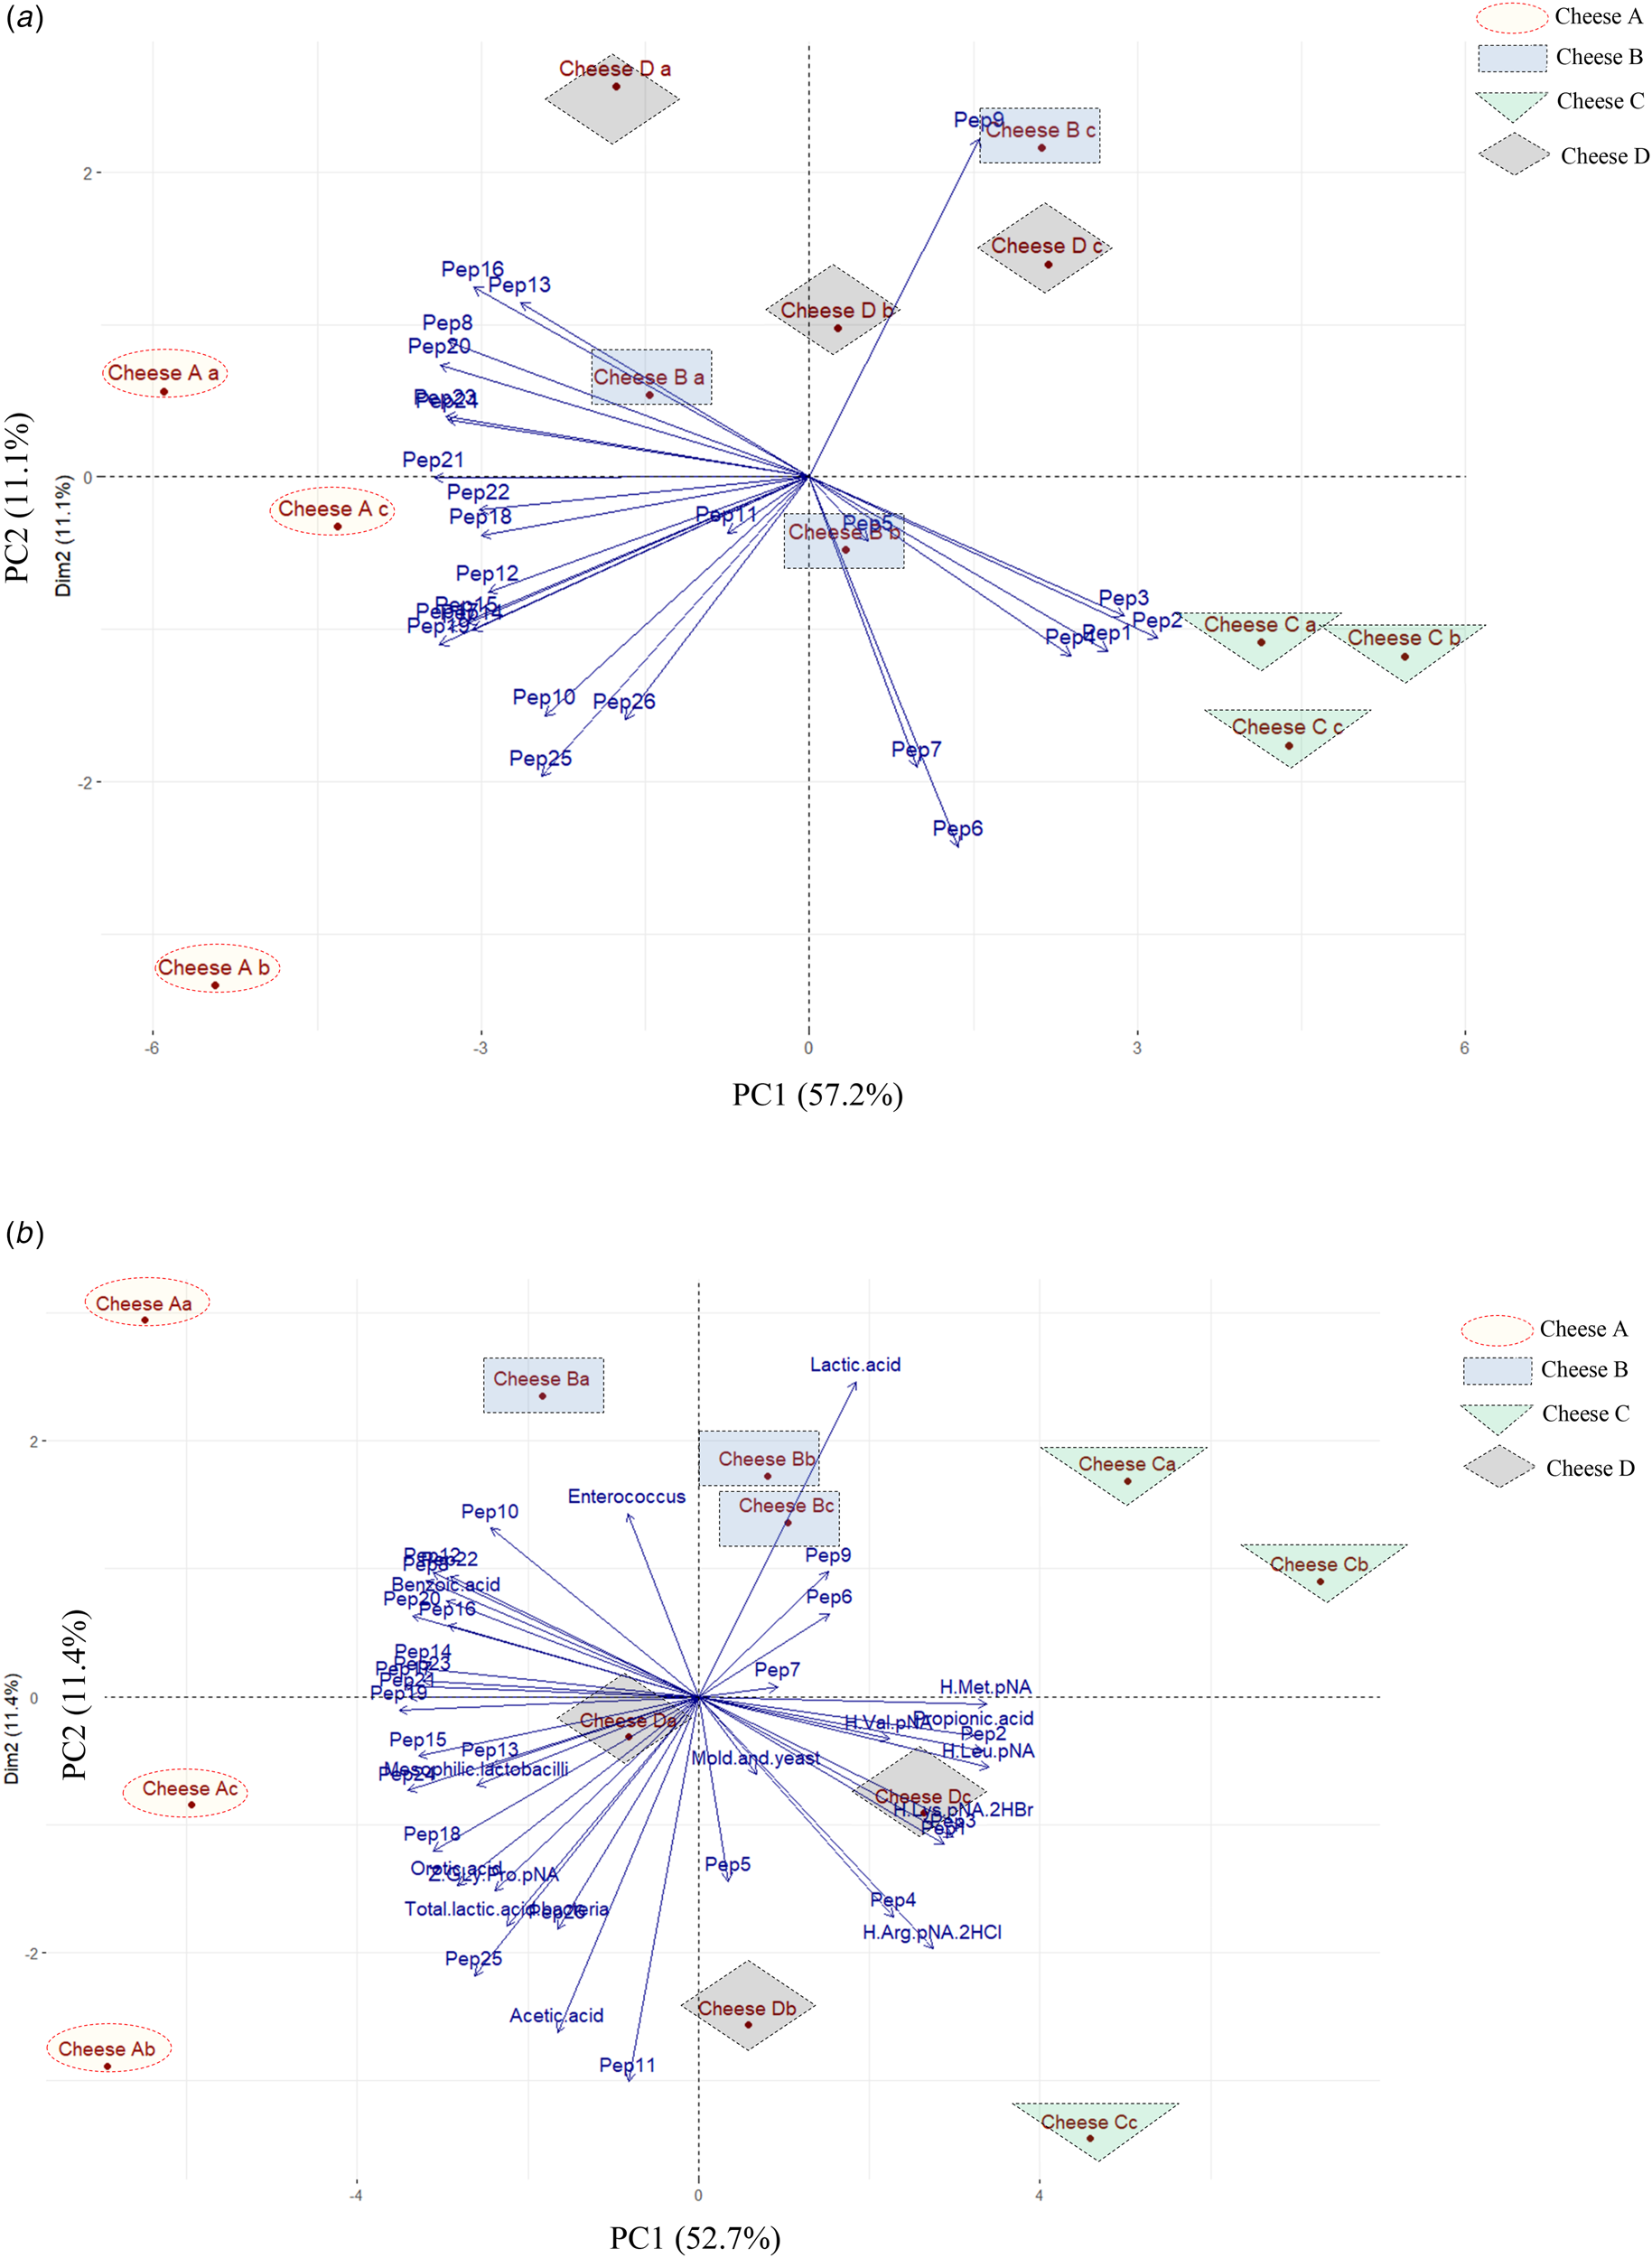
The results of the peptidase activities are shown in Fig. 4a. Three of the six studied peptidases in the cheese matrix were significantly boosted by adding LZ and L29 together to the cheesemilk. These results suggest that L29 was successfully lysed in the cheese matrix due to the presence of LZ. In addition, the incorporation of the CFE of L29 also increased the activities of three of the studied peptidases. All these results are in agreement with those obtained in the in vitro study where a release of intracellular enzymes was detected for L29 after the LZ treatment. On the contrary, the addition of L29 alone did not increase the peptidase activities in cheese B relative to cheese A. Furthermore, it is clear to see in the peptide profiles peaks with different heights and areas among the four types of cheeses (Fig. 4b). The PCA biplot of the peak areas of peptide profiles is shown in Fig. 5a. PC1 and PC2 explained 57.2 and 11.1% of variance, respectively. The three replicates of cheese A were grouped in the negative side of PC1 and were associated with lately eluted peaks (peptides from 10 to 26). On the other hand, the three replicates of cheese C were grouped in the positive side of PC1 and associated with early eluted peaks (peptides from 1 to 7, and pep 9). The replicates of B and D cheeses were generally grouped in the positive side of PC2, and were mainly associated with pep 9, pep 13, and pep 16. In the chromatographic condition that we employed, early eluted peaks correspond to hydrophilic peptides. By contrast, peptides with hydrophobic residues, that are associated with bitter taste, are eluted late (Fox, Reference Fox, Kelly and Larsen2021). These bitter peptides are characterized by the presence of leucine, isoleucine, phenylalanine, tyrosine, valine, proline and tryptophan (Erbay et al., Reference Erbay, Salum, Kilcawley, Kelly and Larsen2021). Considering that in general hydrophilic peptides are increased and hydrophobic peptides are reduced during the ripening process (Kuhfeld et al., Reference Kuhfeld, Eshpari, Atamer and Dallas2023), the changes observed for the use of L29 in combination with LZ suggest an improvement of the cheese ripening process. Furthermore, it suggests that the ripening time could be shortened, which could hold economic significance for dairy industries. However, further studies must be conducted to confirm the efficacy of this ripening agent in shortening the ripening time. PCA of peptidase activities, peptide profiling, microbial counts and organic acids was performed to find statistical relationships between them. PC1 and PC2 explained 52.7 and 11.4% of the variance, respectively. From the PCA biplot, it is obvious that L29 cells and L29 cells together with LZ and CFE-29T as ripening agents modified the cheese parameters, resulting in a clear differentiation of the four types of cheese (Fig. 5b).
(a) Peptidase activities of cheese extracts against six chromogenic substrates: H-Lys-pNA.2HBr ( ), Z-Gly-Pro-pNA (
 ), H-Arg-pNA.2HCl (
 ), H-Leu-pNA (
 ), H-Val-pNA (
 ), and H-Met-pNA (
 ). (b) Peptide profiles of cheeses. Cheese A: without ripening agent; Cheese B: with L29 strain as ripening agent, Cheese C: with L29 strain and LZ as ripening agent, Cheese D: with CFE of L29 after treatment of LZ as ripening agent.

(a) Biplot of the principal component analysis for peptide profiles. (b) Biplot of the principal component analysis for microbiologic counts, peptidase activities, organic acids and peptide profiles. Cheese A: without ripening agent; Cheese B: with L29 strain as ripening agent, Cheese C: with L29 strain and LZ as ripening agent, Cheese D: with CFE of L29 after treatment of LZ as ripening agent. The letters a, b, and c in the name of cheeses indicate the different replicates.

In conclusion, this study validated the use of LZ in combination with L29 as a ripening agent in a mature cheese. Several lysis indexes indicated that the in vitro LZ treatment was a suitable method for lysing L29 cells but not for L77 cells. The differences in the levels of peptidases and lactobacillus in cheeses suggest that L29 cells were also lysed by LZ in the cheese matrix during the ripening, impacting positively as an increase in proteolysis. Further development of this approach is warranted. Other strains with high-level of sensitivity to LZ and with other intracellular enzyme profiles could be selected for specific aims in the future, such as producing specific volatile compounds or bioactive peptides.
Supplementary material
The supplementary material for this article can be found at https://doi.org/10.1017/S0022029925000184
Acknowledgement
This work was financed by the Agencia Santafesina de Ciencia, Tecnología e Innovación de la Provincia de Santa Fe-ASaCTeI (IO-2017-00036; PEICID-2022-037) and the Agencia Nacional de Promoción Científica y Tecnológica-ANPCyT (PICT-2018-01334; PICT-2019-01633).