INTRODUCTION
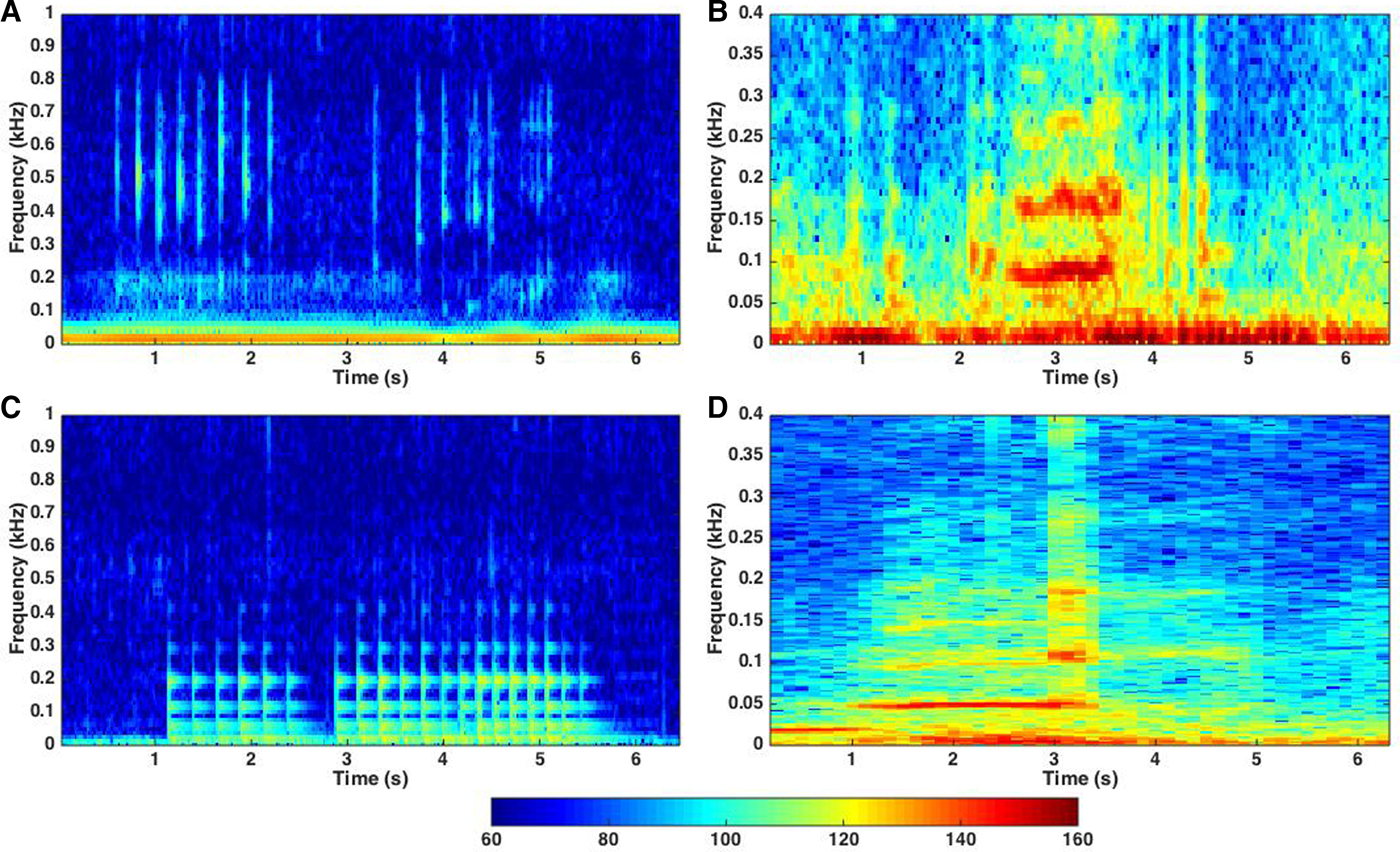
The sounds of the Eastern North Pacific grey whale (Eschrichtius robustus) have been the subject of acoustic studies in their breeding areas (Dahlheim, Reference Dahlheim1987; Wisdom, Reference Wisdom2000; Ollervides & Rohrkasse, Reference Ollervides, Rohrkasse, Funes-Rodriguez, Gomez Gutierrez and Palomares-García2007), along their migration route (Crane & Lashkari, Reference Crane and Lashkari1996), and in their northern feeding grounds (Moore & Ljungblad, Reference Moore, Ljungblad, Jones, Swartz and Leatherwood1984; Stafford et al., Reference Stafford, Moore, Spillane and Wiggins2007). The initial study of breeding ground sounds was performed by Dahlheim (Reference Dahlheim1987), who defined an acoustic repertoire of at least six call types produced during breeding and reproduction behaviours in Laguna San Ignacio (LSI), Baja California Sur, Mexico. Dahlheim (Reference Dahlheim1987) collected data from a bottom-mounted hydrophone system in 8 m depth water, with the hydrophone suspended 3 m from the ocean floor, placing the hydrophone near the middle of the water column. All six calls classified by Dahlheim had relatively low bandwidth, ranging between 50 to 2000 Hz. The most common sound detected was the S1 call, which consists of several pulses (mean 9.4) that lie between 90 and 1940 Hz, with a mean pulse rate of 5.9 per second (Figure 1A; Dahlheim, Reference Dahlheim1987). Another common call detected by Dahlheim (Reference Dahlheim1987) was the S3 call, a frequency-modulated sweep between 125 and 1250 Hz, with a mean call duration of 2 s (Figure 1B).
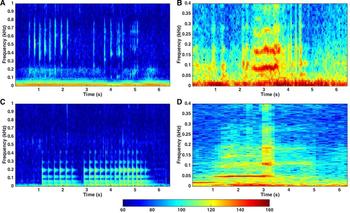
(colour online): Spectrogram examples (in units of power spectral density, dB re 1 uPa2 Hz−1) of the four most common grey whale call types detected on the acoustic tags: previously known call types (A) S1 and (B) S3; and the new call types (C) S8 and (D) S9. Note the frequency highlights on the pulses visible in subplot (c). The 0.2 s-long sound starting at 3 s in subplot (d) is a different call from S9. Subplots (a), (b), and (c) use 512 pt FFT, 75% overlap, on data sampled at 6.25 kHz, while (d) uses an FFT size of 2048.
Wisdom (Reference Wisdom2000) studied the developmental process of sound production in grey whales, by recording sounds from a captive grey whale calf, JJ, and using boat-based recordings at LSI. In addition to the six calls described by Dahlheim (Reference Dahlheim1987), Wisdom also identified a new call, Type 1a. Ollervides & Rohrkasse (Reference Ollervides, Rohrkasse, Funes-Rodriguez, Gomez Gutierrez and Palomares-García2007) proposed 11 call categories based on recording sessions from a boat, while studying the ambient noise environment in Bahia Magdalena, another important reproduction and breeding area for the grey whale on the Pacific coast of Baja California Sur, Mexico. Six of their proposed call types were the same as Dahlheim (Reference Dahlheim1987); the five additional calls reported are not related to the sounds discussed in this paper, as these calls were not present in the recordings reported here.
For all these studies the S1 call was the most abundant, followed by the S4 call (Dahlheim, Reference Dahlheim1987; Wisdom, Reference Wisdom2000; Ollervides & Rohrkasse, Reference Ollervides, Rohrkasse, Funes-Rodriguez, Gomez Gutierrez and Palomares-García2007). A more recent study found that grey whales emitted more S1 calls around dawn and twilight hours, in contrast to mid-morning and mid-afternoon hours (Ponce et al., Reference Ponce, Thode, Guerra, Urban and Swartz2012). At present there is no consensus about the function or behavioural context of any grey whale call type.
In this paper we report two new call types recorded on bioacoustic tags deployed over three winter seasons in the lagoon, and discuss possible differences in call repertoires between two subgroups of grey whales: solitary males and females, typically associated with breeding activities, and mother/calf pairs.
MATERIALS AND METHODS
Equipment, deployment procedure and analysis
Recordings were made using a ‘Bio-Probe’ acoustic sampling tag (Burgess et al., Reference Burgess, Tyack, Boeuf and Costa1998), which incorporates a hydrophone with a sensitivity of 172 dB re 1 µPa V−1, a pressure transducer, a two-axis accelerometer and a temperature sensor. Data from the depth gauge and accelerometers were sampled at 1 Hz, while acoustic data were sampled at 6553 Hz in 2008 and 4096 Hz in 2009 and 2010. All data were stored within the tag, which in turn was incorporated into a syntactic float assembly that included one suction cup for part of 2008 and two suction cups in the rest of 2008, and all of 2009 and 2010. An Advanced Telemetry Systems (ATS) VHF radio beacon was also incorporated into the float. The entire assembly was positively buoyant so that when the tag detached from an animal, it would float to the surface and hold the transmitter vertically above the water. The tags were deployed from a small boat with an outboard engine, using an experienced local fisherman as a driver and an eco-tour guide. Before tagging was attempted, a whale was followed for 40–60 min; once it was confirmed that the animal was not attempting to evade the vessel, and otherwise showed no behavioural signs of stress, the boat would drive parallel to the whale's course, approach as the animal was surfacing, and place the tag on the dorsal section of the whale's body using a modified 2 m telescoping boat hook. Occasionally ‘friendly’ whales (i.e. whales that demonstrate curiosity about whale-watching boats) would approach the vessel, and the tag could be placed on the animal by hand.
Only one whale was tagged at a time, and that animal was followed for as long as possible. The boat would typically linger 100–300 m away from the animal, and whenever possible, the engine was turned off to avoid engine noise on the acoustic recordings. Whenever feasible whale GPS locations were logged by manoeuvring the boat over ‘flukeprints’ of the diving whale. The tag was tracked using a Yagi antenna and an ATS R410 receiver. Trackers often used the presence of the radio beacon to identify the surfacing whale. Bottom-mounted autonomous recorders sampling at 6.25 kHz were also deployed at 10 m depth near Punta Piedra, a local landmark in the lower lagoon, for 3 weeks at a time during all 3 years (Ponce et al., Reference Ponce, Thode, Guerra, Urban and Swartz2012). Tags were generally applied within 4 km of the Punta Piedra site. Photo-ID shots were collected from each tagged whale, and the presence/absence of a calf was also noted. The tagged animal was then assigned to a ‘solitary’ or ‘mother/calf’ demographic class. Useable tag durations ranged from 15 min to over 6 h.
Custom-made bottom-mounted autonomous recorders sampling at 6.25 kHz were also deployed at 10 m depth, with the hydrophone suspended just above the bottom, for 3 weeks between 2 February and 9 March 2008 near Punta Piedra, a local landmark in the lower lagoon where Dahlheim (Reference Dahlheim1987) collected her data (Ponce et al., Reference Ponce, Thode, Guerra, Urban and Swartz2012). This latter reference provides more details on the recorder design and deployment.
A MATLAB routine was used to generate spectrograms of acoustic data collected on the tags, using a 256-point Hanning-windowed FFT with 50% overlap. The data were manually reviewed over a 10 s window between 50 and 1050 Hz. Whenever a call was identified, the analyst (first-author) drew a ‘bounding box’ in the spectrogram, and then classified the call using the repertoires by Dahlheim (Reference Dahlheim1987) and Wisdom (Reference Wisdom2000). A call was first classified as pulsive or tonal. If the call was a pulsed call, the number of pulses and pulse rate were also logged. If two sets of pulses were separated by less than 1 s, they were classified as part of the same call. For all calls detected, the minimum and maximum frequency, call duration, and maximum power spectral density of the call were derived automatically from the bounding box selections. Calls with a signal plus noise-to-noise ratio of 8 dB or less, as derived using a noise sample collected 1 s before the start of a call, were rejected from analysis.
The frequency range and pulse rate were used to classify pulsed calls, while frequency range, duration and FM bandwidth were used to classify tonal calls.
RESULTS
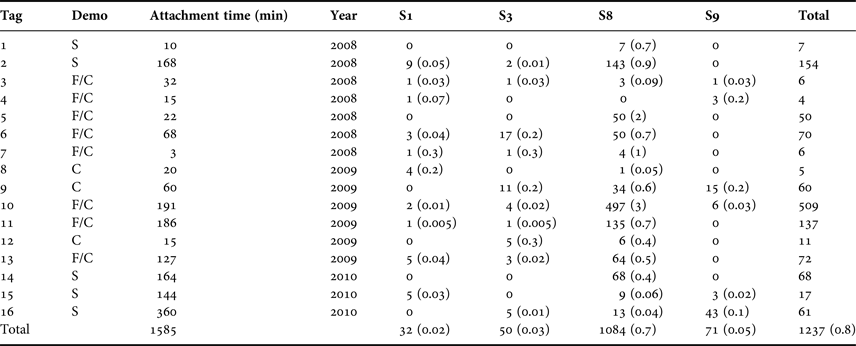
During the winters of 2008, 2009 and 2010, 27 tags were deployed, which generated a total of 2163 min of recordings. Sixteen of those tags contained sounds; analysis of 1585 min of those data yielded a total of 1237 whale calls (Table 1). Table 2 shows both the type and number of calls detected on each tag deployment.
Calls detected for each grey whale demographic group. 27 tags were deployed with 2163 min total, but only 16 tags contained sounds.

Call breakdown by tag.

F/C, female with calf; S, single animal; C, calf. Numbers in parentheses are calls per minute.
Four consistent call types were identified across all years (see Figure 1). Two of the call types matched Dahlheim's (Reference Dahlheim1987) description of the pulsed S1 call (e.g. Figure 1A) and frequency-modulated S3 call (e.g. Figure 1B), so that terminology is used here. In this study the S1 call presented bandwidths between 65 ± 58 and 546 ± 516 Hz, and a call duration of 3.38 ± 1.8 s, while the S3 call presented a bandwidth between 58 ± 38 and 437 ± 195 Hz, and a call duration of 1.1 ± 0.79 s.
The new call type S8 (Figure 1C) is a pulsed call, displaying bandwidth between 51 ± 19.6 and 516 ± 184.9 Hz, and very little variation in frequency structure between pulses. There is a substantial variation in the number of pulses in a call (15 ± 21.2) and in the call duration (1.8 ± 3.18 s), but generally the pulse repetition rate (14 ± 10 pulses s−1) is much higher than that of a S1 call, which has a mean value of 5.9 pulses s−1, a bandwidth between 90 to 1940 Hz, and a call duration of 1.8 s. Figure 1C shows one of the slower pulse rates encountered in the data. S8 calls were detected on 15 of the 16 tags, but two tag deployments on female/calf pairs generated over half the calls detected in the entire dataset.
The other new call type S9 is a slightly frequency-modulated call with up to four harmonics; the frequency of the fundamental varies between 55 ± 22 and 83 ± 51 Hz and lasts between 1.5 ± 0.94 s (e.g. Figure 1D). The fundamental tone increases by around 5 Hz over the duration of the call, something difficult to see directly in Figure 1D, although one can see corresponding frequency shifts in the harmonics near 100 and 150 Hz. This call type shows little similarity to the other prominent frequency-modulated calls from Dahlheim (Reference Dahlheim1987), such as the S3, M3 or N3, in that the S9 call has a much lower frequency band, with shorter duration. The call was detected on six tag records from all demographic groups.
The two new calls are by far the most common sounds detected in the tag recordings made by this study: 1084 S8 sounds and 71 S9 sounds, vs 50 S3 and 32 S1 sounds. This pattern is present regardless of the demographic class of animal that carried the tag (Table 1). The S1 sound had been the most common sound detected in previous studies (Dahlheim, Reference Dahlheim1987; Wisdom, Reference Wisdom2000; Ollervides & Rohrkasse, Reference Ollervides, Rohrkasse, Funes-Rodriguez, Gomez Gutierrez and Palomares-García2007).
Furthermore, a manual analysis of acoustic data collected from bottom-mounted recorders during the 2008 tagging season, using the same analysis procedure as the tag dataset, yielded 4757 S1 calls, 705 S3 calls and 520 S4 calls (another high-frequency pulsive call), but none of the new S8 or S9 calls were detected (Ponce et al., Reference Ponce, Thode, Guerra, Urban and Swartz2012). Although some S3 calls have frequency bands that descend to 120 Hz, none displayed frequencies at 70 Hz or below, as was typical with the S9 call found by this study. In other words, the two most common calls in the 2008 tag data were absent from recordings made with the bottom-mounted instruments deployed during the same season. Unfortunately, tags were not attached to whales at the exact same times that the bottom-mounted instruments were deployed during the season, but the bottom-mounted instruments were deployed during the same wintering season.
Confirming that S8 and S9 are not a flow noise or vibration artefact
Since S8 and S9 calls were very common on the tags, but absent from bottom-mounted recordings, it is reasonable to suspect that these new call types might simply be artefacts from vibration, flow noise or other mechanical factors associated with the tag attachment. To address this concern the frequency structure of the S8 call was compared with the harmonic structure of the S3 call, which is a confirmed grey whale call type. Although the S8 call is impulsive, individual pulses clearly show several narrowband regions of high intensity, indicative of some form of resonance (e.g. Figure 1C). For every S3 call noted in the tag data (50 calls), the frequency of each harmonic was recorded. Then, for every S3 call, 15 S8 calls were selected that were detected within 10 min of that particular S3 detection, and their frequency highlights were logged. S8 calls whose signal-to-noise ratios (SNR) were significantly different from the SNR of the S3 call in question were interpreted as possibly arising from non-tagged animals and were rejected. The SNR values had to differ by 8 dB to be considered significantly different.
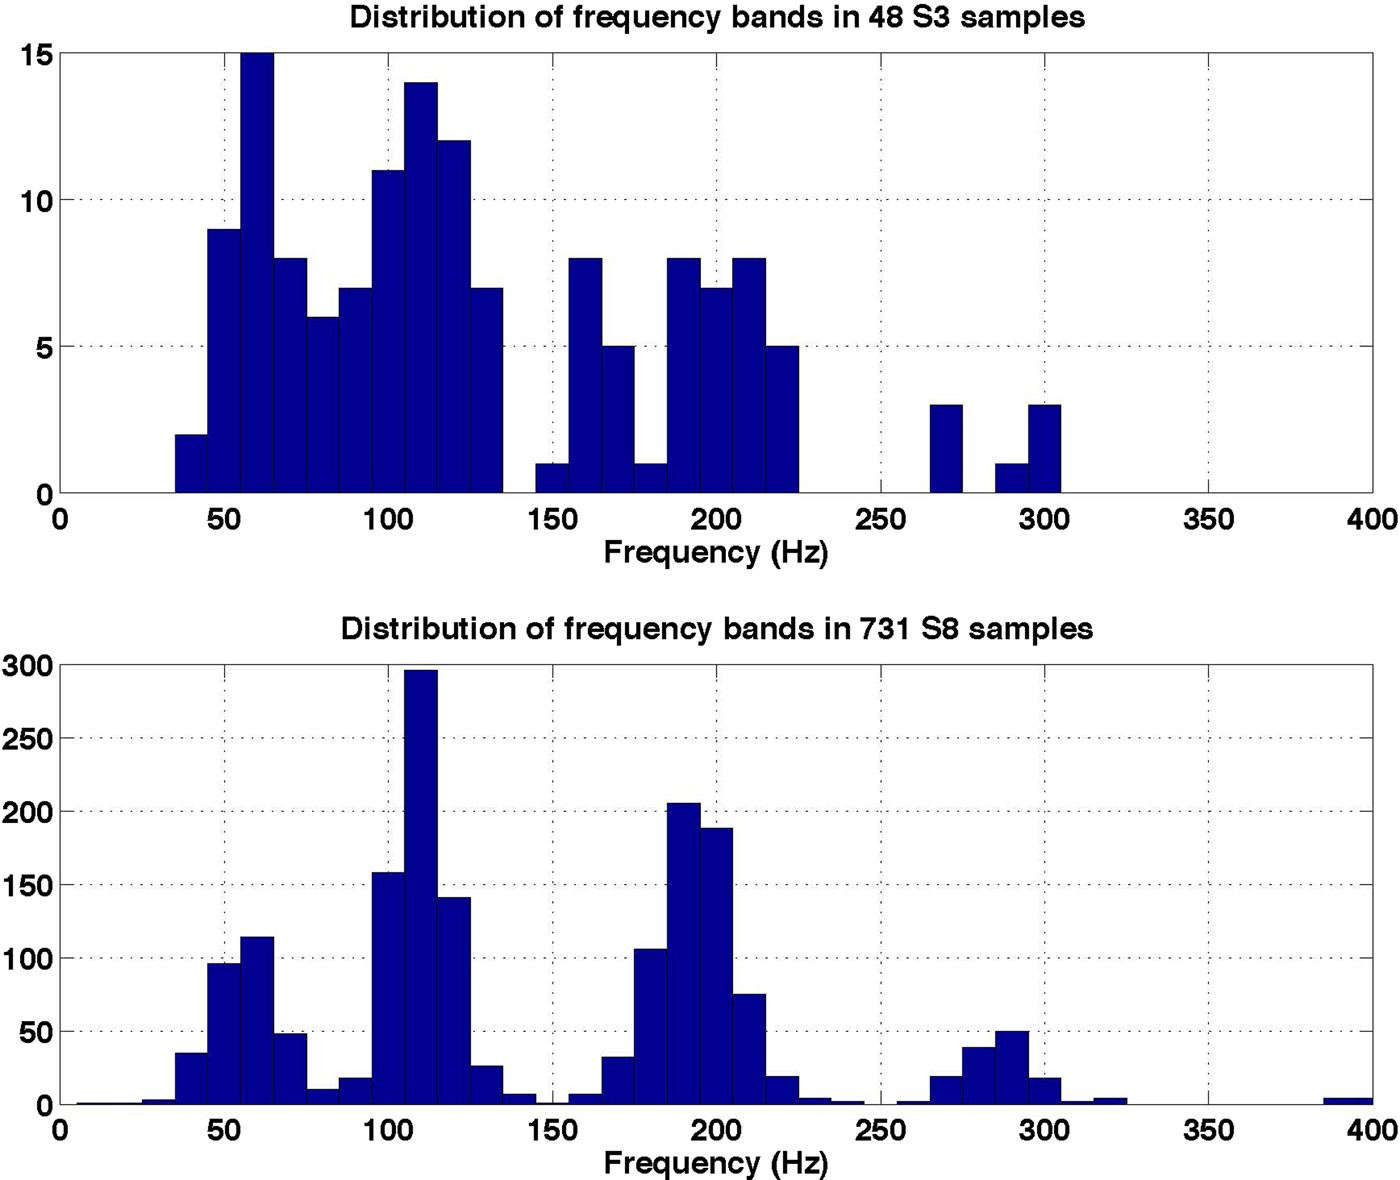
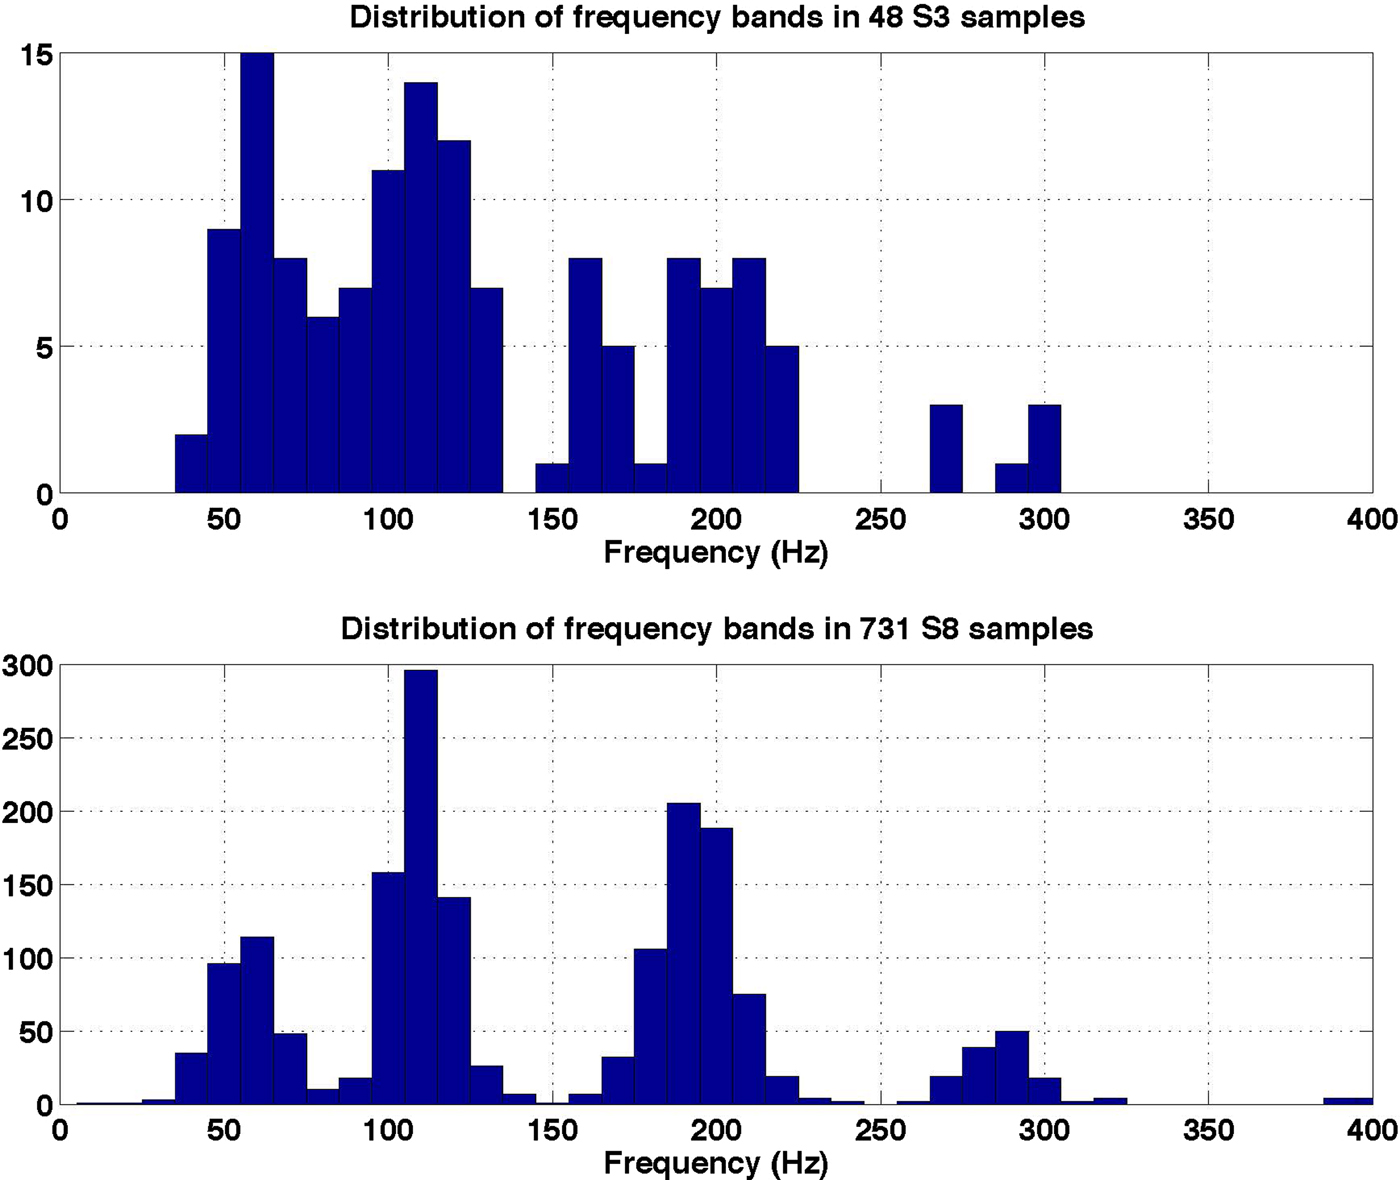
Figure 2 shows histograms of the distribution of harmonics for the 50 S3 calls, and the distribution of frequency highlights of 731 S8 sounds. Both sounds show prominent frequency components at around 60, 110, 200 and 290 Hz. The figure shows that the overtones of the frequency-modulated S3 bear a strong resemblance to the frequency maxima that appear in the pulses of the S8 call. The observed modes of the S8 distribution (60, 110, 190, 290 Hz) do not display an exact harmonic relationship, but are what might be expected to rise from a simple pipe resonator, or pipe resonator connected to a Helmholtz resonator (Kinsler et al., Reference Kinsler, Frey, Coppens and Sanders1982). The close similarity in these frequency structures suggest that the S8, like the S3, arises from the animal's sound production mechanism, and thus displays the same internal resonances as the animal's sound mechanism. As the tags were deployed behind the dorsal ridge of the animals, generally far away from any air spaces in the animal, and thus any pliable resonators, it seems unlikely that the slapping of a tag against the animal would generate similar resonances.
Comparison of the distribution of frequency tones of all S3 calls with local frequency highlights on a subset of S8 calls.
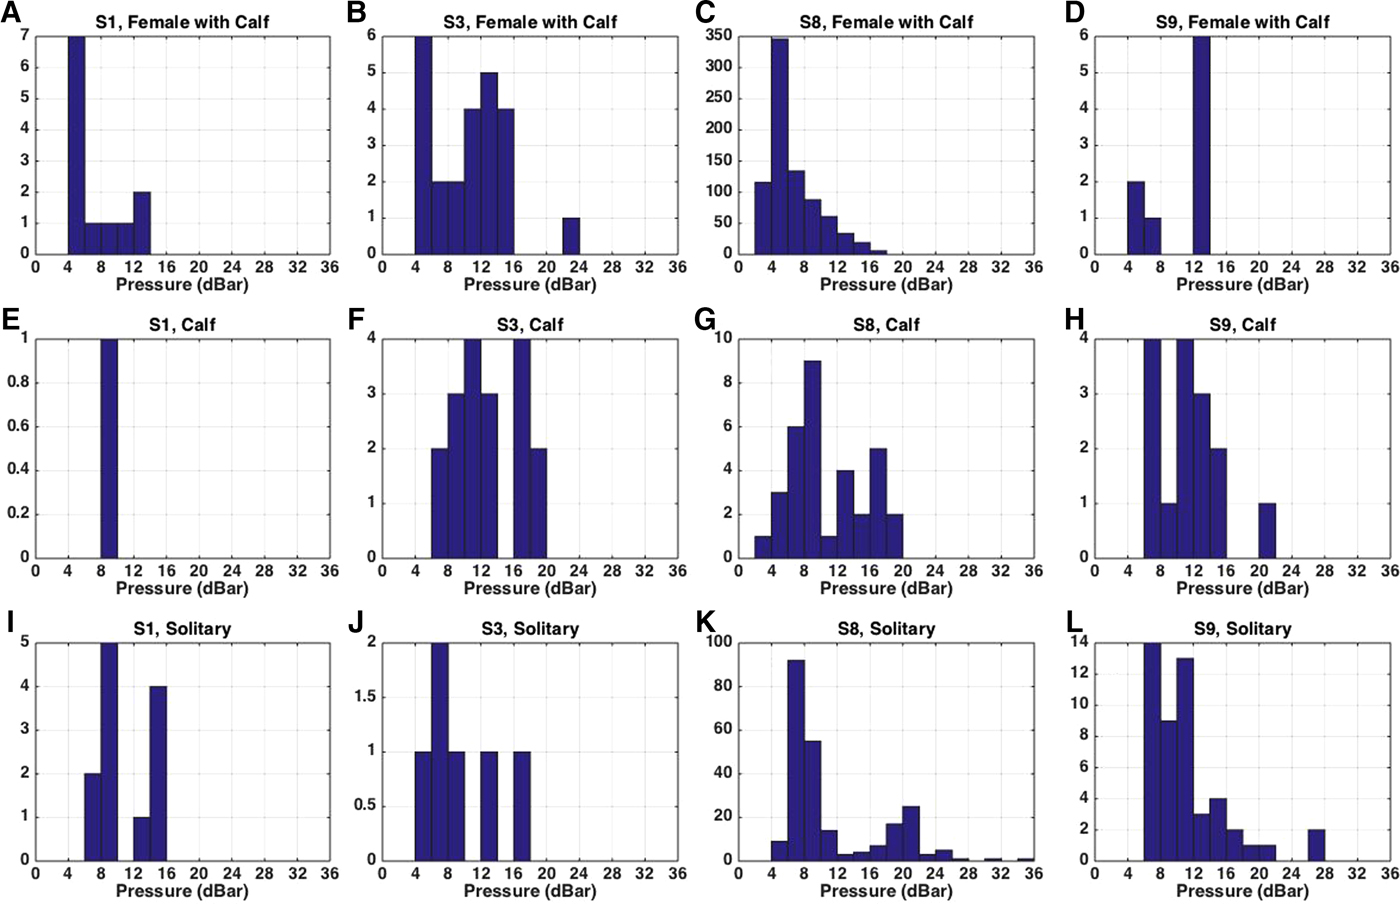
The S9 call bandwidth (between 55 ± 22 and 83 ± 51 Hz) was quite different than all other reported calls, so the procedure in the previous paragraph could not be applied. Instead, the movements of the tagged whales, as logged by the auxiliary tag data, were compared with vocalization times of both S8 and S9, to determine whether the S9 events were correlated with rapid changes in movement of the animal. Such a correlation, had it been found, would have been evidence that the S8 or S9 calls resulted from flow noise or other mechanical artefacts arising from whale movement. However, no correlation or association was found between the angular or depth acceleration (double derivative of depth with respect to time) of the tag measurements and times of the calls’ sound production. Figure 3 shows the depth distributions (in decibars) for various combinations of call types (columns) and demographics (rows). Neither of the new call types are generated at the surface (and are thus unlikely to be caused by surface wave impacts or vibration). The S9 call seems to be more likely to be generated at deeper depths than the S8 call.
Depth distributions of generated calls, arranged in combinations of call type and demographic. Depths are expressed in terms of decibars, which are almost numerically identical to metres. First row: Females with calves; second row: tagged calves; third row: solitary animals. First column: S1 calls; second column: S3 calls; third column: S8 calls; fourth column: S9 calls.
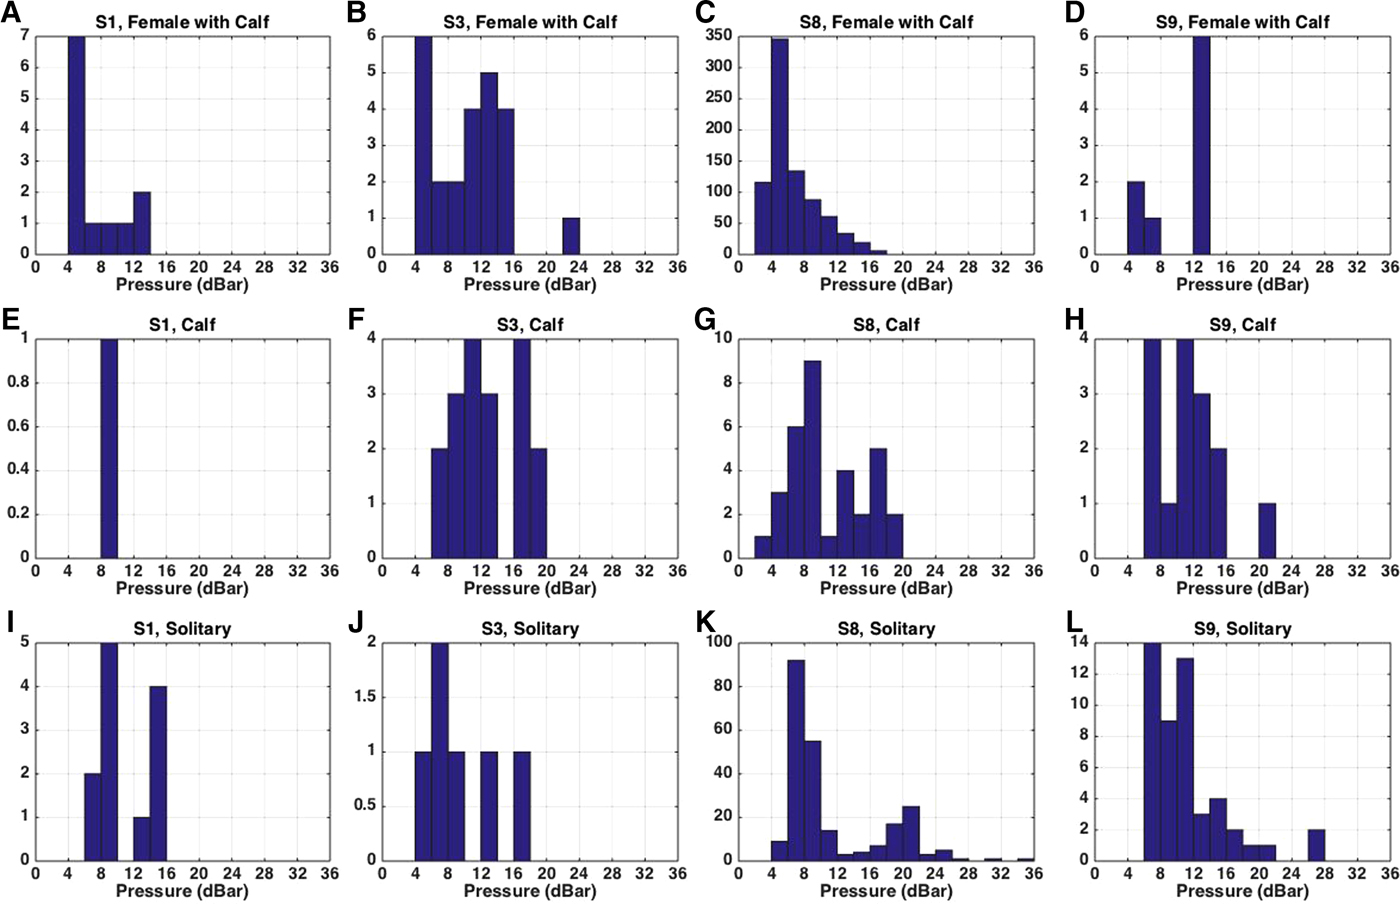
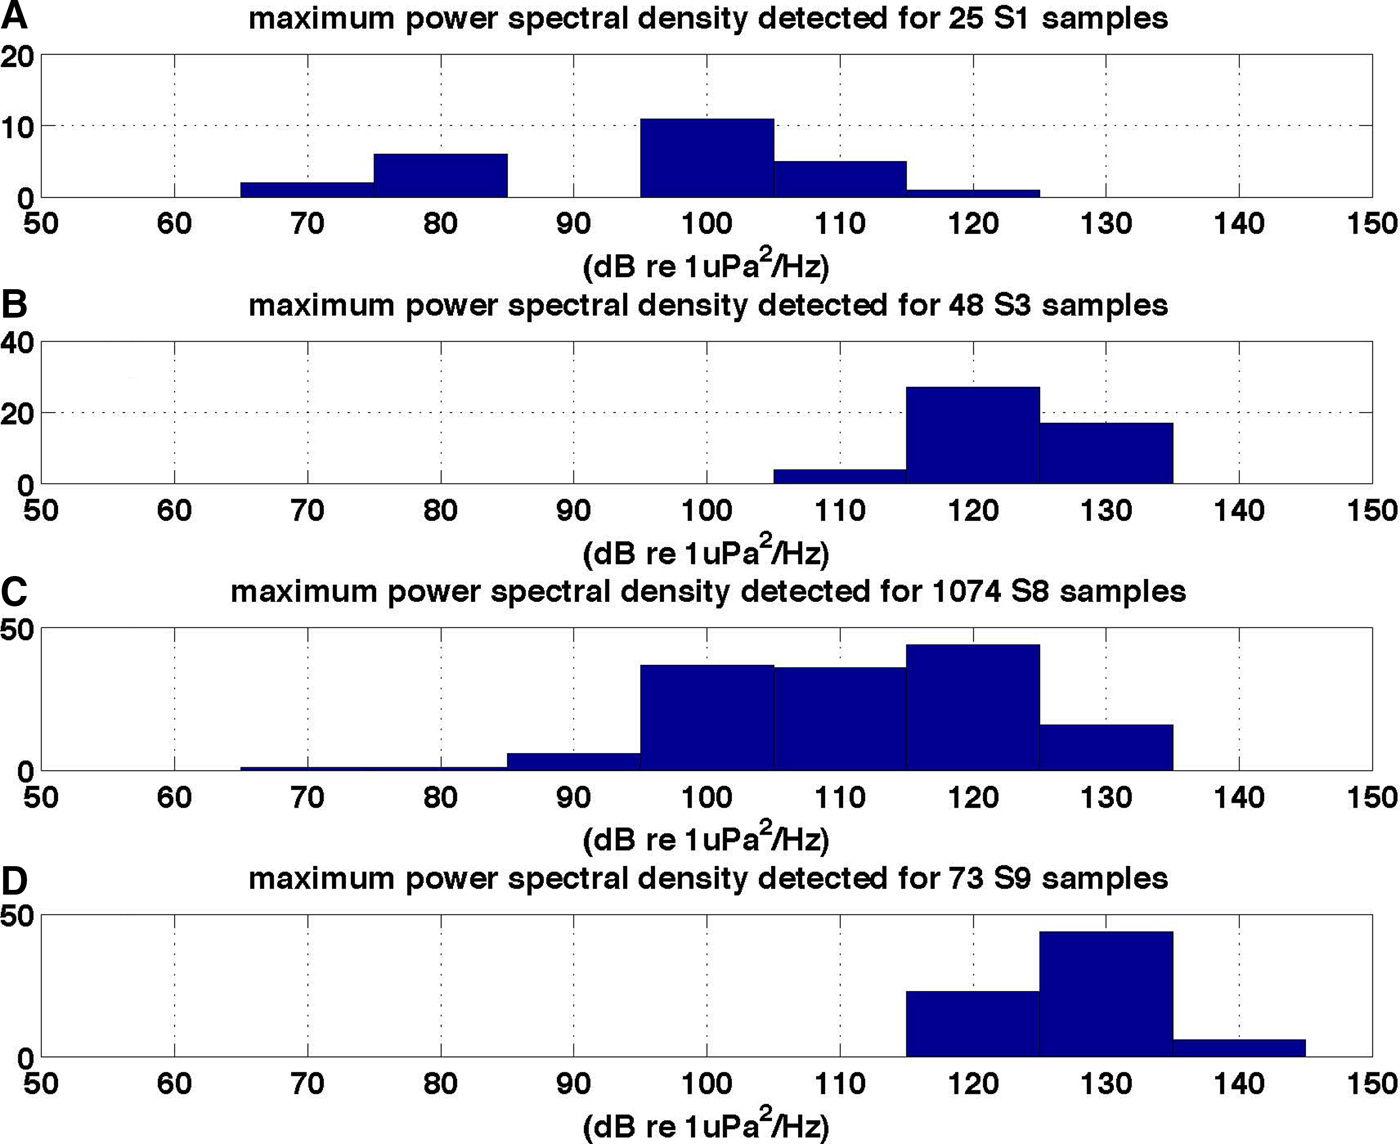
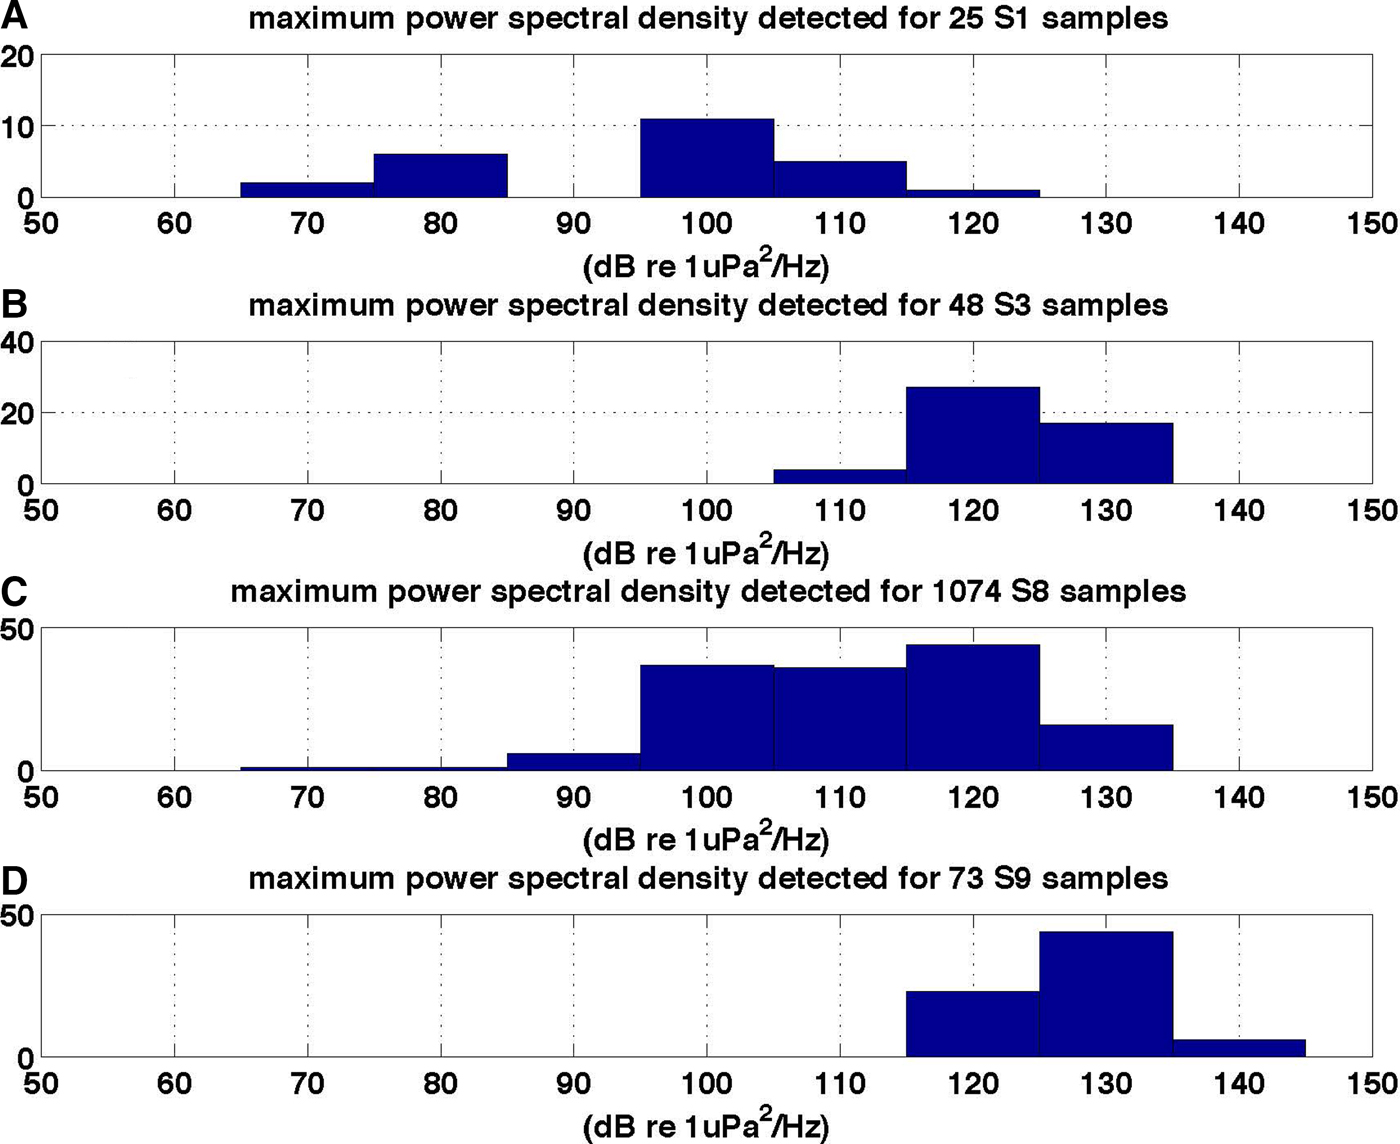
Figure 4 shows the distribution of the peak power spectral densities computed for the four call types shown in Figure 1. These values were obtained by first computing the power spectral density (PSD) of each individual received call, and then selecting the maximum spectral density encountered across the call bandwidth. The distribution of peak spectral densities for each call is then plotted as a histogram in Figure 4. The reason for plotting PSD instead of rms sound pressure level (SPL) or sound exposure level (SEL), is that PSD correlates better with detection range; the higher the peak PSD of a call, the further away it can be detected. In general, the power spectral densities on the tag lie between 110 and 140 dB re 1 uPa2 Hz−1, if we assume that the acoustic wave arriving on the tag is planar, and thus the acoustic particle velocity is proportional to the pressure. In reality the acoustic wave radiating in close vicinity of an oscillating low-frequency sphere displays a phase difference between the pressure and particle velocity (Kinsler et al., Reference Kinsler, Frey, Coppens and Sanders1982), so although the values in Figure 4 permit a relative comparison between source levels, it is incorrect to use them as absolute source levels.
Distribution of maximum power spectral densities detected in (A) S1, (B) S3, (C) S8 and (D) S9 calls. The y-axis indicates the number of calls in a given histogram bin.
DISCUSSION
Comparison of pulsed S8 call with other pulsed calls in grey whale literature
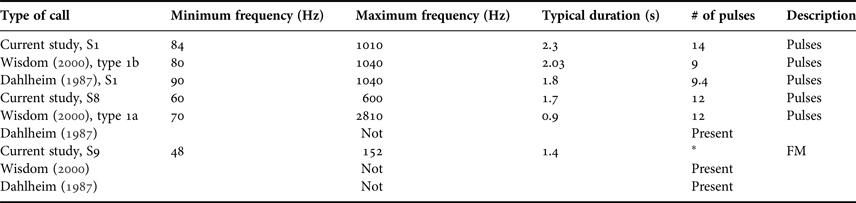
Both Dahlheim (Reference Dahlheim1987) and Wisdom (Reference Wisdom2000) identified several pulsed call types, including Dahlheim's S1 and S4 calls, and Wisdom's type 1a, 1b and 4 calls. All these calls, however, had substantially lower pulse rates than the S8 call. For example, the S1 (same as Wisdom's Type 1b call) displays a bandwidth between 80 and 1040 Hz, roughly nine pulses per call, and a pulse rate of only 4.8 s−1 (e.g. Figure 1A and Table 3).
Summary of S1, S8 and S9 calls, with comparisons to previous literature.

The possible exception is Wisdom (Reference Wisdom2000) Type 1a, which displays a bandwidth between 70 ± 30 and 2810 ± 910 Hz, a call duration around 910 ± 130 ms, 12 ± 2 pulses call−1, and a pulse repetition rate of 13 pulses s−1 (Table 3). This call was common in recordings of the captive calf JJ, with 183 samples collected; however, Wisdom (Reference Wisdom2000) could only locate nine samples from boat-based recordings. Thus it is possible that Type 1a and S8 may be the same call type, but the 1a samples from captivity do not match the bandwidth (e.g. Figure 1C), and too few samples of 1a in the lagoon exist to be certain.
Explaining the discrepancy between relative occurrences of call types in tag and bottom-mounted acoustic data
There is a marked contrast between the relative occurrences of the S8 and S9 calls in the tag data reported here, and in previously reported boat-based or bottom-mounted acoustic data recordings, including recordings obtained during the 2008 tagging season. Once mechanical vibration and flow noise have been ruled out as a factor, five possible explanations for the discrepancy remain: (1) changes in acoustic repertoire over the years; (2) differences in source level distributions between call types; (3) biases in tagging a particular age or demographic class of animal; (4) differences in propagation effects or ambient noise masking effects, arising from different bandwidths.
Explanation 1: It may be possible that the relative occurrence of S8 and S9 calls have increased over the years, but this hypothesis cannot explain the discrepancy between call rates detected on the 2008 tag and bottom-mounted acoustic recordings.
Explanation 2: Figure 2 shows that, if anything, the relative S8 and S9 call source levels are higher than those of other reported calls.
Explanation 3: The tagging sample may be biased toward particular subsets of grey whale age or reproductive classes: females with calves are generally easier to approach with the tagging vessel. Indeed, one sees from Table 1 that the majority of S8 calls were detected on females with calves, and that the S8 production rate for mother/calf pairs (1.2 calls min−1) is over four times greater than the S8 production rate for single animals (0.28 calls min−1). However, the S8 and S9 calls were still the dominant calls on single animals (of unknown sex) and calves (although the latter might be confounded with sounds of the mother on the tag).
Explanation 4: The S8 and S9 show lower frequency ranges than the S1 call; indeed, the S9 call has the lowest frequency range of all the calls detected. In the relatively shallow waters (10–20 m) of the lagoon, low-frequency energy can be more highly attenuated than higher frequencies. A 10 m depth Pekeris waveguide with a bottom speed and density representative of sand (1650 m s−1) has a cutoff frequency of 75 Hz, a higher frequency than the dominant component of the S9 call. However, various numerical simulations of various shallow-water environments and depths (as discussed in more detail in Ponce et al., Reference Ponce, Thode, Guerra, Urban and Swartz2012), suggest relatively little difference in propagation characteristics for frequency components above 200 Hz, so no obvious mechanism exists to assign a much higher propagation loss to S8 calls vs. the well-known S1 call. This similarity in frequency bandwidth between the S1 and S8 calls also rules out explanations based on higher levels of masking noise at lower frequencies.
Our best hypothesis for why the S9 call has not been previously reported is Explanation 4, that the relatively low frequency of the call (50 Hz) gives it relatively poor propagation characteristics in the 15 m or less water depths of the lagoon. The S9 call may also be more highly masked compared with the other call types in the lagoon, as low frequency acoustic data collected in the lagoon often suffers from flow and tidal noise. However, we can provide no similar rationale for why such a discrepancy exists in the detection of S8 calls between tag and bottom-mounted data, since the S8 call covers a frequency range similar to previously identified calls.
We do note that the bottom-mounted recorders were deployed in regions far away from most mother/calf pairs (who produce the most S8 calls per unit time), and thus we believe that Explanation 3 is currently the best hypothesis for the relative paucity of S8 calls on the bottom-mounted recorders.
CONCLUSION
Two new call types produced by the grey whale have been presented here, and are generated by both solitary animals and mother/calf pairs. The new call types are very common on recording tags attached to animals, but do not seem to be mechanical artefacts or noise arising from the tag attachment. The results of this study may be useful in aiding future bioacoustic research into grey whale presence-absence in the Biosphere Reserve ‘El Vizcaino’. Table 3 summarizes the statistics of the two new call types, along with call type S1. The table also clarifies the differing nomenclature used to describe the same calls by different researchers.
ACKNOWLEDGEMENTS
The authors wish to thank the Laguna San Ignacio Ecosystem Science Program, the Ocean Foundation, the Scripps Institution of Oceanography (SIO) Development Office, the World Wildlife Fund-Mexico, and Telcel for providing support for the acoustics research in Laguna San Ignacio, as well as travel support for the first author to travel to the Scripps Institution of Oceanography in San Diego to analyse the acoustic data.
FINANCIAL SUPPORT
The first author was supported by a CONACYT scholarship. Sheyna Wisdom provided helpful guidance on the manuscript. Erin Oleson and the SIO Hildebrand lab shared details of the bioacoustic tag assembly, along with Joe Olson of Cetacean Research Technology. This research was conducted under the authorization of Mexican research permit No. 08433 from the ‘Subsecretaria de Gestión para la Protección Ambiental, Dirección General de Vida Silvestre’.