1. INTRODUCTION
The first soft X-ray laser built in 1985 was extremely sophisticated single-shot instrument driven by the most powerful visible/infrared laser in the world (Matthews et al., Reference Matthews, Hagelstein, Rosen, Eckart, Ceglio, Hazi, Medecki, MacGowan, Trebes, Whitten, Campbell, Hatcher, Hawryluk, Kauffman, Pleasance, Rambach, Scofield, Stone and Weaver1985). Therefore, it is not surprising that application of short-wavelength lasers was in the beginning restricted to high-energy density physics and related research areas. However, during the past three decades extreme ultraviolet (XUV) lasers became available to broader scientific public around the world (XUV Lasers Inc., 2009). This encourages a numerous research groups to apply these lasers in material science, biology, chemistry, physics, and technique.
Interaction of short-wavelength, XUV radiation with solid surfaces is characterized: (1) by low penetration depth (typically a few nanometers or tens of nanometers), which ensures the deposition of major part of radiation energy on the surface and in the near-surface region; and (2) by the fact that a single XUV photon carries an energy from ~15 to 300 eV, which exceeds a dissociation energy of any chemical bond in molecules and a cohesive energy of solids; therefore, even a single photon is capable to release the target-building parts directly without a need of sudden heating. Due to that XUV lasers are predetermined to: (a) estimation and minimization damages to surfaces of highly irradiated XUV optical elements developed and used for guiding and focusing of beams of short-wavelength lasers and related sources; (b) durability assessments of materials suggested for the first wall of fusion reactors and optical elements exposed to intense XUV radiation in a laser–plasma interaction chamber; (c) studies of mechanisms leading to radiation damage to a sample during its structural investigation with intense X-rays; (d) diffraction-limited nanostructuring of solid surfaces for the fabrication of microelectronics and micromechanical elements and devices; (e) determination of radiation field characteristics in/around the focus, that is, to evaluation of spatial energy distribution in a focused beam ablatively imprinted on the irradiated material and determination of pulse energy content; and (f) production and investigation of very dense plasma with relatively low electron temperature (T e ~ 10 eV), called warm dense matter (WDM).
This paper is primarily focused on direct nanostructuring by coherent XUV radiation – item (d) in the preceding paragraph. Namely it shows that artificial interference nanostructuring is – at present manufacturing precision of non-flat surfaces – covered by stray spontaneously appearing interference patterns generated by each aspheric interferometer mirror.
2. NANOSTRUCTURING
2.1. Laser-induced periodic surface structures
Probably the first spontaneously appearing nanostructures in craters produced by falling coherent XUV radiation were so called “laser-induced periodic surface structures” (LIPSS) [Sipe et al. (Reference Sipe, Young, Preston and Vandriel1983), Young et al. (Reference Young, Preston, Vandriel and Sipe1983, Reference Young, Spie and Vandriel1984), Steeg et al. (Reference Steeg, Juha, Feldhaus, Jacobi, Sobierajski, Michaelsen, Andrejczuk and Krzywinski2004), Juha et al. (Reference Juha, Bittner, Chvostova, Krasa, Kozlova, Pfeifer, Polan, Prag, Rus, Stupka, Feldhaus, Letal, Otcenasek, Krzywinski, Nietubyc, Pelka, Andrejczuk, Sobierajski, Ryc, Boody, Fiedorowicz, Bartnik, Mikolajczyk, Rakowski, Kubat, Pina, Horvath, Grisham, Vaschenko, Menoni and Rocca2005), Kolacek et al. (Reference Kolacek, Straus, Schmidt, Frolov, Prukner, Shukurov, Holy, Sobota and Fort2012), Juha and Kolacek (Reference Juha and Kolacek2014)]. LIPSS I (LIPSS of the first type) are typically created by a polarized light [Sipe et al. (Reference Sipe, Young, Preston and Vandriel1983), Young et al. (Reference Young, Preston, Vandriel and Sipe1983), Steeg et al. (Reference Steeg, Juha, Feldhaus, Jacobi, Sobierajski, Michaelsen, Andrejczuk and Krzywinski2004), Juha et al. (Reference Juha, Bittner, Chvostova, Krasa, Kozlova, Pfeifer, Polan, Prag, Rus, Stupka, Feldhaus, Letal, Otcenasek, Krzywinski, Nietubyc, Pelka, Andrejczuk, Sobierajski, Ryc, Boody, Fiedorowicz, Bartnik, Mikolajczyk, Rakowski, Kubat, Pina, Horvath, Grisham, Vaschenko, Menoni and Rocca2005)] and represent a material response to interference of incidence radiation and the radiation scattered along the surface; their spatial period (usually close to irradiating wavelength) depends on this wavelength, polarization, and incidence angle. LIPSS II (LIPSS of the second type) are attributed to melting effects (Young et al., Reference Young, Spie and Vandriel1984) that: (1) at low fluences cause that thin molten strips resolidify on the solid surface; (2) at high fluences result in structures that arise from freezing of (a) capillary or acoustic waves or (b) hydrodynamic (Rayleigh–Taylor/Kelvin–Helmholtz) instabilities, which are generated on the uniformly melted surface; their spatial period (from ~250 nm to micrometers) usually increases with increasing fluence. Besides that to this category (LIPSS II), or to newly created category (LIPSS III) are temporarily counted all other nanostructures of unknown origin like the ones that we observed (Kolacek et al., Reference Kolacek, Straus, Schmidt, Frolov, Prukner, Shukurov, Holy, Sobota and Fort2012) about 5 years ago on the bottom of the crater dug into polymethylmetacrylate (PMMA) by our Ar8+ laser (λ = 46.9 nm/few tens of μJ/1.2 ns) focused by spherical multilayer (Sc/Si) mirror Ø40 mm/f = 1050 mm/incidence angle 3.814°. It is visible (see Fig. 1) that each ablated part has on its surface more or less contrast periodic structure with period ~2,8 µm and with peak-to-peak depth ~5–10 nm.
Spot ablated by five laser shots in the more distant astigmatic focus. Left: Region in the right corner. Right: Region in the middle-bottom part of the spot. Top: 3D images. Bottom: 2D images.

2.2. Fresnel diffraction patterns
Next types of nanostructures are Fresnel diffraction patterns that appear on the target surface, for example, in windows of in-proximity-standing grid (Kolacek et al., Reference Kolacek, Straus, Schmidt, Frolov, Prukner, Shukurov, Holy, Sobota and Fort2012) [see Fig. 2, apparatus is described in Frolov et al. (Reference Frolov, Kolacek, Straus, Schmidt, Prukner, Choukourov and Juha2013)]. Such pattern has (in one direction) form described as the sum of squares of Fresnel integrals (one large maximum at the window frame is followed by smaller and smaller maxima, nearer and nearer to each other toward the window's center). Such diffraction pattern appears in each grid-window (7.5 × 7.5 µm2), into which the focused laser radiation falls. No traces of former strips shown in Figure 1 were registered.
Diffraction from rectangular apertures – windows in proximity standing grid; the PMMA sample is placed in sagital focus of multilayer mirror and fluency is everywhere smaller than ablation threshold. Left: 3D image, right: 2D image.
Later on, when laser energy was increased to a few hundreds of μJ, the energy density in the center of focused laser beam exceeded ablation threshold not only for PMMA, but also for GaAs: In grid-windows, into which higher dose than the ablation threshold was deposited (i.e., in the center of the focused beam) a smooth crater was engraved, whereas in other windows a diffraction pattern appeared (see Fig. 3). It is worth mentioning that the diffraction pattern in GaAs remains shallow (~3–4 nm), while smooth crater in the same material has depth ~100–350 nm. On the contrary, in PMMA the diffraction pattern has nearly the same depth as the smooth crater (~300 nm). These facts confirm [Kolacek et al. (Reference Kolacek, Schmidt, Straus, Frolov, Prukner, Melich and Choukourov2013a), Kolacek et al. (Reference Kolacek, Schmidt, Straus, Frolov, Juha and Chalupsky2015)] that nanostructuring appears only in the desorption region. While for GaAs the dependence of particle removal efficiency η on local dose ε for nanosecond pulses remains the same as it was shown in Chalupsky et al. (Reference Chalupsky, Juha, Hajkova, Cihelka, Vysin, Gautier, Hajdu, Hau-Riege, Jurek, Krzywinski, London, Papalazarou, Pelka, Rey, Sebban, Sobierajski, Stojanovic, Tiedtke, Toleikis, Tschentscher, Valentin, Wabnitz and Zeitoun2009) for PMMA and 20 fs pulses [i.e., η < 10% for ε < εthreshold (desorption region), η~100% for ε ≥ εthreshold (ablation region)] for PMMA and nanosecond pulses the dependence of η = η(ε) for ε < εthreshold dramatically changes: When the local dose ε increases from zero to εthreshold, then the removal efficiency η increases from zero to ~90% (not to ~10% as for femtosecond pulses). This phenomenon can be explained by the fact that many bonds on/at the surface of irradiated material break already during the laser pulse (the breaking time is of the order of picoseconds) and that fact may significantly increase the removal efficiency and make the nanosecond sources extremely suitable for XUV nanostructuring.
The left half of the figure shows AFM-evaluated imprint in PMMA surface, the right half depicts imprint in the GaAs surface. In the first row there are 3D images of larger part of the imprints, where both the desorption area with a diffraction pattern and the ablation area without this pattern could be found. The second row shows 3D images and the third row 2D images of the imprinted pattern. In each half, the left columns in the second and in the third rows belong to ablation region, while the right columns belong to desorption regions with imprinted diffraction pattern.
2.3. De-magnifying projections
Further type of XUV-assisted nanostructures, that can have practically any shape, is created by the so-called de-magnifying projection. The mask is projected with simple de-magnified imaging on the target that is either bare [then it is a direct imprint technique (Mocek et al., Reference Mocek, Rus, Kozlova, Polan, Homer, Juha, Hajkova and Chalupsky2008)], or covered by the positive or negative photoresist [photoresist technique (Capeluto et al., Reference Capeluto, Wachulak, Marconi, Patel, Menoni, Rocca, Iemmi, Anderson, Chao and Attwood2007)].
2.4. Interference patterns
The last type of nanostructures that have a pre-defined shape are interference patterns [recorded up to now through exposing a photoresist only (Auzelyte et al., Reference Auzelyte, Dais, Farquet, Gruetzmacher, Heyderman, Olliges, Padeste, Sahoo, Thomson, Turchanin, David and Solak2009; Park, Reference Park2010; Marconi and Wachulak, Reference Marconi and Wachulak2010)]. Namely this technique is being or might be used: (1) for advancing the lithographic technology (till XUV lithography is reliably developed) and for optimization of photoresist materials for XUV; and (2) for reliable determination of ablation contour [see in more detail in Kolacek et al. (Reference Kolacek, Schmidt, Straus, Frolov, Prukner, Melich and Choukourov2013a)] that is necessary for laser beam metrology. Our ambition was to develop a new type of interferometer suitable directly to imprint the interference pattern into a substrate – having in mind mainly the material research application.
2.4.1. Basic considerations
It is well known that one-dimensional interference pattern arises, if two mutually coherent beams of electromagnetic radiation are combined on some surface. The spacing d of interference fringes is
 $$d = \displaystyle{{\rm \lambda} \over {2\sin ({{\rm \varphi} / 2})}}$$
where λ is the wavelength and φ is the angle of combined beams. Simultaneously, for photon-based processes it holds that the minimum achievable line-width δ (the smallest feature that can be obtained) is
 $${\rm \delta} = \displaystyle{{k{\rm \lambda}} \over {NA}}$$
where k is the constant of the order of 1 depending on illumination [Attwood (Reference Attwood1999)] and NA is the numerical aperture. A next limit connected with generation of Auger electrons applies to radiation with photon energies > ~1 keV (λ < ~1.2 nm), which is out of range of our interest.
As sources for interference lithography there are usually used synchrotrons with undulators (tuneable, but with limited coherence) and laser- or discharge-pumped XUV/soft X-ray lasers [Rocca (Reference Rocca1999), Kolacek (Reference Kolacek2003a), Eberl et al. (Reference Eberl, Wagner, Jacoby, Tauschwitz and Hoffmeann1997)].
Interferometers could be divided, for example, according to beam-splitting method to: (1) wave-front division interferometers with the four typical representatives: (a) Lloyd's mirror (part of the beam is reflected from a flat mirror and interferes with not reflected part of the beam) [Capeluto et al. (Reference Capeluto, Vaschenko, Grisham, Marconi, Luduena, Pietrasanta, Lu, Parkinson, Menoni and Rocca2006), Ritucci et al. (Reference Ritucci, Reale, Zuppella, Reale, Tucceri, Tomassetti, Bettotti and Pavesi2007), Wachulak et al. (Reference Wachulak, Capeluto, Marconi, Patel, Menoni and Rocca2007a), Wachulak et al. (Reference Wachulak, Capeluto, Marconi, Menoni and Rocca2007b)]; (b) double Lloyd's mirror (part of the beam is reflected from the first flat mirror and interferes with other part of the beam reflected from behind standing mirror) [Kozlova (Reference Kozlova2009), Margarone et al. (Reference Margarone, Rus, Kozlova, Nejdl, Mocek, Homer, Polan, Stupka, Cassou, Kazamias, Lagron, Ros, Danson and Hawkes2010)]; (c) Fresnel's mirrors (“ridged roof”) [Svatos et al. (Reference Svatos, Joyeux, Phalippou and Polack1993)]; (d) diffraction masks (diffraction orders of different individual gratings recombine in the surface of the sample to produce multiple beam interference) [Fernandez and Phillion (Reference Fernandez and Phillion1998)]; (2) amplitude division interferometers (typically remove the problem with limited spatial coherence of sources), the typical representative of which is either (α) Mach–Zehnder [Wachulak et al. (Reference Wachulak, Grisham, Heinbuch, Martz, Rockward, Hill, Rocca, Menoni, Anderson and Marconi2008)] (a transmission grating as the beam-splitter uses its 1st and –1st diffraction order as interfering beams (with the help of additional two mirrors), whereas the 0th order is blocked, or (β) Michelson [Delmotte et al. (Reference Delmotte, Ravet, Bridou, Varniere, Zeitoun, Hubert, Vanbostal and Soullie2002), Smith et al. (Reference Smith, Dunn, Hunter, Nilsen, Hubert, Jacquemot, Remond, Marmoret, Fajardo, Zeitoun, Vanbostal, Lewis, Ravet and Delmotte2003)] (with the coated Si3N4 membrane as a beam-splitter).
Since the subject of our work is direct nanopatterning, the designed interferometer should have: (1) such geometry and so large throughput that the fluency would be capable of imprinting the interference field into the target; (2) so dense interference pattern that the pitch of interference fringes approaches the diffraction limit (for the maximum achievable resolution). It is clear that none of the interferometers listed above fulfills these requirements: They work with flat mirrors (or nearly flat that compensate the natural divergence of beams only); therefore, energy density of their combined beams is insufficient for imprinting; moreover, the density of their interference fringes is small, because the angle of their interfering beams is small, with one exception – the Mach–Zehnder interferometer with transmission grating as the beam-splitter; but because it uses its 1st and –1st diffraction order, its throughput is very small.
2.4.2. Interferometer design
Therefore, while all the above-mentioned interferometers work with parallel or diverging beams, the designed interferometer has to have focusing mirrors that enable significantly increase fluency in the beam-crossing space. As focusing elements a semi-ellipsoidal mirrors were selected, because they perfectly image one common (for both ellipsoidal mirrors) focal point, XUV source output, to another (separate for each ellipsoidal mirror, but close to each other) focus, situated near the beam-crossing region. A high fringe density has to be ensured by a large angle of crossing beams, which might be realized by a modified double Lloyd's mirror geometry, in which the second mirror is shifted away from the first one. For simplicity and universality the first attempt preferred grazing incidence on both mirrors [see in more detail in Kolacek et al. (Reference Kolacek, Schmidt, Straus, Frolov, Prukner, Melich, Assoufid, Ohashi and Asundi2014)]. To keep the lateral dimensions of grazing incidence mirrors in reasonable limits, it is necessary to place them relatively close to XUV source output. However, it turned out that increasing angle between interfering beams is accompanied by increased path difference of the beams, which is demanding on coherence of the source.
In the second attempt, the concept of grazing incidence mirrors was abandoned. This enabled not only to place the interferometer mirrors to reasonable distance from XUV source output and keeping them relatively small, but also to increase the angle of interfering beams at keeping path difference of the beams near zero (see Fig. 4). Especially if the first mirror (closer to XUV source output) reflects the half of primary beam which is more distant from the secondary foci of mirror-surface-ellipsoids and if the second mirror is shifted from the first one by the radius of primary beam in this position, then the central rays of both halves of the beam have approximately the same length. The price for that is a necessity of optimized mirrors’ coatings; that is, coatings that at different incidence angles on both mirrors ensure their maximum, but for both mirrors the same reflectivity – a necessary condition for the highest contrast of interference pattern [Kolacek et al. (Reference Kolacek, Frolov, Melich, Prukner, Schmidt and Straus2013b)].
Design of an interferometer with mutually shifted normal incidence double Lloyd's mirror. Focusing mirrors have semi-ellipsoidal, or semi-annuloidal, where annuloids are osculating annuloids of ideal ellipsoid. Both ellipsoids, generating reflecting surfaces of both mirrors, have common first focus F11≡F21, placed in the output aperture of X-ray source. Second foci of both ellipsoids (F12, F22) lie on a straight line (line of foci) parallel with the axis of the primary beam. Mirrors can be relatively small, angle of interfering beams can be large, and if the first mirror (closer to capillary output) reflects the half of primary beam which is more distant from the secondary foci of ellipsoids and if the second mirror is shifted from the first one by the radius of primary beam in this position, then the central rays of both halves of the beam have approximately the same length. Bottom-right is 3D worm's-eye view of the mirrors from the side of X-ray source output.
Therefore, taking into account that the center of the first window of diagnostic chamber has axial distance from the capillary output 1834.5 mm, the divergence of laser beam is 7.14 mrad, and choosing angle of secondary beams 25° (i.e., grazing incidence angle on the first and on the second mirror is by turns 38.75° and 51.25°), choosing length of secondary beams 20 mm, and choosing distance of the crossing region from both foci 2 mm, then the pitch of interference fringes will be 56.6 nm, and the interference field will have 0.39 mm across fringes × 0.71 mm along fringes.
2.4.3. Ray-tracing tests
This interferometer has been already tested by ray-tracing software ZEMAX (see Fig. 5). While the top part of Figure 5 shows the full view on the traced rays, the bottom right part displays the detail picture of rays in the interferometer: The primary beam is split by semi-ellipsoidal mirrors M1 and M2 to two secondary beams, which are focused by these mirrors to their foci F12 and F22. In the region of crossing of secondary (highlighted) beams, a detector 2 × 2 µm2 is placed, in which the interference is examined. The result of this examination constructed from highlighted red and green bundles (each containing 108 rays sent into 0.01°) is shown in the bottom left part of Figure 5. Moreover, a sensitivity of interferometer to miss-alignment was tested by ray-tracing of the setup, in which either both mirrors are shifted by 2 mm, or M2 is shifted by 0.5 mm, or M2 is tilted by 0.5°. All these runs show (after re-normalization to the total number of ray hits on the detector) a little influence on the interference pattern [see in more detail in Kolacek et al. (Reference Kolacek, Schmidt, Straus, Frolov, Prukner, Melich, Assoufid, Ohashi and Asundi2014)], which is very encouraging.
The test of interferometer by software ZEMAX. Top: Full view on the traced rays. Bottom right: The bundle of primary beam is split and focused by mirrors M1 and M2 to two secondary beams, which cross each other before reaching their foci; for interference testing two sub-bundles highlighted by red and green colors are selected. In the crossing a detector 2 × 2 µm2 is placed, in which the interference is examined. Bottom left: The interference pattern generated by highlighted sub-bundles.
2.4.4. Multilayer coating of the mirrors
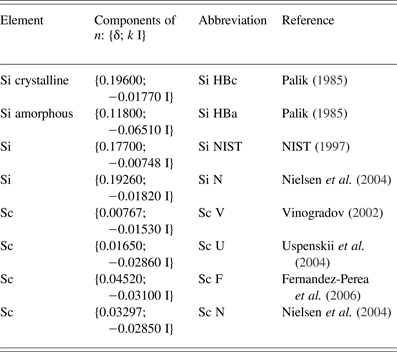
In a “longer XUV wavelength region”, which 46.9 nm wavelength of Ar8+ laser belongs to, the mirror coating traditionally uses Sc/Si combination of elements. For our first multilayer coating design of mirrors of this interferometer we used indexes of refraction employed already by Nielsen et al. (Reference Nielsen, Jankowski, Friedman and Walton2004) (see also later) and obtained the Reflectivity curves as a function of grazing incidence angle (angle between incident ray and mirror-surface) with a relatively narrow peak, as high as ~50%, for selected grazing incidence angles (38.75° for the first ellipsoidal mirror and 51.25° for the second one). Due to this rather critical design it was decided to examine the test coating (eight bi-layers, period 36.1 nm, Sc 18.3 nm, Si 17.8 nm) on a flat substrate (Ø 1″, UV Fused Silica Super Polished Mirror Blank, <2 Angstrem Roughness, λ/20 Flatness). On “φ − 2 × φ stand”, which enables to change simultaneously grazing incidence angle φ on the mirror and the angular position 2 × φ of the detector (vacuum photodiode), the reflectivity curve as a function of grazing incidence angle was measured (see Fig. 6, left). It turned out that reality dramatically differs from the theoretical predictions. Due to that the theoretical reflectivities of the above-mentioned test coating for all combinations of all in the literature found indexes of refraction (see Table 1) were calculated (see Fig. 6, right). It seemed that combination with amorphous Si (particularly Si HBa Sc F – dotted blue left-part/dotted green right part of this figure) fits best to experimental curves (note that experimental points for grazing angles <26° are not taken into account, because probably not the whole beam is reflected from the mirror). However, our earlier reflectivity measurement of our old focusing mirror designed for quasi-normal angle of incidence (14 bi-layers, period 26.3 nm, Sc 13.15 nm, Si 13.15 nm) gave reflectivity 0.225, while calculated reflectivity was <0.1 for amorphous Si in combination with any Sc index of refraction, and >0.3 for crystalline Si and any Sc index of refraction [see in more detail Kolacek et al. (Reference Kolacek, Schmidt, Straus, Frolov, Prukner, Melich, Assoufid, Ohashi and Asundi2014)]. Therefore, either it is possible to speculate that earlier sputtering process gave ~50%/50% crystalline/amorphous Si, while the present process gives mostly amorphous Si only, or (if the past and the present processes give the same results) it is necessary to admit less probable case that in the sputtered Si layers is ~25% of crystalline Si and ~75% of amorphous Si (Fig. 6, left part, blue short-dash-and-dot curve) and disagreement with experimental points is a matter of experimental errors.
Left. Reflectivity (as a function of grazing incidence angle) of test coating (eight bi-layers, period 36.1 nm, Sc 18.3 nm, Si 17.8 nm) differs from theoretical predictions, one of which is the solid blue curve. Right: All combinations of indexes of refraction published for Si and Sc (see Table 1) were used for calculation of set of theoretical reflectivity curves for these combinations; it seems that combination with amorphous Si (particularly Si HBa Sc F – dotted blue left-part/dotted green right-part of this figure) fits best to experimental curves.
Indexes of refraction n = 1 − δ −k I as published in literature
Apart from reasons of disability to find a suitable theoretical model explaining simultaneously reflectivity of our two multilayer mirrors (eight bi-layers, period 36.1 nm, Sc 18.3 nm, Si 17.8 nm and 14 bi-layers, period 26.3 nm, Sc 13.15 nm, Si 13.15 nm) it was necessary to leave concept of 50% reflectivity of interferometer mirrors and accept new experimental data. Therefore, the test coating was chosen as the final coating for both mirrors, because it has roughly the same reflectivity (~5–8% – even much smaller than originally expected) for both angles of incidence (38.75° and 51.25°).
2.4.5. Mechanical design of the interferometer and the detection
The interferometer mechanical design was largely inspired by the double Lloyd mirror XUV interferometer constructed on PALS installation [Kozlova (Reference Kozlova2009), Margarone et al. (Reference Margarone, Rus, Kozlova, Nejdl, Mocek, Homer, Polan, Stupka, Cassou, Kazamias, Lagron, Ros, Danson and Hawkes2010)]. Unfortunately, due to space problems in our experimental chamber and due to much smaller robustness of our micro-positioners it was inevitable to leave the concept of common platform for both mirrors that can adjust the first mirror (together with the second one) into the beam and then independently to correct the position of the second mirror relative to the first one.
Therefore, our design has fully independent positioning of both mirrors: The first one has X–Y–Z translations (three Agilis AG-LS25V6 piezo linear stages) plus tilting around two axes [vertical (at the gap between mirrors) and horizontal one–Agilis AG-M100LV6 piezo optical mount], the second mirror has the same positioning as the first one (also with the same hardware), but in addition it has rotation around the vertical axis going through the center of the gap (Agilis AG-PR100V6 piezo rotation stage) – see Figure 7.
Mechanical design of the interferometer (mirrors, holders of mirrors, and their micropositioners), target and target holder with its micropositioners, and microscope with its micropositioners (bird's-eye view): The primary beam comes from the observer (left figure) or from the left center and its axis passes above the nut (center of the right figure), where the center of gap between mirrors is. Left: 3D model. Right: 3D reality.
As the detector (target) serves a PMMA plate (thickness 2 mm); its part, facing the mirrors, is covered by 6 nm thick Au layer for contrast enhancement of engraved patterns. The target is fixed in the target holder together with the imaging plate (identical 2 mm thick PMMA plate), the imaging surface of which is in the same plane as an Au-coated surface of the target, but it is sandblasted on its one half, and covered by fluorescence material on the other half. This target holder is mounted on two X–Y–Z translators (each of them consists of three Agilis AG-LS25V6 piezo linear stages): The first positions the target holder with respect to detachable USB microscope Dino-Lite AM7013MZT4 (sensor 5MPix, enlargement 380 × to 470×, illumination 8 LED, working distance 0.2–8.9 mm, field of view 1.04 × 0.78 to 0.84 × 0.63 mm2), the second X–Y–Z translator positions the target holder and microscope with respect to the interferometer.
2.4.6. Alignment procedure
The alignment procedure is relatively complicated: (1) rough adjustment of the mirror positions is adjusted with the help of discharge pre-pulse only [Kolacek et al. (Reference Kolacek, Schmidt, Bohacek, Ripa, Rupasov and Shikanov2003b)] (i.e., with visible light) and sandblasted screen: The mirrors are adjusted to yield a symmetric pattern when target moves from mirrors to their foci and behind them (the intersection of bundles of rays must appear in the center between mirrors and in the horizontal symmetry-plane of the primary ray-bundle and the mirrors); (2) the fine adjustment of mirrors has to be made with XUV laser and fluorescence screen, because laser has much smaller divergence than the cone of visible radiation: The most distant (measuring from the laser output) point of the valley-bottom of the first mirror must lay on the axis of the primary ray-bundle (in other words the first mirror must reflect a half of incoming laser radiation, i.e., reflections from both mirrors must have equal intensity); both these two steps can be performed with photographic registration (e.g., with Canon EOS 550D with Canon Macro Lens EF 100 mm 1:2.8 USM); (3) the final mirrors and target adjustment must be made with microscope detection (e.g., with the above mentioned Dino-Lite): The laser shots must be directed to some point, which is easy to find (e.g., at the target edge, where on neighboring screen the sandblasted part abuts onto the fluorescence one); then the microscope (with field of view 0.84 × 0.63) must find the imprints, the focus of the second mirror is adjusted to the same vertical plane, in which the focus of the first mirror lays; then the target is adjusted to the plane, where both bundles intersect, and this intersection region is then in more detail investigated.
Very unpleasant is the fact that piezoelectric driven micropositioners do not have a fixed step. Therefore, exact position (e.g., of the target with respect to focus) is not exactly known; consequently, any position of any element could not be exactly reached again by reversing number of steps. Finally, the position of stages is not locked, when they do not move. Therefore, any hand-touch (e.g., when changing the target, when microscope is installed, etc.) is risky; on the other hand we have not yet observed any spontaneous movement of micropositioners, for example, due to gravity. For final sorting of craters on the target it is very helpful if each movement of any micropositioner together with each firing the laser are automatically recorded.
2.4.7. The first results
The first and up to the present the last positive result is that imprints on the target in the target-positions well around the foci are visible, despite the small reflectivity of mirrors. However, it was also found that: (1) imaging of laser output by any of interferometer mirrors has some small astigmatism (with astigmatic difference ~400 μm); (2) any imprint (even from single interferometer mirror) is broken by very contrast (nearly 100% modulation depth) interference pattern with periodicity as large as ~3 µm (see Fig. 8). It seems that it is of the same nature as the pattern shown in Figure 1 that was originally erroneously attributed to LIPSS. On such a background it is impossible to detect any other dense (fine) interference pattern that must have much smaller amplitude. Nevertheless, the adjustment procedure described above was completed, the target was placed into the region, where both secondary beams (reflections from ellipsoidal mirrors) intersect each other and the engraved pattern was analyzed by Zygo NewView three-dimensional (3D) Optical Surface Profiler (metrology system based on patented white-light interferometry) – see Figure 9. The pitch of fringes is from ~0.7 to ~1.1 µm (depending on profile selection) and characteristic depth of the pattern is from ~10 to ~50 nm. Despite the pattern is relatively regular, it is not what was expected: The expected pattern should have pitch below 100 nm and its depth will be probably also smaller. Hence, on the background of this idle pattern originating on each of interferometer mirrors the expected pattern is undetectable. Therefore, the primary aim is to find and suppress the mechanism responsible for interference originating on single mirror. One of possible reasons is interference due to spherical aberration to which a “shape imperfection” caused by super-polishing can be added. The reduction of beam diameter prior to reflection on spherical mirror has been tested: In the laser beam, ~50 cm in front of spherical mirror, an iris diaphragm (with its center on the beam axis) was placed; there the beam diameter is ~15 mm. Then the laser beam was reflected by focusing multilayer mirror (Ø40 mm/f = 1050 mm) and directed to the Au-covered PMMA target, where it was additionally attenuated by Ar atmosphere (to be sure that imprinting process is realized in the “desorption regime”). It turned out that the interference pattern persists in the imprinted spots down to very small iris-diaphragm diameters and only at diaphragms smaller than Ø~3 mm it disappears (see Fig. 10). Another reason, why interference pattern appears on the imprint, may be interference on multilayer structure of the focusing mirror. For testing this hypothesis the same spherical focusing mirror (Ø40 mm/f = 1050 mm) was prepared, but without multilayer reflecting structure. It turned out that even in this low-reflectivity case our extremely powerful laser generated on the Au-covered PMMA a visible imprint. Its inspection by visible-light microscopy did not reveal any microstructure, but investigation by atomic force microscope (AFM) confirmed presence of interference pattern (see Fig. 11). Therefore, the most probable source of idle interference patterns appearing in craters dug by XUV radiation focused by single mirror is the spherical aberration of this mirror to which “shape imperfection” caused by super-polishing adds. Obviously, the mirror inspection made by visible light is not sufficient for working wavelengths of the XUV region, where these wavelengths are for order of magnitude shorter. Therefore, it seems that the only solution is to use a smaller diameter (<3 mm) of XUV beam to minimize the effect of the above-mentioned factors.
The interference pattern (pitch of fringes ~3 µm) engraved into PMMA surface by pulse of XUV radiation reflected by the single semi-ellipsoidal mirror. Two deep ditches going from the top-left corner to the bottom-right one are images of two wires placed in the beam for measuring purposes.
The interference pattern (pitch of fringes from ~0.7 to 1.1 µm, characteristic depth of the pattern from ~10 to ~50 nm) engraved into PMMA surface by single pulse of XUV radiation reflected by both semi-ellipsoidal mirrors. Left column: 2D images with the lines, along which the pitch of fringes was measured. Right column: 3D images. Upper row: Nearly the whole footprint. Lower row: Zoomed image.
Imprints on the target surface imaged by visible microscopy at oblique white light illumination. The iris–diaphragm diameters were (a) 17.7 mm, (b) 11.1 mm, (c) 2.8 mm, and (d) 1.1 mm; pressures of the attenuating Ar gas in the target region were (a) ~1 Pa, (b) ~1 Pa, (c) 1 × 10⁻¹ Pa, and (d) 1 × 10⁻³ Pa. On the right sides of the imprints (a) and (b), the interference pattern is clearly visible; the same patterns can be seen on their left sides at different illumination. On imprints (c) and (d) no interference pattern has been found (False colors.).
Imprint on the target surface produced by the XUV laser radiation that was focused by the bare fused silica substrate (Ø40 mm/f = 1050 mm). The imprint is imaged by AFM microscope. The interference pattern is clearly visible.
3. CONCLUSION
The direct nanostructuring by XUV laser pulses of nanosecond duration is very promising: On the one side it can use the fluency range that belongs to desorption regime only (similarly as nanostructuring by femtosecond pulses), but in contrast to femtosecond pulses the particle-removal efficiency is much higher due to the fact that many atomic and molecular bonds on/at the target surface are broken already during the laser pulse. Therefore, in some cases, this direct nanostructuring can substitute a multi-step process with photoresist.
The XUV produced nanostructures has been divided to spontaneously appearing (like LIPSS and diffraction patterns) and artificial (like de-magnifying projections and interference patterns), the shape and parameters of which it is possible to control in some extend.
The new type of wave-front-division XUV interferometer has been designed, developed, assembled, and tested. It reaches maximum attainable fluency in the interference field (for direct nanostructuring), and it should have as dense as possible interference pattern for sufficient spatial resolution.
The first test of the interferometer showed that the observed interference pattern is a superposition of interference patterns originating independently on both interferometer mirrors most probably due to spherical aberrations and/or surface imperfections. A similar interference pattern has been found in the craters dug in PMMA during our latest verifying tests with spherical focusing mirror as well as during our first focusing experiments with similar spherical focusing mirror. Therefore, it seems that this interference pattern generated by large-diameter XUV beam can be counted to spontaneously appearing features that totally covers/spoils the expected results. An analysis of these features may be a subject of future research that can also positively influence next focusing and imaging experiments.
ACKNOWLEDGEMENT
This work was performed under auspices and with the support of the Grant Agency of the Czech Republic (contract no. 14-29772S).