1. INTRODUCTION
Scientific data in domains such as materials science is often analyzed in the context of domain-specific applications. An example is computational estimation, where the results of experiments are estimated without conducting real experiments in a laboratory. Another application is failure diagnostics, where existing cases are used to diagnose causes of failures such as distortion in materials. A related application is predictive analysis, where process variables are predicted a priori to assist parameter selection so as to optimize the real processes.
This paper describes the use of mathematical and heuristic approaches in such scientific data analysis. The goal is to perform a comparative study between these two approaches. We consider a domain-specific computational estimation problem. The domain of focus is the heat treating of materials (Stolz, Reference Stolz1960). The result of a heat treating experiment is plotted as a heat transfer curve. Scientists are interested in estimating this curve given experimental input conditions (Sisson et al., Reference Sisson, Maniruzzaman and Ma2004). We present a detailed study of selected mathematical and heuristic approaches as potential solutions to this problem.
Mathematical models for estimation are based on formulae derived from theoretical calculations (Stolz, Reference Stolz1960; Beck et al., Reference Beck, Blackwell and St. Clair1985). They provide definite solutions under certain situations. However, existing mathematical models are often in applicable under certain circumstances (Maniruzzaman et al., Reference Maniruzzaman, Varde and Sisson2006). For example, in heat treating there is a direct–inverse heat conduction model for estimating heat transfer curves (Beck et al., Reference Beck, Blackwell and St. Clair1985). However, if the real experiment is not conducted, this model requires initial time–temperature inputs to be given by domain experts each time the estimation is performed. This is not always feasible.
Heuristic methods are often based on approximation. A heuristic by definition is a rule of thumb likely to lead to the right answer but not guaranteed to succeed (Russell & Norvig, Reference Russell and Norvig1995). However, heuristic methods are applicable in some situations where mathematical models cannot be used or do not provide adequate solutions. In our earlier work (Varde et al., Reference Varde, Rundensteiner, Ruiz, Brown, Maniruzzaman and Sisson2006b) we have proposed a heuristic approach based on integrating the data mining techniques of clustering and classification as a solution to a computational estimation problem. When applied to estimating heat transfer curves, this approach works well in many situations where mathematical models in heat treatment are not found to be satisfactory because of lack of inputs.
In this paper, we present a comparative study between mathematical and heuristic approaches in estimation taking into account sample space, time complexity, and data storage. Sample space refers to the number of experiments that can be estimated under various conditions. Time complexity relates to the computation of the mathematical models or heuristic methods in terms of execution time. Data storage refers to the amount of data stored in the database in each approach.
We also provide performance evaluation with real data from the heat treating domain considering accuracy and efficiency. The accuracy of the estimated results refers to how close the estimation is to the result of a real laboratory experiment. The efficiency of the approach relates to how fast it can perform the estimation.
It is found that both mathematical and heuristic approaches have their advantages and disadvantages. For the given estimation problem in this paper, we find that heuristic methods are generally better than existing mathematical models.
The arguments made for computational estimation can also be considered valid in the context of the other applications such as failure diagnostics tools (Scientific Forming Technologies, 1995) and predictive analysis systems (Varde et al., Reference Varde, Takahashi, Rundensteiner, Ward, Maniruzzaman and Sisson2004). Detailed discussion about each of these is beyond the scope of this paper.
The following contributions are made in this work:
1. A description of mathematical and heuristic approaches in computational estimation.
2. A comparative study based on sample space, time complexity, and data storage.
3. A performance evaluation with real data from the heat treating of materials.
The rest of this article is organized as follows. Section 2 explains the computational estimation problem. Section 3 describes a mathematical approach to solve the given problem, and Section 4 describes a heuristic solution. Section 5 presents a comparative assessment of the approaches with respect to sample space, data storage, and time complexity. Section 6 discusses the performance evaluation of each approach in terms of accuracy and efficiency. Section 7 outlines related work. Section 8 states the conclusions.
2. COMPUTATIONAL ESTIMATION PROBLEM
In scientific domains such as materials science and mechanical engineering, experiments are performed in the laboratory with specified input conditions and the results are often plotted as graphs. The term graph in this paper refers to a two-dimensional plot of a dependent versus an independent variable depicting the behavior of process parameters. These graphs serve as good visual tools for analysis and comparison of the processes. Performing real laboratory experiments and plotting such graphs consumes significant time and resources, motivating the need for computational estimation.
We explain this with an example from the domain of heat treating of materials that inspired this work. Heat treating is a field in materials science that involves the controlled heating and rapid cooling of a material in a liquid or gas medium to achieve desired mechanical and thermal properties (Stolz, Reference Stolz1960).
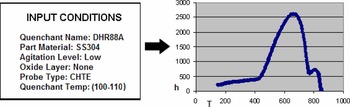
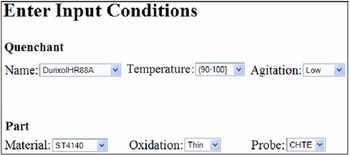
Figure 1 shows an example of the input conditions and the resulting graph in a laboratory experiment in quenching, namely, the rapid cooling step in heat treatment (Stolz, Reference Stolz1960). The quenchant name refers to the cooling medium used, for example, T7A and HoughtoQuenchG. The part material name incorporates the characteristics of the part such as its alloy content and composition, for example, ST4140 and Inconel600. Note that the part may have thick, thin, or no oxide layer on its surface. A sample of the part called the probe is used for quenching, and has certain shape and dimensions characterized by the probe type. During quenching, the quenchant is maintained at a given temperature and may be subjected to a certain level of agitation, that is, high or low. All these parameters are recorded as input conditions of the quenching experiment.
An example of input conditions and a graph. [A color version of this figure can be viewed online at http://www.journals.cambridge.org]

The result of the experiment is plotted as a graph called a heat transfer coefficient curve. This depicts the heat transfer coefficient h versus part temperature T. The heat transfer coefficient measures the heat extraction capacity of the process, and depends on the cooling rate and other parameters such as part density, specific heat, area, and volume. The heat transfer curve characterizes the experiment by representing how the material reacts to rapid cooling (Stolz, Reference Stolz1960).
For instance, in the material ST4140, which is a kind of steel, heat transfer coefficient curves with steep slopes imply fast heat extraction capacity. The corresponding input conditions could be used to treat this steel in an application that requires such a capacity. Materials scientists are interested in this type of analysis to assist decision making about corresponding processes.
However, to perform such analysis, conducting the actual experiment in the laboratory takes 5–6 h. The concerned resources require a capital investment of thousands of dollars and recurring costs worth hundreds of dollars (Sisson et al., Reference Sisson, Maniruzzaman and Ma2004).
It is thus desirable to computationally estimate in an experiment the resulting graph given the input conditions. The estimation problem is as follows:
• Given: the input conditions of a scientific experiment
• Estimate: the resulting graph depicting the output of the experiment
We describe the solutions to this estimation problem taking into account mathematical and heuristic approaches.
3. MATHEMATICAL MODELING APPROACH
Mathematical models are often derived in a domain-specific manner. We explain mathematical modeling with reference to the problem of estimating heat transfer curves (Ma et al., Reference Ma, Maniruzzaman and Sisson2004; Maniruzzaman et al., Reference Maniruzzaman, Varde and Sisson2006). This problem translates to estimating heat transfer coefficients as a function of temperature. The estimation method presented here is based on the extension of the sequential function specification method (Beck et al., Reference Beck, Blackwell and St. Clair1985).
The mathematical model we describe relates to processes known as direct and inverse heat conduction (Stolz, Reference Stolz1960). Although there are other mathematical models in the literature, we discuss just this model in detail. The arguments applied here in the context of comparative analysis can also be extended in principle to other mathematical models.
3.1. The direct problem
The first step of the analysis is to develop a direct solution for the heat conduction problem, that is, to determine probe temperature given other input conditions. We consider a one-dimensional, nonlinear heat conduction problem in a cylindrical coordinate system. The Center for Heat Treating Excellence (CHTE) probe (3/8-in. diameter, 1.5-in. length) is used in this study (Ma et al., Reference Ma, Maniruzzaman and Sisson2004).
The differential heat equation can be expressed as

with boundary conditions


and initial condition

Here, T(r, t) is the temperature, which is the function of radius and time; h is the heat transfer coefficient; T ∞ is the quenchant temperature; and k and α are the respective thermal conductivity and thermal diffusivity of the material being studied.
The direct problem is thus concerned with calculating the probe temperature at the different locations when the surface heat transfer coefficient, specific heat, thermal conductivity, and boundary conditions are known. The above direct heat conduction problem is solved using a technique called the finite difference method. This method is explained in detail in Ma et al. (Reference Ma, Maniruzzaman and Sisson2004).
3.2. The inverse problem
The next step of the analysis is known as the inverse problem. In this problem, the surface heat transfer coefficient h(T) is regarded as being unknown, but everything else in Eqs. (1a) –(1d) is known. In addition, the temperature readings at the geometric center of the probe from the quenching experiment are considered available. Let the temperature reading be denoted by Y(0, t). Then the estimation of surface heat transfer coefficient can be obtained by minimizing the following functional:
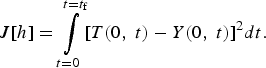
where J[h] is the functional to be minimized, T(0, t) is the calculated temperature at the geometric center of the probe obtained by solving the direct problem using a finite difference method, Y(0, t) is the experimentally measured temperature, and t f is the final time for the whole quenching process.
3.3. Steepest descent method (SDM)
The SDM is an iterative process used for the estimation of the transient heat transfer coefficient. This method primarily involves minimizing the J[h] functional. The computational procedure to implement this method will be explained Section 3.4.
In this method the change in heat transfer coefficient from computation step n to n + 1 can be expressed as

Here, βn is the search step size in going from iteration n to n + 1, and P n is the direction of descent (i.e., search direction) given by

To determine the search step and the search direction, we need two concepts, namely, a sensitivity problem and an adjoint problem.
3.3.1. Sensitivity problem
The sensitivity problem involves replacing T with T + ΔT in the direct heat conduction differential equation, then subtracting the direct problem from the resultant expression and neglecting the second-order terms.



Here, Eq. (5a) is the differential equation for the sensitivity problem, Eqs. (5b) and (5c) are used for the boundary conditions, and Eq. (5d) is the initial condition. This sensitivity problem can also be solved by a finite difference method. The functional can be rewritten as follows:

If the temperature term T(h n − βnP n) is linearized by a Taylor expansion, then the above equation takes the form

Taking the first-order derivative of the J[h n+1] expression in terms of βn, then the search step size can be expressed as

The sensitivity problem ΔT can be solved using Eqs. (5a)–(5d) by letting Δh = P n, T(0, t) is the solution from the direct problem, and Y(0, t) is taken from the experiment (Ma et al., Reference Ma, Maniruzzaman and Sisson2004).
3.3.2. Adjoint problem
The theorem of the adjoint problem can be explained as follows. The minimum or maximum of function f(x) subject to the constraints function g j(x) that is not on the boundary of the region where f(x) and g j(x) are defined can be found by introducing p new parameters λ1, λ2, … , λp and solving the system

In our case, because there is only one constraint function, the adjoint problem is formed by multiplying Eq. (9a) by the Lagrange multiplier λ(r, t), integrating over the whole space and time domain and adding the functional. The following expression results:
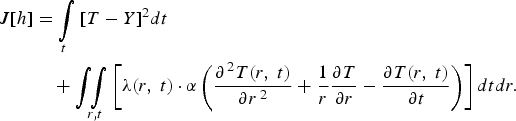
Similar to the formation of the sensitivity problem, ΔJ is obtained by perturbing h by Δh and T by ΔT in Eq. (9b), subtracting from the resultant expression, and neglecting the second-order terms.

Green's second identity is applied to the second term in Eq. (10), the initial and boundary conditions for the sensitivity problem (5b)–(5d) are utilized, and the integral term including ΔT is allowed to go to zero. The adjoint problem can be formulated as follows:

With final and boundary conditions


Note that the adjoint problem is a final condition problem, which means λ = 0 at t = t f, instead of the regular initial condition problem, but the final condition problem can be transformed into the initial condition problem by letting τ = t f − t.
After the introduction of the adjoint problem, the following term is left from the functional expression:

From the definition of the search step size βn,

Comparing Eqs. (12) and (13), the following expression for the gradient of the functional is the result:

3.3.3. Stopping criterion
From Huang et al. (Reference Huang, Yuan and Ay2003) the traditional check condition is specified as

where the stopping criteria ɛ is a small value. This check conditions assumes that there are no errors is measurement. However, in practice, the measured temperature data may contain errors. Therefore, the stopping criteria ɛ is obtained as follows by using a discrepancy principle, which takes the standard deviation into account:

Here σ is the standard deviation of the measurement, which is assumed to be a constant.
3.4. Computational procedure
The computational procedure Ma et al. (Reference Ma, Maniruzzaman and Sisson2004) for the solution of the problem by SDM can be summarized as follows:
1. Pick an initial guess for h at iteration n for all the time steps.
2. Solve the direct problem T(r, t) given by Eqs. (1a)–(1d) for all the time steps using the guessed h at iteration n as the boundary condition.
3. Examine the stopping criteria indicated by Eq. (16), continue if not satisfied.
4. Solve the adjoint problem λ(r, t) given by Eqs. (11a)–(11d).
5. Calculate gradient of functional J′[h] in Eq. (14) and search direction in Eq. (4).
6. Solve the sensitivity problem ΔT(r, t) given by Eqs. (5a)–(5d) by letting Δh = P n.
7. Compute the search step size βn from Eq. (8).
8. Estimate the new h n+1 from Eq. (3) and return to step 1.
This summarizes the mathematical approach for solving the computational estimation problem. We now explain our heuristic approach.
4. HEURISTIC APPROACH BASED ON DATA MINING
The term heuristic originates from the Greek word heureskein, meaning “to find” or “to discover” (Russell & Norvig, Reference Russell and Norvig1995). Newell et al. (Reference Newell, Shaw, Simon and Levy1988) stated that “A process that may solve a given problem but offers no guarantees of doing so is called a heuristic for that problem.” Nevertheless, heuristic methods in the literature often provide good solutions to many problems.
We have proposed a heuristic estimation approach called AutoDomainMine (Varde et al., Reference Varde, Rundensteiner, Ruiz, Brown, Maniruzzaman and Sisson2006b). The assumption in this approach is that data from existing experiments has been stored in a database.
4.1. AutoDomainMine: A heuristic approach for estimation
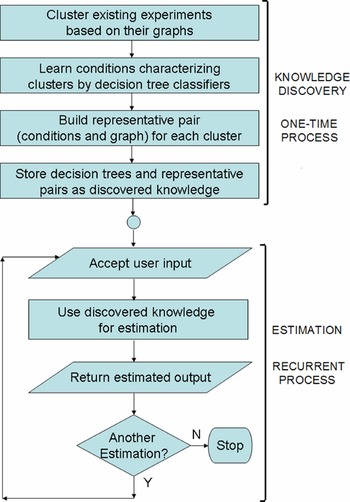
The AutoDomainMine approach is based on data mining. It involves a one-time process of knowledge discovery from previously stored data and a recurrent process of using the discovered knowledge for estimation. This approach is illustrated in Figure 2.
The AutoDomainMine approach. [A color version of this figure can be viewed online at http://www.journals.cambridge.org]

AutoDomainMine discovers knowledge from existing experimental data by integrating the two data mining techniques of clustering and classification. It follows a typical learning strategy of materials scientists. They often perform analysis by grouping experiments based on the similarity of the resulting graphs and reasoning about the causes of similarity group by group in terms of the impact of the input conditions on the graphs (Sisson et al., Reference Sisson, Maniruzzaman and Ma2004). This learning strategy is automated for knowledge discovery in AutoDomainMine (Varde et al., Reference Varde, Rundensteiner, Ruiz, Brown, Maniruzzaman and Sisson2006b). Clustering is the process of placing a set of objects into groups of similar objects (Han & Kamber, Reference Han and Kamber2001). This is analogous to the grouping of experiments done by scientists. Classification is a form of data analysis that can be used to extract models to predict categories (Mitchell, Reference Mitchell1997). An analogy can be drawn here with the scientists reasoning about the similarity group by group. Hence, the two data mining techniques are integrated for knowledge discovery as described below.
4.2. Knowledge discovery in AutoDomainMine
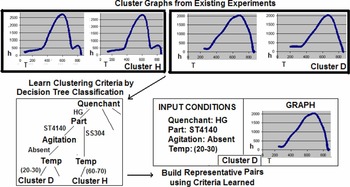
The knowledge discovery process is shown in Figure 3. Clustering is first performed over the graphs obtained from existing experiments. Any clustering algorithm in the literature can be used such as the k-means algorithm (MacQueen, Reference MacQueen1967). We use a semantics-preserving distance metric as the notion of distance in clustering (Varde et al., Reference Varde, Rundensteiner, Ruiz, Maniruzzaman and Sisson2005). Once the clusters of experiments are identified (e.g., H and D), the clustering criteria, namely, the input conditions that characterize each cluster are learned by decision tree classification (Quinlan, Reference Quinlan1986). This helps understand the relative importance of conditions in clustering. The decision tree paths and the clusters they lead to are used to design a domain-specific representative pair of input conditions and graph per cluster (Varde et al., Reference Varde, Rundensteiner, Ruiz, Brown, Maniruzzaman and Sisson2006a). The decision trees and representative pairs form the discovered knowledge used for estimation.
AutoDomainMine—knowledge discovery. [A color version of this figure can be viewed online at http://www.journals.cambridge.org]

4.3. Estimation in AutoDomainMine
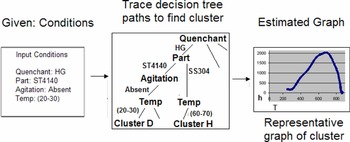
The process of estimation is shown in Figure 4. To estimate a graph, given a new set of input conditions, the decision tree is searched to find the closest matching cluster. The representative graph of that cluster is the estimated graph for the given set of conditions. If a complete match cannot be found then partial matching is done based on the higher levels of the tree using a domain-specific threshold (Varde et al., Reference Varde, Rundensteiner, Ruiz, Brown, Maniruzzaman and Sisson2006b). Note that this estimation incorporates the relative importance of conditions identified by the decision tree.
AutoDomainMine—estimation. [A color version of this figure can be viewed online at http://www.journals.cambridge.org]

4.4. Details of AutoDomainMine
4.4.1. Distance metric learning
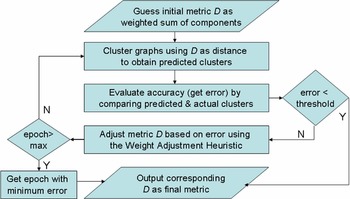
A significant issue in AutoDomainMine is capturing the semantics of the concerned graphs during clustering. Several distance metrics such as Euclidean and statistical distances exist in the literature (Han & Kamber, Reference Han and Kamber2001). However, it is not known a priori which metric(s) would best preserve semantics if used as the notion of distance in clustering. Experts at best have vague notions about the relative importance of regions on the graphs but do not have a defined metric. State-of-the-art distance learning approaches (e.g., Hinneburg et al. Reference Hinneburg, Aggarwal and Keim2000, Xing et al., Reference Xing, Ng, Jordan and Russell2003) are either not applicable or not accurate enough in this context. We therefore propose an approach called LearnMet (Varde et al., Reference Varde, Rundensteiner, Ruiz, Maniruzzaman and Sisson2005) to learn semantics-preserving distance metrics for graphs. This is illustrated in Figure 5.
The LearnMet approach. [A color version of this figure can be viewed online at http://www.journals.cambridge.org]

A LearnMet metric D is a weighted sum of components where each component is an individual metric such as Euclidean distance, statistical distance, or a domain-specific critical distance (Varde et al., Reference Varde, Rundensteiner, Ruiz, Maniruzzaman and Sisson2005), and its weight gives its relative importance in the domain. LearnMet iteratively compares a training set of actual clusters given by experts with predicted clusters obtained from any fixed clustering algorithm, for example, k-means (MacQueen, Reference MacQueen1967). In the first iteration, a guessed metric D is used for clustering using fundamental knowledge of the domain. This metric is adjusted based on error between predicted and actual clusters using a weight adjustment heuristic (Varde et al., Reference Varde, Rundensteiner, Ruiz, Maniruzzaman and Sisson2005) until error is below a given threshold or a maximum number of epochs is reached. The metric with error below threshold or with minimum error among all epochs is returned as the learned metric. The output of LearnMet is used as the notion of distance for the graphs.
4.4.2. Designing cluster representatives
Another important issue in AutoDomainMine is capturing relevant data in each cluster while building representatives. A default approach of randomly selecting a representative pair of input conditions and graph per cluster is not found to be effective in preserving the necessary information. Because several combinations of conditions lead to a single cluster, randomly selecting any one as a representative causes information loss. Randomly selected representatives of graphs do not incorporate semantics and ease of interpretation based on user interests.
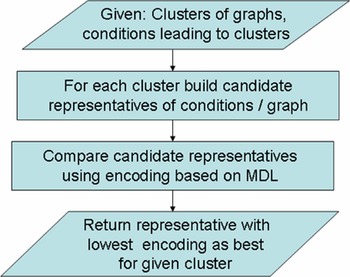
State-of-the-art approaches (e.g., Helfman & Hollan, Reference Helfman and Hollan2001; Janecek & Pu, Reference Janecek and Pu2004), do not build cluster representatives as appropriate for our needs. Hence, we propose an approach called DesRept (Varde et al., Reference Varde, Rundensteiner, Ruiz, Brown, Maniruzzaman and Sisson2006a) to design domain-specific cluster representatives. This approach is depicted in Figure 6.
The DesRept approach. [A color version of this figure can be viewed online at http://www.journals.cambridge.org]

In DesRept, two design methods of guided selection and construction are used to build candidate representatives showing various levels of detail in the cluster, where each candidate captures a certain aspect of domain semantics. Candidates are compared using our proposed DesRept encodings for conditions and graphs analogous to the minimum description length principle (Rissanen, Reference Rissanen1987). In minimum description length, the goal is to minimize the sum of encoding a theory and examples using the theory. In DesRept, the theory refers to a cluster representative, whereas the examples refer to the other objects within the cluster. Thus, a DesRept encoding consists of the sum of storing a cluster representative and the distance of all other cluster objects from that representative. In correspondence, the criteria in the DesRept encodings are complexity of the representative itself and information loss based on its distance from other cluster objects. Weights are assigned to these two criteria based on user interests in targeted applications. The winning candidate for each cluster is considered to be the one with the lowest encoding. This candidate is returned as the designed cluster representative. The designed representatives are used for estimation in the AutoDomainMine approach (Varde et al., Reference Varde, Rundensteiner, Ruiz, Brown, Maniruzzaman and Sisson2006b).
4.4.3. Implementation of heuristic approach
The main tasks in implementing this heuristic estimation approach based on data mining are described below. The programming language used for implementation is Java with MySQL for the databases.
• The learning strategy in AutoDomainMine of discovering knowledge for estimation by integrating clustering and classification is implemented using the k-means algorithm for clustering (MacQueen, Reference MacQueen1967) and the J4.8 algorithm for decision tree classification (Quinlan, Reference Quinlan1986). Parameters in these algorithms such as the values of k are variable and are altered during the evalution of the approach as will be elaborated in Section 6.
• LearnMet is implemented for learning semantics-preserving distance metrics for graphs, in particular, its weight adjustment heuristic. The clustering algorithm used within LearnMet is also k-means (MacQueen, Reference MacQueen1967).
• DesRept is implemented for designing domain-specific cluster representative pairs along with the DesRept Encodings for evaluating them. The clusters are obtained from the k-means algorithm (MacQueen, Reference MacQueen1967) and the decision tree paths leading to the clusters are obtained using the J4.8 algorithm for decision tree classification (Quinlan, 1967).
Thus, the AutoDomainMine approach has been used to build a software tool called AutoDomainMine (Varde et al., Reference Varde, Rundensteiner, Ruiz, Brown, Maniruzzaman and Sisson2006b), which is a trademark of the CHTE that supported this research. This approach has been rigorously evaluated with real data from the heat treating domain with the help of formal user surveys. It has been found to provide effective estimation as per the requirements of the users.
5. COMPARATIVE STUDY
We now compare the approaches based on sample space, time complexity, and data storage.
5.1. Sample space
The sample space of any estimation problem is the number of cases it can estimate (Russell & Norvig, Reference Russell and Norvig1995). We explain the calculation of the sample space with reference to our estimation problem.
5.1.1. Sample space calculation
The sample space is calculated as a product of the number of possible values of each experimental input condition. Each input condition is described by an attribute that gives its name and a value that gives its content. Thus, we have, sample space

where A is the total number of attributes (conditions) and V c is the number of possible values of the conditions.
Consider the example of estimating heat transfer curves. In this example, the input conditions are the following:
1. quenchant name: T7A, DurixolV35, and so forth
2. part material: ST4140, SS304, and so forth
3. agitation level: absent, high, low
4. oxide layer: none, thin, thick
5. probe type: CHTE, IVF, and so forth
6. quenchant temperature: 0°–200°C
Note that there are 500 experiments stored in the database. The number of possible values of each of these based on the stored experiments is as follows:
1. quenchant name: nine values
2. part material: four values
3. agitation level: three values
4. oxide layer: three values
5. probe type: two values
6. quenchant temperature: 20 ranges
Thus, the total sample space provided by the 500 stored experiments is given by a product of these values. Hence, we have sample space = 9 × 4 × 3 × 3 × 2 × 20 = 12,960.
We now discuss this with reference to our mathematical and heuristic approaches.
5.1.2. Mathematical approach
In this approach, the estimation of heat transfer coefficients is performed using the direct and inverse heat conduction equations. However, to apply these equations, data on time and temperature is needed. If the real laboratory experiment is not conducted then this data is typically supplied by domain experts (Maniruzzaman et al., Reference Maniruzzaman, Varde and Sisson2006).
Thus, in this process domain expert intervention is needed each time the estimation is performed. Thus, to cover a sample space of 12,960 experiments, the domain experts would need to provide the time–temperature inputs 12,960 times, which seems rather infeasible. Besides the fact that supplying these inputs is time consuming and cumbersome, it is not always possible for the experts to guess them based on experimental input conditions. This is a major drawback of the mathematical approach related to sample space.
However, a major advantage of this approach is that no other data on previous experiments needs to be stored in advance to cover this sample space. The state of the art formulae can be directly applied.
The advantage and disadvantage are further clarified as we discuss the heuristic solution.
5.1.3. Heuristic approach
The heuristic solution approach to the given estimation problem is AutoDomainMine (Varde et al., Reference Varde, Rundensteiner, Ruiz, Brown, Maniruzzaman and Sisson2006b). In this approach, when the input conditions of a new experiment are submitted, the decision tree paths are traced to find the closest match. The representative graph of the corresponding cluster is conveyed as the estimated result. When an exact match is not found, a partial match is conveyed using higher levels of the tree. Thus, even if data on all the possible combinations of inputs is not available, an approximate answer can still be provided.
Hence, to cover the sample space of the estimation it is not necessary to supply time–temperature data for each new experiment whose results are to be estimated. The estimation can be performed simply by supplying the input conditions of the new experiment. Thus, the whole sample space of 12,960 experiments can be covered without domain expert intervention each time the estimation is performed. This is an advantage of the heuristic approach with reference to the sample space criterion.
However, to perform the estimation in AutoDomainMine, data from existing laboratory experiments needs to be stored in the database. This forms the basis for knowledge discovery and estimation. This is a drawback of the heuristic approach. However, the amount of data from existing experiments can be much lower than the sample space. For example, in heat treating the number of experiments stored is 500. With this, AutoDomainMine gives an accuracy of approximately 90–95%, as elaborated later in this paper.
5.2. Time complexity
The time complexity of any approach refers to the execution time of the technique used for computation. We discuss this with reference to the mathematical and heuristic approaches.
5.2.1. Mathematical approach
In the direct–inverse heat conduction mathematical model, the time complexity t M(E) of each estimation (Ma et al., Reference Ma, Maniruzzaman and Sisson2004) is given as

where n is the number of time–temperature data points supplied and i is the number of iterations for convergence to minimal error. Each such data point corresponds to measurement of heat transfer coefficient at one instance of time.
In the given problem the maximum number of data points supplied would be 1500 and the minimum number would be 25. On an average, 100 data points are supplied. The number of iterations for convergence is typically found to be on the order of 100 (Ma et al., Reference Ma, Maniruzzaman and Sisson2004).
Thus, we have the following time complexities. Worst case:

average case:

best case:

Because the data points need to be provided for each estimation, the time complexity t M(S) over the whole sample space S is given by

where t M(E) is the time complexity of each estimation.
Thus, we have the following time complexities over the whole sample space for the worst, average, and best cases. Worst case:

average case:

best case:

Given a sample space of S = 12,960, it is clear that these time complexities are huge.
5.2.2. Heuristic approach
In the heuristic approach AutoDomainMine, the knowledge discovery process of clustering followed by classification is executed one time, whereas the estimation process of searching the decision tree paths to find the closest match is recurrent. The complexities of each are calculated as follows.
Consider t H(D) to be the time complexity of the knowledge discovery process in the heuristic approach. This is calculated as the sum of the time complexities of the clustering and classification step. We use k-means clustering (MacQueen, Reference MacQueen1967) and decision tree classification with J4.8 (Quinlan, Reference Quinlan1986). The complexities of these respective algorithms are used to compute the complexity of the knowledge discovery process in AutoDomainMine. Thus, given that g is the number of graphs (experiments) in the database, k is the number of clusters, and i is the number of iterations in the clustering algorithm, from a study of the literature (Han & Kamber, Reference Han and Kamber2001; Russell & Norvig, Reference Russell and Norvig1995) we have

where

and

Hence,

Now consider that the time complexity of each estimation in the heuristic approach is t H(E). The manner in which the estimation is performed in AutoDomainMine is by searching the decision tree paths to find the closest match with the given input conditions of a new experiment. We find that this search problem in general has a complexity of O(log10N), where N is the number of entries in the database from which the tree was generated (Gehrke et al., Reference Gehrke, Ramakrishnan and Ganti1998). Thus, in our context this translates to O(log10N), because g is the number of graphs in the database that equal the number of experiments (i.e., database entries). Thus,

Hence, given a sample space S, the time complexity t H(S) over the whole space is calculated as

where t H(D) is the complexity of knowledge discovery (one time) and t H(E) is the complexity of each estimation (recurrent).
Thus, from the calculation of the time complexities t H(D) and t H(E), we get

where g is the number of graphs (experiments) in the database, k is the number of clusters, and i is the number of iterations in the clustering algorithm. Given this, we consider the time complexities in the best, average, and worst case in our problem.
Note that the maximum value of g is equal to all the experiments in the database, that is, 500 in this context. The minimum value of g is empirically set to be at least one-fifth of the total number of experiments. Thus, g is at least 100. The average value for g is considered to be half the total number of experiments, that is, g = 250 in the average case. The number of clusters k is usually set close to the square root of the number of graphs g because this value is found to yield the highest classifier accuracy. Thus, for g = 500, k = 22; for g = 250, k = 16; and for g = 100, k = 10. The number of iterations in the clustering algorithm is found to be typically of the order of 10 (Varde et al., Reference Varde, Rundensteiner, Ruiz, Brown, Maniruzzaman and Sisson2006b). Given this, we have the following time complexities in the worst, average, and best cases. Worst case:

average case:

best case:

Therefore, the order of these complexities is logarithmic, as opposed to exponential in Eqs. (v-a)–(v-c) of the mathematical approach. Hence, it is clear that the worst case, average case, and best case time complexities in the heuristic approach are much lower than the respective complexities in the mathematical modeling approach. This is a considerable advantage of the heuristic method.
5.3. Data storage
The data storage criterion refers to the quantity of data that needs to be stored from existing experiments to execute the approach.
5.3.1. Mathematical approach
This approach uses the applicable formulae and the inputs supplied by domain experts each time the estimation is performed. No data from previously performed experiments is utilized in the computation. Hence, in theory, the quantity of data stored for this approach is zero. Thus, given that Q refers to the quantity of data, we find that in the mathematical model, Q = 0. This is a big advantage of the mathematical approach.
However, note that the experts, although providing initial time–temperature inputs to this model, may refer to existing experiments. Thus, in practice, data stored from previously performed experiments could perhaps be useful in mathematical modeling, but this data storage is not a requirement of the model per se, which gives this approach an edge over the heuristic approach.
5.3.2. Heuristic approach
This uses the existing experiments in the database for knowledge discovery and estimation. Given that g is the number of graphs (experiments) in the database, n is the number of data points stored per graph, and A is the number of attributes stored for each experiment, the quantity Q of data stored in the heuristic approach is given as

The heuristic approach cannot work without data from previous experiments. This is one of the situations where the mathematical model wins over the heuristic method.
Theoretically, there is no bound on the minimum quantity of data that needs to be stored in order to perform the estimation heuristically. However, the more the data from existing experiments, the more accurate is the estimation. This is because a greater number of experiments are available for knowledge discovery by clustering and classification and a greater number of decision tree paths can be searched for estimation. In addition, the more distinct the input conditions are, the better it is for the heuristic approach. This is because a greater number of distinct paths can be identified in the decision tree to more classify new experiments.
Note that in scientific domains experiments are often designed using the Taguchi metrics (Roy et al., Reference Roy2001). In Taguchi design, experimental parameters are intelligently selected such that one experiment can effectively cover approximately three experiments in terms of the ranges of the inputs and the corresponding results. This enhances the sample space. It is therefore desirable that Taguchi metrics be used for the experimental setup to provide more data for the heuristic approach.
6. PERFORMANCE EVALUATION
The approaches have been evaluated for accuracy and efficiency with real data from the domain of heat treating of materials. A summary of the evaluation is presented here.
6.1. Accuracy
Accuracy is a quality measure that refers to how close the estimated result is to the output of a real experiment. Evaluation of accuracy is explained with reference to each approach individually.
6.1.1. Mathematical approach
We present excerpts from the study of the accuracy of the mathematical approach. The objective of the study is to predict the surface heat transfer coefficient from the known temperature at the geometric center of the CHTE probe. In this study a few numerical examples are presented below to illustrate the ability of the SDM in predicting the surface heat transfer coefficient.
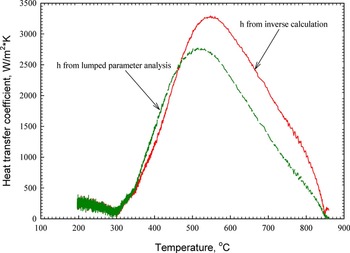
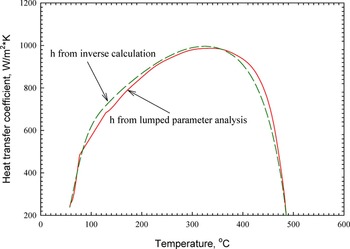
The first test case shows a CHTE ST4140 cylindrical probe with 3/8-in. diameter and 1.5-in. length quenched in the mineral oil Houghton G. Specific heat and thermal conductivity as a function of temperature are utilized in the calculation. Figure 7 shows the heat transfer coefficient h(T) from two methods, namely, lumped parameter analysis (Ma et al., Reference Ma, Maniruzzaman and Sisson2002) and the inverse analysis described here.
The heat transfer coefficient for the CHTE ST4140 probe quenched in Houghton G. [A color version of this figure can be viewed online at http://www.journals.cambridge.org]

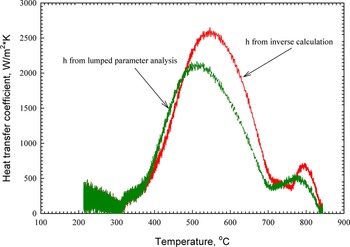
Figure 8 shows another case of the estimated heat transfer coefficient of the same CHTE ST4140 steel probe quenched in mineral oil T-7-A. The difference between Figure 9 and Figure 8 is that the curve in Figure 9 includes the Leidenfrost point, which is one of the important parameters to characterize the quenching process. The selection of this test case is to ensure that the inverse analysis can successfully predict the heat transfer coefficient curve with a Leidenfrost point. Figure 9 shows the comparison results from the lumped parameter analysis and the inverse analysis. The inverse analysis does give a heat transfer coefficient curve with a Leidenfrost point, which shifts to the higher temperature compared with that from the lumped parameter analysis.
The heat transfer coefficient for the CHTE ST4140 probe quenched in T-7-A. [A color version of this figure can be viewed online at http://www.journals.cambridge.org]

The heat transfer coefficient for the CHTE aluminum 2024 probe quenched in Aqua260. [A color version of this figure can be viewed online at http://www.journals.cambridge.org]

The third test case is for a wrought aluminum 2024 probe with the same dimension quenched in polymer solution Aqua 260. The results are shown in Figure 9. As can be seen, the curves from both the lumped parameter analysis and the inverse analysis are almost on top of each other. This is because the thermal conductivity is much higher for aluminum alloy than that for steel, which makes the heat extraction rate much greater for aluminum quenching.
Likewise, several tests are conducted with different input conditions using the 500 laboratory experiments stored in the database. Based on the tests conducted, the domain experts conclude that the estimation accuracy of the mathematical models in general is found to be in the range of approximately 85–90%. This means that in 85–90% of the tests, the estimated result matches the real result of the corresponding laboratory experiment. However, this is subject to the availability of good time–temperature inputs from experts.
6.1.2. Heuristic approach
The accuracy of the heuristic model is evaluated with formal surveys conducted by the targeted users of the system. The users run tests with the AutoDomainMine tool. These tests are conducted using various values of experimental parameters. The clustering seeds are altered for randomization, different values of k are used in the k-means algorithm for clustering and decision tree parameters in the J4.8 algorithm are altered. We show below a few examples from our rigorous evaluation of AutoDomainMine. The holdout strategy (Russell & Norvig, Reference Russell and Norvig1995) is used for evaluation. Among the 500 experiments in the heat treating database, 400 are used for training the technique and the remaining 100 are kept aside as the distinct test set.
Tests are conducted as follows. In each test, the users enter the input conditions of a real experiment from the distinct test set. They observe the estimated output of AutoDomainMine and compare it with the output of the corresponding real experiment. If the real and estimated results are close enough as per user satisfaction, then the estimation is considered to be correct. Accuracy is then reported as the percentage of correct estimations over all the tests conducted.
We target the users of various applications of AutoDomainMine such as parameter selection (Sisson et al., Reference Sisson, Maniruzzaman and Ma2004), simulation tools (Lu et al., Reference Lu, Vader, Kang and Rong2002), decision support systems (Varde et al., Reference Varde, Takahashi, Rundensteiner, Ward, Maniruzzaman and Sisson2003), and intelligent tutors (Bierman & Kamsteeg, Reference Bierman and Kamsteeg1988). Accuracy is reported in the context of each application. Sample screen-dumps from the evaluation are demonstrated here.
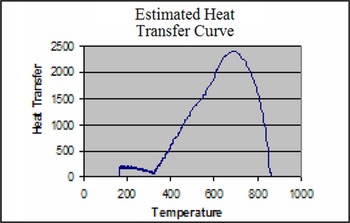
Figure 10 shows an example of how the user enters the input conditions of an experiment in the test set. The AutoDomainMine system estimates the heat transfer curve that would be obtained. The estimated output is shown in Figures 11–13. Figure 11 depicts the most likely heat transfer curve that would be obtained from the input conditions in Figure 10. This conveys to the user the most probable estimated output. Figure 12 shows the average heat transfer curve with prediction limits for the same input conditions. This enables the user to get an idea of the estimated average output along with variations that may occur if the real experiment were conducted. Figure 13 goes one level deeper to illustrate the estimated ranges of heat transfer that would occur with the given input conditions. This allows the user to see all the potential values of the estimated output that would occur based on an analysis of existing data.
An example of user input to AutoDomainMine. [A color version of this figure can be viewed online at http://www.journals.cambridge.org]

The most probable estimated output. [A color version of this figure can be viewed online at http://www.journals.cambridge.org]

The average estimated output with variations. [A color version of this figure can be viewed online at http://www.journals.cambridge.org]

Potential ranges of estimated output. [A color version of this figure can be viewed online at http://www.journals.cambridge.org]

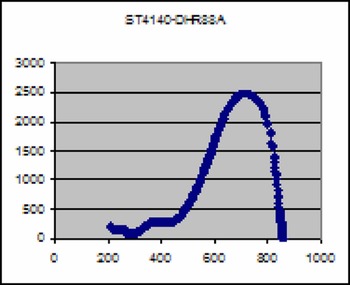
The users compare the estimated output in all the levels with the real output of the corresponding experiment conducted with the same input conditions. Figure 14 shows the real heat transfer curve obtained for the input conditions in Figure 10. Upon comparing the real and estimated heat transfer curves, the users conclude that the estimation is correct. Because the estimation provided by AutoDomainMine shows the expected output including its estimated ranges, the real result is more likely to fall within these ranges (as opposed to the output provided by the mathematical models). This, in turn, is likely to increase the accuracy of the estimation in most cases.
The heat transfer curve from the real experiment. [A color version of this figure can be viewed online at http://www.journals.cambridge.org]

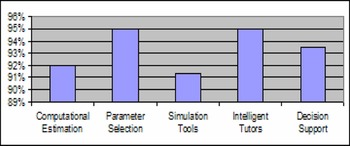
Likewise, upon conducting tests with all the data in the test set, the estimation accuracy of AutoDomainMine is found to be in the range of 90–95% (Varde et al., Reference Varde, Rundensteiner, Ruiz, Brown, Maniruzzaman and Sisson2006b). This is evident from an analysis of the survey results. Figure 15 shows the accuracy of the heuristic approach AutoDomainMine in the context of computational estimation and its targeted applications. Note that the accuracy has been evaluated by users in the context of the applications of estimation. Hence, we analyze the responses of the users with respect to the given applications and report accuracy accordingly. For example, among 100 tests conducted by parameter selection users, 95 are found to be accurate, and hence, the accuracy in that application is reported as 95%. The accuracy of the computational estimation on the whole is the percentage of accurate tests among all the tests conducted by users in all the applications. This effectively represents the overall estimation accuracy of AutoDomainMine. Figure 15 shows that the overall accuracy is 92%.
The accuracy of the heuristic approach in targeted applications. [A color version of this figure can be viewed online at http://www.journals.cambridge.org]

Therefore, on the whole, we find that the estimation accuracy in the heuristic approach is somewhat higher than that in the mathematical approach.
6.2. Efficiency
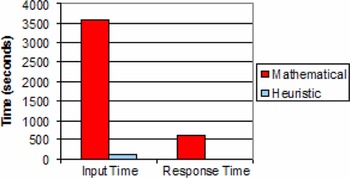
Efficiency refers to the amount of time taken to perform the estimation, that is, the setup time for supplying the inputs and the response time of the tool (Fig. 16). We record the amount of time taken to supply inputs for each test in both the mathematical and heuristic approaches. Note that in the mathematical approach, in addition to experimental input conditions, experts need to provide initial values for time–temperature. Thus, the time taken to provide these additional inputs is also recorded. The response time of each approach in terms of how long it takes to produce the output, given the inputs, is observed as well.
The efficiency of estimation approaches. [A color version of this figure can be viewed online at http://www.journals.cambridge.org]

Figure 12 shows average input and response times of the mathematical and heuristic approaches. We find that input time of the mathematical approach is much more than the heuristic approach. In addition, the response time of the mathematical approach is of the order of minutes, whereas that of the heuristic approach is negligible.
Thus, the heuristic approach is distinctly more efficient than the mathematical approach.
7. RELATED WORK
An intuitive approach to estimation is a similarity search over existing data (Mitchell, Reference Mitchell1997). When the user supplies input conditions of an experiment, these are compared with the conditions stored in the database. The closest match is selected in terms of the number of matching conditions. The corresponding graph is output as the estimated result. However, a partial match is not likely to be useful because the nonmatching condition(s) could be significant in the given domain. For example, in heat treating, the user-submitted experimental conditions may match many conditions except for the cooling medium used in the experiment and the material being cooled. Because these two factors are significant as evident from basic domain knowledge, the resulting estimation would likely be incorrect.
A somewhat more sophisticated approach is performing a weighted search (Keim & Bustos, Reference Keim and Bustos2004). Here, the search is guided by the knowledge of the domain to some extent. The relative importance of the search criteria, in our context, experimental input conditions, is coded as weights. The closest match is determined using a weighted sum of the conditions. However, these weights are not precisely known, with respect to their impact on the resulting graph or even otherwise. For example, in heat treating, in some cases the agitation level in the experiment may be more crucial than the oxide layer on the surface of the part. In some cases, it may be less crucial. This may depend on factors such as the actual value of the conditions, for example, high agitation may be more significant than a thin oxide layer, whereas low agitation may be less significant than a thick oxide layer. Thus, there is a need to learn: that is, to discover knowledge in some manner, for example, from the results of experiments.
Case-based reasoning (Kolodner, Reference Kolodner1993) could also be used for estimation. In our context, this involves comparing input conditions to retrieve the closest matching experiment, reusing its heat transfer curve as a possible estimate, performing adaptation if needed, and retaining the adapted case for future use. However, adaptation approaches in the literature (Aamodt & Plaza, Reference Aamodt and Plaza2003) are not feasible for us. For example, in heat treating, if the “agitation level” in the new case has a higher value than in the retrieved case, then a domain-specific adaptation rule could be used to infer that high agitation implies high heat transfer coefficients. However, this is not enough to plot a heat transfer curve in the new case.
Rule-based and case-based approaches have been integrated in the literature to solve certain domain-specific problems (Leake, Reference Leake1996). General domain knowledge is coded in the form of rules, whereas case-specific knowledge is stored in a case base and retrieved as necessary. For example, in the domain of law (Pal & Campbell, Reference Pal and Campbell1997), rules are laid down by the constitution and legal cases solved in the past are typically documented. However, it is nontrivial to apply this approach to graphs in our context. In the literature such approaches have been used where the solution is categorical. To the best of our knowledge, it has not been used with graphs.
8. CONCLUSIONS
In this paper, mathematical and heuristic approaches for computational estimation are compared using the criteria of sample space, time complexity, data storage, efficiency, and accuracy. Similar arguments for comparison can be applied for other scientific data analysis problems such as failure diagnostics and predictive analysis. We consider the heat treating domain and compare the direct–inverse heat conduction mathematical model for estimation with our proposed heuristic approach AutoDomainMine. Performance evaluation with real data from materials science is presented. It is found that mathematical models are feasible when data from previous experiments is not stored, domain experts are available to provide inputs, and efficiency is not critical. Heuristic approaches are found to give much higher efficiency and relatively higher accuracy than the mathematical models. However, heuristic methods are applicable only when data from previously performed experiments is available. In the context of the estimation problem in this paper, heuristic approaches are preferred.
ACKNOWLEDGMENTS
This work was supported by the CHTE and by the Department of Energy Industrial Technology Program Award DE-FC-07-01ID14197. The authors thank the Metal Processing Institute for organizing the seminars that gave visibility to the AutoDomainMine system. We are grateful to all the CHTE users who spent their precious time in completing the surveys for system evaluation. The feedback of the Artificial Intelligence Research Group, Database Systems Research Group, and Knowledge Discovery and Data Mining Research Group in the Department of Computer Science at Worcester Polytechnic Institute (WPI) is gratefully acknowledged. In particular, we acknowledge the input of Prof. Carolina Ruiz from the Department of Computer Science at WPI. We also thank the researchers from the Quenching Team in Materials Science for their cooperation and support.
Editor's Note: The reviewing process for this article was managed by an AIEDAM Associate Editor.
Aparna Varde is an Assistant Professor in computer science at Virginia State University. She obtained her PhD and MS in computer science from WPI and a BE in computer engineering from the University of Bombay. Dr. Varde has software trademarks and has written journal articles and conference papers (IEEE, ACM, AAAI, and ASM International). Her professional activities include serving as a reviewer for the journals Data and Knowledge Engineering, Transactions on Knowledge and Data Engineering, and Information Systems; as Co-Chair of the PhD Workshop in the ACM Conference on Information and Knowledge Management; and as a PC Member of SIAM's Data Mining Conference and the Multimedia Data Mining Workshop in the ACM Conference on Knowledge Discovery and Data Mining. She is working on research projects mostly in scientific data mining.
Shuhui Ma is a Manufacturing Engineer at Tiffany and Company. She has a BS in physical chemistry from Beijing University of Science and Technology and an MS and a PhD in materials science and engineering from WPI. She is a member of Sigma Xi, ASM, and TMS. Dr. Ma was the recipient of the 2006 Bodycote/HTS best paper award.
Mohammed Maniruzzaman is currently a Research Assistant Professor of mechanical engineering at WPI. He has a BSc and an MS degree in mechanical and a PhD in materials science and engineering. He is a member of the ASM, TMS, and Sigma Xi. Dr. Maniruzzaman's main research interest is the application of mathematical modeling to materials processing, with special emphasis on alloy heat treatment and molten metal treatment.
David C. Brown is a Professor of computer science and has a collaborative appointment as a Professor of mechanical engineering at WPI. He has BSc, MSc, MS, and PhD degrees in computer science and is a member of the ACM, IEEE Computer Society, AAAI, ASME, and IFIP WG 5.2. He is the Editor in Chief of the Cambridge University Press journal Artificial Intelligence for Engineering Design, Analysis and Manufacturing, and he is on the editorial boards of several other journals. Dr. Brown's research interests include computational models of engineering design and the applications of artificial intelligence to engineering and manufacturing.
Elke Rundensteiner is a Professor of computer science at WPI. She is a well-known expert in databases. Her current research includes stream data management, data integration and warehousing, and visual information exploration. She has over 280 publications in these areas. Her research has been funded by government agencies and industry, including NSF, NIH, IBM, Verizon, GTE, HP, and NEC. Dr. Rundensteiner has been the recipient of numerous honors, including NSF Young Investigator, Sigma Xi Outstanding Senior Faculty Researcher, and WPI Trustees' Outstanding Research and Creative Scholarship awards. She serves on the program committees of prestigious conferences and is the Associate Editor and Special Issue Editor of several journals.
Richard D. Sisson, Jr., is the George F. Fuller Professor and Director of Manufacturing and Materials Engineering at WPI. He received his BS in metallurgical engineering from Virginia Polytechnic Institute and an MS and a PhD in metallurgical engineering from Purdue University. Dr. Sisson's teaching and research has focused on the applications of thermodynamics and kinetics to materials processing and degradation phenomena in metals and ceramics. He became a Fellow of ASM International in 1993. He received the WPI Trustees Award as Teacher of the Year in 1987. In 2006 he was inducted into Virginia Tech's College of Engineering Excellence. In 2007 he received the WPI Chairman's Exemplary Faculty Award.