I. INTRODUCTION
Iron oxide (hematite) is considered to be a promising material with good properties for application in photoelectrochemical cell (PEC), which uses sunlight to split water into molecular hydrogen and oxygen. Hematite fulfills most of the important requirements for materials in PEC applications, such as high natural abundance, good electrochemical stability, and possessing a band gap favorable for the absorption of sunlight, which is mostly concentrated in the visible range of the electromagnetic spectrum. However, the very low sunlight conversion efficiency achieved by hematite has limited its application in commercial devices. This low conversion efficiency is the result of specific limitations, such as the short lifetime of minority charges (holes) and the small optical absorption coefficient of hematite. In the last decades, much research has been dedicated to the study of the properties of hematite to overcome these limitations. Reference Walter, Warren, McKone, Boettcher, Mi, Santori and Lewis1–Reference Tachibana, Vayssieres and Durrant12 However, the properties of the material still require better understanding in order for researchers to achieve progress in the use of hematite as a photoanode. Bard and Hardee reported the first uses of hematite films in PECs, using hematite synthesized via chemical vapor deposition. Reference Hardee and Bard13,Reference Hardee and Bard14 Since Graetzel and co-workers Reference Bjoerksten, Moser and Graetzel15 introduced the concept of downsizing a material to the nanoscale to improve the properties of the bulk material, nanoscience has provided a new perspective. Nanomaterials have become essential for the development of several synthetic routes Reference Souza, Lopes, Longo and Leite16–Reference Hisatomi, Dotan, Stefik, Sivula, Rothschild, Grätzel and Mathews24 to fabricate efficient nanostructured hematite photoanodes for applications in PECs. Recently, aqueous chemical routes under hydrothermal conditions and colloidal approaches have been considered to be very promising methods for the synthesis of films on a large variety of substrate materials, with relatively low costs and easy scaling of the processes. Reference Vayssieres, Beermann, Lindquist and Hagfeldt25–Reference Goncalves and Leite33 After many reports had demonstrated the generation of interesting hematite morphologies in the nanoscale by means of several physical and chemical techniques, including the chemical approaches mentioned above, several strategies were used to improve the optical absorption coefficient and poor electronic conductivity of nanoscale hematite. Reference Warren, Voïtchovsky, Dotan, Leroy, Cornuz, Stellacci, Hébert, Rothschild and Grätzel34 Among these strategies, the incorporation of dopants Reference Kronawitter, Bakke, Wheeler, Wang, Chang, Antoun, Zhang, Guo, Bent, Mao and Vayssieres35–Reference Mao, Kim, Shin, Wang, Yoo, Han and Park38 and the deposition of different materials as under- or over-layers Reference Steier, Herraiz-Cardona, Gimenez, Fabregat-Santiago, Bisquert, Tilley and Grätzel39 have been observed to be the most effective to enhance the efficiency of hematite as a photoanode material. In addition, the careful control of the thermal treatment conditions, such as the temperature and atmosphere, seems to be crucial to the good performance of both pure and modified hematite electrodes for water oxidation under irradiation by sunlight. Reference Carvalho and Souza40–Reference Gan, Lu and Tong43
Ling and co-authors Reference Ling, Wang, Reddy, Wang, Zhang and Li44 reported the influence of thermal treatment in an oxygen-deficient atmosphere on the performance of hematite. They found that the presence of oxygen vacancies in the hematite structure significantly affected the overall photoelectrochemical response of the material. Li and coworkers also investigated the effect of an oxygen-deficient atmosphere on the decomposition of akaganeite to the desirable hematite phase; they attributed the enhancement of the photocurrent to an increased donor density resulting from the formation of oxygen vacancies. Reference Ling, Wang, Reddy, Wang, Zhang and Li44 However, after several years of investigation to elucidate the mechanism controlling the changes caused by oxygen-deficient atmospheres on hematite films, a consensus has not yet been reached. Recently, in revisiting the investigation of the effects of an oxygen-deficient atmosphere on the properties of hematite film, Li and coworkers conducted a systematic and detailed kinetic analysis to elucidate a complete mechanistic model of the operation of oxygen-deficient hematite electrodes. Reference Forster, Potter, Ling, Yang, Klug, Li and Cowan45 They showed that the balance between the enhanced electrical properties and trap-mediated losses is responsible for the enhanced photoelectrochemical water splitting efficiency of hematite electrodes prepared by a wet chemical method and modified by the deposition of an Al2O3 overlayer.
In this context, we describe the single-step synthesis of akaganeite films by an aqueous precursor solution kept under hydrothermally assisted conditions using a commercial microwave oven. To obtain the desired hematite phase and activate the surface of the hematite film for water oxidation, an additional thermal treatment at 750 °C for 30 min was performed under different atmospheres of air, O2, and N2. Several techniques were used to fully characterize the role of the atmosphere on the overall performance of hematite films. The best improvement in the performance of hematite film was achieved by using an oxygen-deficient atmosphere, which increased the catalytic activity of the films for water oxidation. The results of this study contrast with those reported in the literature, in which the authors investigated the effect of an oxygen-deficient atmosphere on the phase transformation from iron oxyhydroxide to hematite and related the resulting improvement in the photocurrent exclusively to the increased donor density by vacancy formation. Reference Ling, Wang, Reddy, Wang, Zhang and Li44
II. MATERIALS AND METHODS
Nanostructured iron oxide thin films were prepared from an aqueous solution assisted by microwave. The approach utilized the dissolution of ferric chloride (FeCl3·6H2O, Vetec, Rio de Janeiro, Brazil; 97%) and sodium nitrate (NaNO3, Vetec; 99%) in deionized water [resistivity (ρ) > 17 MΩ/cm] with a pH of 1.5 after adjustment with chloride acid (HCl, Nuclear, São Paulo, Brazil; 36.5–40%). Commercial transparent conductive glass substrates of fluorine-doped tin oxide (FTO, ρ = 10–15 Ω/cm) were cleaned and then immersed in a special bottle (capacity 30 mL) containing 15 mL of the precursor solution. The system comprising the bottle, solution, and substrate was subjected to hydrothermal conditions controlled by a commercial microwave (Monowave 300, Anton-Paar, Estiria, Austria) at a constant temperature of 100 °C for 2 h. Subsequently, the substrates and newly formed films were cleaned three times with deionized water to remove any residual salts from the precursor solution from the surface of the films. To obtain the desired crystalline phase the iron oxide thin films were submitted an additional thermal treatment. The temperature of thermal treatment at 750 °C/30 min was chosen based in a systematic investigation about the influence of the temperature and time of thermal treatments performed to obtain high-purity hematite phases, recently reported by our group. Reference Xavier, Ferreira and Souza46 To evaluate the influence of the atmospheric composition on the quality of the as-synthesized films, thermal treatments at 750 °C for 30 min were conducted under three different gas fluxes of air, O2, or N2 in a tube furnace (Lindberg/Blue M Mini-Mite TF55030; Thermo Fisher Scientific, Asheville, North Carolina).
The optical properties of the films were measured using a Varian Cary 50 spectrophotometer (Varian Inc., Santa Clara, California) in the range of 200–800 nm. The film morphologies were characterized by scanning electron microscopy (FEG-SEM, FEI Inspect F50; FEI Company, Hillsboro, Oregon) and atomic force microscopy (Agilent 5500 microscope; Agilent, Santa Clara, California) using an intermittent contact mode. The structural phases were determined by x-ray diffraction using Cu Kα radiation (XRD, D8 Focus, Bruker AXS; Bruker Corporation, Karlsruhe, Germany) in a 2θ range from 10 to 80°, with a step scan of 0.02° and 3 s/step.
Photoelectrochemical characterization was performed using linear sweep voltammetry (current density, J, versus E) under both dark and illuminated conditions. The light conditions were simulated using a 450 W Xe lamp (O3-free) coupled with an AM 1.5 G filter. The light intensity was set to 100 mW/cm2. In addition, the stability of the current within the films was analyzed by chronoamperometry (J versus time t). Electrochemical impedance spectroscopy (EIS) measurements were also obtained. The EIS data were analyzed by a Mott–Schottky plot of C −2 versus V RHE, which allowed the determination of the charge carrier density (N D) and the depletion layer width (W). For this purpose, a three-electrode Teflon electrochemical cell with a quartz window was coupled to a potentiostat/galvanostat (μAutolab III; Metrohm Autolab, Utrecht, The Netherlands) with a frequency response analyzer.
The incident photon-to-current conversion efficiency (IPCE) was measured as a function of the excitation wave length (λ) using a 300 W Xe lamp (O3-free) coupled to a Cornerstone 260 monochromator (Oriel Quantum Efficiency Measurement Kit; Newport Corporation, Irvine, California). The IPCE (measured as a percentage) was calculated using the following equation:
 $${\rm{IPCE}} = \left( {{{I\left( \lambda \right)1240} \mathord{\left/ {\vphantom {{I\left( \lambda \right)1240} {E\left( \lambda \right)\lambda }}} \right. \kern-\nulldelimiterspace} {E\left( \lambda \right)\lambda }}} \right)100\quad ,$$
where I(λ) is the photocurrent density (µA/cm2) and E(λ) is the irradiance (µW/cm2).
III. RESULTS AND DISCUSSIONS
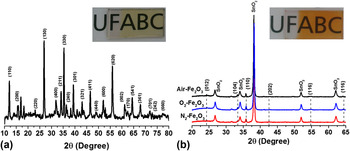
The precursor solution maintained at constant temperature (100 °C) for 2 h under hydrothermal conditions well-controlled by a commercial microwave resulted in an as-synthesized film covering the entire immersed area of the conductive glass substrate in the form of a thin yellow layer [Fig. 1(a), inset]. The yellow layer is composed of the akaganeite phase (iron oxyhydroxide, β-FeOOH) as illustrated in Fig. 1(a), in which the XRD peaks are indexed using the 34-1266 JCPDS card as a reference. To obtain the desired hematite phase (α-Fe2O3) for this study, the thin films were thermally treated at 750 °C for 30 min in a tube furnace under different atmospheres. As mentioned in the experimental section to the materials and method section, the as-synthesized film samples were thermally treated under an open atmosphere (henceforth referred to as Air–Fe2O3), a continuous flow of N2 gas (N2–Fe2O3), and a continuous flow of O2 gas (O2–Fe2O3), resulting in a transparent orange-red film, as exemplified in the inset picture of Fig. 1(b). To guarantee the reproducibility and quality of the present study, thin films were prepared in triplicate for each thermal treatment condition used to produce a total of 9 films. The structural transition arising from the thermal treatment was monitored by XRD.
XRD patterns of iron oxide films synthesized during 2 h microwave-assisted wet chemical reaction, with additional thermal treatment at 750 °C for 30 min in the different atmospheres of air, O2, and N2. (a) As-synthesized films and (b) thermally treated films. Inset photographs in (a) and (b) depict a film before and after the thermal treatment process, respectively.

Figure 1(b) exhibits the diffractograms of the orange-red thin films obtained after the additional thermal treatment under different atmospheres. All reflection peaks are readily indexed using the standard hematite powder diffraction data JCPDS catalog (33-0664) as reference, which confirms the formation of a pure hematite phase for all thermally treated thin films. As expected, peaks correlating to additional phases do not appear, except for the peaks corresponding to the transparent conductive material of the substrate, which are indexed as SnO2 (cassiterite phase). Additionally, the XRD data permitted the estimation of the degree of film orientation F, using a relationship originally proposed by Lotgering's equation Reference Cunha and Souza47,Reference Ami and Suzuki48 :
 $$F = {{P - {P_0}} \mathord{\left/ {\vphantom {{P - {P_0}} {1 - {P_0}}}} \right. \kern-\nulldelimiterspace} {1 - {P_0}}}\quad ,$$
where P = ∑I(h00)/I(hkl), I is the intensity of the diffraction peak obtained experimentally, and P 0 is the value of P calculated with standardized data from the JCPDS spectrum of a polycrystalline sample. Generally, higher degrees of orientation, indicated by larger values of F, relate to the preferred crystallographic orientations (O.P.) of the analyzed samples.
According to the O.P. calculations, the thermally treated films exhibited a preferred growth direction growth in the (110) diffraction plane for all hematite samples. Furthermore, the orientation degree F increased from 0.273 in air to 0.305 with O2 treatment. F increased further to 0.588 with N2 treatment. It is generally accepted that good conductivity can be achieved in a hematite electrode by generating a nanostructured film with a diffraction peak from the hematite crystal oriented preferentially in a direction parallel to the substrate, which means that the basal plane of (001) is oriented perpendicular to the substrate. This strategy guarantees the more efficient charge collection of the hematite, consequently enhancing the conductivity of the film by up to four orders of magnitude. Reference Sivula, Le Formal and Grätzel11,Reference Tachibana, Vayssieres and Durrant12,Reference Gonçalves, Lima and Leite18,Reference Kay, Cesar and Grätzel21,Reference Ling, Wang, Reddy, Wang, Zhang and Li44 As a consequence of this increased conductivity, this property of hematite as applied as a photoanode in PEC devices favors the charge transfer through the depletion layer. The charge injection to the back contact thus reduces the recombination rate and increases the efficiency of the cell. Reference Souza, Lopes, Longo and Leite16,Reference Shen, Kronawitter, Jiang, Mao and Guo49 The importance of crystal alignment and the improvement provided when the hematite crystals are well-aligned in the (110) plane have been discussed in detail in several reports. Reference Kay, Cesar and Grätzel21,Reference Cornuz, Grätzel and Kevin32 The effect of the degree of orientation estimated from the XRD patterns will become more apparent during later discussion of the photoelectrochemical measurements of the films.
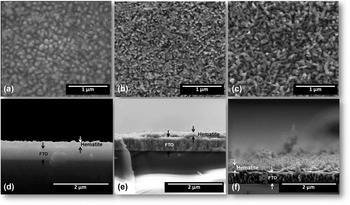
The morphologies of the films and the effects caused by thermal treatment under different atmospheres can be observed by the top-view and cross-sectional SEM images presented in Fig. 2. The top-view SEM images depict similar nanostructured morphologies composed of rods in all films with apparent porosity and homogenous distributions of rods over the substrate areas, independent of the atmosphere of the thermal treatments, [Figs. 2(a)–2(c)].
Morphological characterization of the films thermally treated at 750 °C in different atmospheres by SEM observations. Top-view images of hematite thin films treated in (a) air, (b) O2, and (c) N2. Cross-sectional images for hematite films prepared in (d) air, (e) O2, and (f) N2.

The film thickness can be estimated from the analysis of the cross-sectional images presented in Figs. 2(d)–2(f) using ImageJ software. Reference Rasband50 Similar estimated film thicknesses were obtained for all films thermally treated in different atmospheres, with an average value of 98.47 ± 3.09 nm. Since the conditions of the growth stage were well controlled by the microwave, similar morphologies and thicknesses were expected and confirmed by SEM analysis. In addition, by analyzing the cross-sectional images, a good interface between the conductive substrate and the hematite is observed, with a large number of rods apparently growing parallel to the substrate.
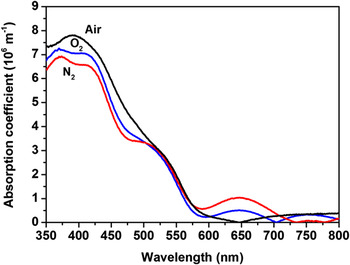
Following with the film characterization evaluating the important requirement that hematite needs to fulfill to be applied as photoanodes in PEC devices the optical properties was measured. Hematite films were analyzed using electronic absorption spectroscopy in the visible-ultraviolet region with a bare substrate used as a reference (blank). The absorbance values were normalized by the thicknesses estimated from the SEM images [Figs. 2(d)–2(f)] to obtain the absorption coefficient. Figure 3 illustrates the change in absorption coefficient as a function of wave length for all the hematite films synthesized and thermally treated under different atmospheres. This plot helps identify possible electronic transitions resulting from the use of different atmospheres during the thermal treatment in addition to the well-known and typical electronic transitions related to the optical band gap of hematite.
Absorption coefficient as a function of wave length for a hematite film thermally treated at 750 °C for 30 min in air (black line), N2 (red line), and O2 (blue line). The conductive glass substrate was evaluated and used as a baseline.

For all hematite films a quite similar value of maximum absorption was observed as being slightly above of 550 nm. However, the absorption profile of films thermally treated under an O2 or N2 atmosphere (blue and red line, Fig. 3) exhibits a different behavior compared to films prepared in air (black line, Fig. 3). The spectra depicted by the blue and red lines exhibit shoulder peaks (at around 360, 430, 530, 650, 750 nm) related to a specific electronic transition in the hematite structure. It is well known in solid state physics that the insertion of dopants and the use of an inert or oxidizing atmosphere during the annealing process can result in defects (such as vacancies). For instance, the band at around 640 nm could be attributed to an energy level between the conduction and valence bands due to the presence of a created defect, as previously reported. Reference Anpo and Takeuchi51–Reference van de Krol and Gratzel53 Indeed, it's common the use of controlled atmosphere (Ar, O2, N2, etc.) during the thermal treatment for favoring the defect formation making it able to create sub levels between the valence band and conduction hematite, affecting positively or negatively the charge transfer process. However, in the present study, this change in the optical absorption spectra at 640 nm can be related to the presence of certain amount of porosity (which has different refraction index), illustrated in the top-view of SEM images, caused by using different atmospheres during the thermal treatment. This is a plausible explanation once the estimated for all hematite electrodes showed a quite similar thickness.
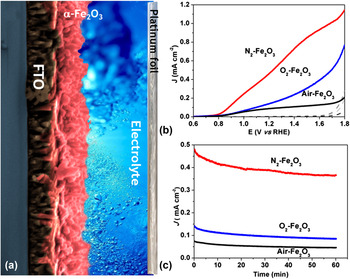
To understand the effect of the inert and oxidizing atmosphere during thermal treatment on the properties of the hematite film, we carried out linear voltammetry experiments under dark and illuminated conditions. The photocurrent density of all the hematite films was measured by shining light on both sides (back and front) of the film, however no difference was noted. Figure 4(a) exhibits the photocurrent density versus voltage (measured against a reversible hydrogen electrode as reference) curves of all the hematite films in the presence and absence of light. As expected, in the absence of light, the hematite films do not generate any current, as represented by the black dashed lines in Fig. 4(a).
Photoelectrochemical measurements performed under dark and illuminated conditions for all three hematite films synthesized; (a) schematic representation of hematite films water oxidation reaction under sunlight illumination producing O2 gas; (b) linear sweep voltammetry in the dark (black dashed lines) and under illuminated conditions; (c) photocurrent stability at 1.23 V RHE for 1 h under illumination. The illuminated conditions were simulated by sunlight simulator coupled with an AM 1.5 G filter and adjusted at 100 mW/cm2. Electrolyte: 1 mol/L of NaOH in distilled water with the pH adjusted to 13.6.

From the curves shown in Fig. 4(a), the photocurrent density response at 1.23 V RHE was around 0.09, 0.15, and 0.50 mA/cm2 for hematite films prepared in air (black line), O2 (blue line), and N2 (red line), respectively. The maximum values of photocurrent for these three films at 1.6 V RHE follow the same order: air (0.12 mA/cm2), O2 (0.39 mA/cm2), and N2 (0.93 mA/cm2). Additionally, the photocurrent stability at 1.23 V RHE applied potential under illuminated conditions was carried out by chronoamperometry measurements. Figure 4(b) corresponds to the curves of photocurrent versus time (60 min) for all the three hematite films under illumination; the films show very good stability, which is an important requirement for their application in PEC devices. It's worth to mention that the slight difference in stability observed comparing O2 and Air hematite with N2 hematite electrode is consistent with the idea that samples thermally treated at rich O2 atmosphere can have it solid–liquid interface improved, whereas the N2 enhance the solid–solid interface. This explanation is convincing once we known that the electrochemical measurements evaluate the transference of charge in the solid–liquid interface.
Measurements of the IPCE at 1.23 V RHE applied potential as a function of the wave length (nm) were also carried out for all three hematite films. IPCE values for hematite films prepared in air (black dot), O2 (red dot), and N2 (blue dot) were found to be around 4.5, 7.5, and 14.0% at 320 nm, and higher values of 5.6, 9.8, and 17.3% were observed at 400 nm (see Fig. S1). In general, hematite films synthesized in this study exhibit increased efficiency under an O2 atmosphere, which increases even more under a N2 atmosphere. Usually, the enhancement in photocurrent density under an O2 or N2 atmosphere can be related to increases in the charge transport, e.g., reducing the charge recombination process. The IPCE data obtained at 1.23 V RHE were integrated with the data measured using a standard solar spectrum (simulated using AM 1.5 G filter adjusted at 100 mW/cm2) showing photocurrent density calculated value similar in both measurements (difference lower than 10%), which ensure the quality of calibrated sunlight simulator used.
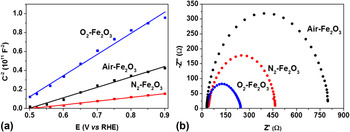
To evaluate the factors that contribute to the enhancement in efficiency observed for the hematite films synthesized under different atmospheres, we carried out EIS analysis in the absence of light. The electrochemical impedance data were analyzed in terms of Mott–Schottky and Nyquist plots, as displayed in Fig. 5. The Mott–Schottky plot [inverse square of the capacitance (1010 F−2) as a function of the potential applied (V RHE) at a frequency of 1 kHz] was used to estimate the donor charge density (N D) and flat band potential (V fb).
EIS was conducted at room temperature in the absence of light for hematite films synthesized over 2 h with additional thermal treatment at different atmospheres and analyzed by (a) Mott–Schottky and (b) Nyquist plots. Electrolyte: 1 mol/L of NaOH in distilled water with the pH adjusted to 13.6.

The above mentioned electronic parameters were determined using Mott–Schottky plots and Eq. (3) (Ref. Reference Lopes, Andrade, Le Formal, Gratzel, Sivula and Mendes54):
 $${1 \over {{C^2}}} = {2 \over {e\varepsilon {\varepsilon _0}{N_{\rm{D}}}{A^2}}}\left[ {\left( {V - {V_{{\rm{fb}}}}} \right) - {{KT} \over e}} \right]\quad ,$$
where C is the capacitance, e is the elementary charge, ε0 is the permittivity of vacuum, ε is the dielectric constant [hematite, ε = 80 (Ref. Reference Cesar, Sivula, Kay, Zboril and Grätzel42)], N D is the donor density, A is the geometrical area, K is the Boltzmann constant, T is the temperature, V is the applied potential, and V fb is the flat band potential.
From a good linear fitting (R 2 > 0.99 for all films) of the Mott–Schottky plots between 0.5 and 0.9 V RHE, the donor charge density for the three hematite films was found to vary from 10−19 to 10−20 cm−3; the maximum N D value was observed for films thermally treated under a N2 atmosphere. The flat band potential (V fb) was measured as the value of the x-intercept of the linear fit of Mott–Schottky plot; the value was determined to be around 0.4–0.5 V RHE. The N2 atmosphere promoted a slight shift to more anodic potential of the V fb of hematite films. This shift can positively affect the band bending, increasing the charge separation process and resulting in a better photoelectrochemical performance, as illustrated in Fig. 4. The value of band-bending or depletion layer width (W) was determined for all three films in triplicate using the electrochemical impedance data and Eq. (4):
 $$W = {\left( {2\varepsilon {\varepsilon _0}{{\left( {V - {V_{{\rm{fb}}}}} \right)} \mathord{\left/ {\vphantom {{\left( {V - {V_{{\rm{fb}}}}} \right)} {e{N_{\rm{D}}}}}} \right. \kern-\nulldelimiterspace} {e{N_{\rm{D}}}}}} \right)^{{1 \mathord{\left/ {\vphantom {1 2}} \right. \kern-\nulldelimiterspace} 2}}}\quad ,$$
where V is the applied potential (at 1.23 V RHE) and all the other parameters in this equation have already been defined. As aforementioned, a lower value of W was achieved for films prepared under a N2-atmophere, suggesting that N2 could be favoring a more efficient transfer of charge owing to an enhancement in the electric field across the W. All estimated parameters from electrochemical impedance data analyzed by the Mott–Schottky plot are summarized in Table I. In addition, the pseudo-overpotential for the water oxidation reaction at the hematite film surface was estimated using the relation (ηox = V onset − V fb) between the onset potential (V onset) under AM 1.5 G illuminated conditions and the flat band (V fb) potential. Reference Sivula55 Compared to hematite films prepared under air and O2 atmospheres, those prepared under a N2 atmosphere exhibited a lower value of ηox at around 0.25 V RHE. Usually, for PEC applications, the ideal value of ηox is zero or values close to zero so that there is no need for external excitation. Nyquist plot analysis was also done to observe the effect of different atmospheres on the resistance of charge transfer at the hematite film surface.
Photo and electrochemical parameters estimated from measurements conducted at room temperature in the absence and presence of light. Photocurrent density (J) at 1.23 V RHE and 1.6 V RHE, donor charge density (N D), flat band potential (V fb), pseudo-overpotential (ηox), and the depletion layer width (W).

Figure 5(b) shows the Nyquist plot obtained in dark conditions at room temperature, and the resistance for charge transfer for O2-hematite films was lower than those for the other two films. This result is commonly observed for O2-treated samples. It is well known that the O2-atmosphere improves the semiconductor surface quality favoring the solid–liquid interface for chemical reactions, but it negatively affects the solid–solid interface (FTO substrate–hematite layer interface). Once the electrochemical measurement is evaluating the transference of charge between semiconductor surface–liquid interfaces (electrolyte) the lower resistance for charge transfer obtained for O2-hematite films is not a surprise. Although a slight increase in the donor charge density (1 order of magnitude) for hematite films synthesized under N2 was observed. In fact, the N2 treatment enhanced the solid–solid interface, favoring charge collection and transport, but it has a negative impact to the semiconductor–liquid interface. Moreover a better photocurrent response achieved for the N2-hematite film cannot be explained as being a simple electronic effect caused by the inclusion of oxygen vacancies. Thus, these results motivated further investigation into the effects of the atmosphere used during the preparation of the hematite film.
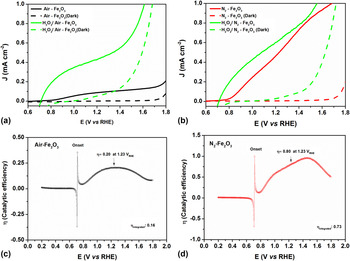
To eliminate any ambiguous interpretation about the effect of the atmosphere used during thermal annealing, the photoelectrochemical measurements were carried out using a modified aqueous electrolyte by adding a controlled amount of H2O2 solution (0.1 mol/L). It is well known that the addition of H2O2, as hole scavengers, could significantly improve the water oxidation activity, showing almost ideal behavior possible for the synthetic material obtained by choose method. Reference Sivula55 Indeed, it is a useful strategy to diagnose possible parameters that are limiting the achievement of high performance. The photoelectrochemical performance of the hematite film prepared under hydrothermal conditions with an additional thermal treatment in air was measured in the absence [black line, Fig. 6(a)] and presence [green line, Fig. 6(a)] of hole scavengers. It clearly illustrates a shift in the onset potential to more cathodic potential (close to the V fb) with a significant enhancement in photocurrent density. In fact, this result shows that photogenerated holes are available in the air-hematite film for the water oxidation reaction; however, in the absence of hole scavengers, it is likely that a very low amount of photogenerated charge is effectively used. In the case of the N2-hematite film only a slight shift in the onset potential with low photocurrent improvement was observed on comparing the photoelectrochemical performance without [red line, Fig. 6(b)] and with [green line, Fig. 6(a)] hole scavengers. Moreover, the photocurrent profile in the presence/absence of hole scavengers is very similar at high applied potential. In addition, the photocurrent density of films prepared under N2 was similar both in the presence/absence of hole scavengers. These results lead us to believe that the N2 atmosphere used is actuating as a “hole scavenger” increasing the catalytic efficiency for the water oxidation reaction. The enhancement in the efficiency (η) of catalytic activity is better visualized by comparing values and the curve profile exhibited in Figs. 6(c) and 6(d), for both hematite films. Note that for N2-hematite, the catalytic efficiency reached values of around 80% whereas films prepared in air reached values of 20% at 1.23 V RHE, with an overall catalytic efficiency around 73 and 16%, estimated from the onset potential to 1.8 V RHE, as shown in Figs. 6(c) and 6(d). Since the electronic properties were not significantly altered, the N2 atmosphere seems to positively affect the hematite–electrolyte interface, enhancing the catalytic efficiency, which is unusual as aforementioned before. In fact, the major effect of N2 atmosphere here can be related to the catalytic improvement, but many others effect cannot be ignored such as the presence of oxygen vacancies. For instance, the slightly increase in the number of donor density observed, which can be related to the vacancy formation, can reduce the rate of back electron recombination contributing to the overall enhancement, as well. Reference Forster, Potter, Ling, Yang, Klug, Li and Cowan45
Linear voltammetry sweep performed under illuminated conditions in the presence and absence of H2O2 added in the electrolyte solution (a) air-hematite film; (b) N2-hematite film; catalytic efficiency, η, from the ratio between both the photocurrent response measured in (a) and (b) was estimated by (c) air-hematite film and (d) N2-hematite film. Electrolyte: 1 mol/L of NaOH in distilled water with the pH adjusted to 13.6. For measurement with H2O2, a controlled amount (0.1 mol/L) was added very slowly to avoid bubble formation.

IV. CONCLUSIONS
In summary, pure hematite thin films were successfully synthesized for the first time in a single step at low and constant temperature under hydrothermal-assisted conditions using a commercial microwave system. This wet chemical method can be used to fabricate a very well distributed iron oxide nanostructure over the glass conductive substrate. An additional thermal treatment was carried out under different atmospheres to obtain the desired phase of iron oxide and for film surface activation. A series of characterizations were carried out for evaluating the effect of the atmosphere on all synthesized films. The top-view and cross-sectional SEM images illustrate a morphology formed by rods with thickness between 98 and 100 nm for all the three hematite films. The absorption spectra showed the presence of several additional electronic transition bands compared with hematite films prepared in air. Some of these transitions could be attributed to the inclusion of defects or oxygen vacancies, as previously reported. In addition, the slight reduction observed in the optical absorption at around 650 nm comparing the O2 and N2-hematite with air-hematite electrode can be related to the presence of apparent porosity illustrated in the SEM images, which has different refraction index. The photoelectrochemical response of hematite films thermally treated under a N2 atmosphere was 80 and 50% more efficient than those films produced in air and an O2 atmosphere, respectively. This enhancement in the photocurrent response for the N2-hematite film was not attributed to the electronic changes, as pointed out in the literature. The Nyquist plot analysis revealed a lower resistance of charge transfer for hematite films prepared in O2. However, this result is expected since it is well known that an O2 atmosphere improves the hematite–electrolyte interface, favoring charge transport, however, it is not effective for charge transfer in a hematite-conductive substrate interface, which could be responsible for the low enhancement in overall photocurrent density. In contrast with previous reports in the literature that a N2 atmosphere could improve the charge transport, increase charge separation yields, and decrease the resistance for charge transfer between hematite/conductive glass substrate, in this study, the predominant effect was attributed to a significant enhancement in the catalytic efficiency. This means that the N2 atmosphere positively affected the interface between the hematite film and electrolyte, increasing the overall photocurrent response. Indeed, as illustrated by photoelectrochemical measurements in the presence of hole scavengers, the N2-atmosphere seems to play the same role as a hole scavengers for water oxidation. Further experiments are underway in our laboratory for optimization of the synthesis protocol and a better comprehension of the effects of thermal treatment under an oxygen deficient atmosphere.
Supplementary Material
To view supplementary material for this article, please visit http://dx.doi.org/jmr.2015.353.
ACKNOWLEDGMENTS
We gratefully acknowledge financial support from the Brazilian agencies of FAPESP (Grants 2011/19924-2, 2013/05471-7, 2014/50516-6 and 2014/11736-0), CAPES, CNPq (Grant No. 473669/2012-9), CEM-UFABC and CDMF (Grant No. 2013/07296-2)