1. Introduction
Most studies of protein–DNA interactions take a protein-centric perspective – giant proteins ‘bully’ a static DNA polymer into a recognizable configuration (e.g., see Cozzarelli et al. Reference Cozzarelli, Cost, Nöllmann, Viard and Stray2006). The structure of the protein has often been considered the primary determinant in the interaction, and DNA, by comparison, a passive substrate. In fact, the DNA molecule is often regarded as an inert information storage molecule that serves only to carry the genetic code, which is subsequently read by active protein molecules.
There are likely several reasons for this one-sided view, but perhaps the most important reason is that short, linear, DNA fragments are employed in the overwhelming majority of biophysical and biochemical studies of DNA structure and protein–DNA interactions. Short, linear (therefore relaxed) DNA substrates are not very representative of the long, supercoiled genomes that proteins have to act upon in vivo. Linear DNA fragments effectively represent a small isolated domain of the DNA substrate. Isolated domains of a protein may not behave in the same way as the complete protein molecule and, similarly, short, relaxed DNA substrates often do not behave the same way as the complete DNA molecule. In this review, we argue that this focus on fragments is particularly detrimental for understanding the structure of DNA because DNA in the cell possesses topology, which leads to conformational changes at the local level. We assert that until we are able to recreate the topological conditions of DNA in the cell in structural studies, we are missing a vital component of DNA behavior.
In many experimentally determined structures of protein–DNA complexes the DNA shows significant deviation from the familiar B-form double helix. For example, in such complexes, the DNA can be dramatically bent or kinked, or with bases flipped out of the helix. These kinds of conformational changes are unfavorable in relaxed DNA and therefore conventional wisdom states that the necessary energy must be provided by favorable protein–DNA interactions being generated upon formation of the complex.
1.1. Goals and organization of this review
With this review we hope to convey how DNA plays a more active role in its own recognition and activity than is generally appreciated. This review is not intended to be exhaustive of protein–DNA interactions; we will instead focus on a few illustrative examples. For an excellent review of protein–DNA interactions and how this is influenced by DNA structure we refer readers to Rohs et al. (Reference Rohs, Jin, West, Joshi, Honig and Mann2010). Here, we take a rather DNA-centric perspective and focus on recent studies revealing the extent of structural variations in DNA at both a global level and a local level that are driven by DNA topology, independent of any protein. The dynamic structure of DNA has implications not just for protein–DNA interactions, but also DNA–DNA and drug–DNA interactions. Perhaps all aspects of DNA metabolism are influenced by DNA topology. Therefore, whereas we mostly discuss DNA dynamics in terms of protein recognition, the same general principles also hold true for any such molecule interacting with DNA.
As a major focus of this review, DNA supercoiling has implications at multiple length scales from the cellular level down to the atomic level. We begin by discussing the implications of topology at the cellular level. Recent experimental advances and increased computing power have allowed researchers to probe the structure of supercoiled DNA down to the level of individual atoms. These atomistic studies provide a unique insight into conformational changes at the length scales that are recognized by proteins, and are therefore likely to be highly important for DNA recognition. Based on the diversity of conformations that can be adopted by supercoiled DNA at the local level, we propose that DNA has a previously unappreciated ability to direct its own recognition and active processes.
1.2. An introduction to DNA topology
DNA topology – the supercoiling, knotting, and linking (catenating) of DNA helices – is an intrinsic property of constrained DNA molecules and has important consequences for life (reviewed in Liu et al. Reference Liu, Deibler, Chan and Zechiedrich2009). In most organisms studied to date, DNA is maintained in a homeostatically underwound, that is, negatively supercoiled, state (Cozzarelli et al. Reference Cozzarelli, Boles, White, Cozzarelli and Wang1990; Kramer & Sinden, Reference Kramer and Sinden1997; Schvartzman & Stasiak, Reference Schvartzman and Stasiak2004; Travers & Muskhelishvili, Reference Travers and Muskhelishvili2005). For a more thorough review of DNA supercoiling, see Bates & Maxwell (Reference Bates and Maxwell2005) and Fogg et al. (Reference Fogg, Catanese, Randall, Swick, Zechiedrich, Benham, Harvey, Olson, Sumners and Swigon2009). In addition to the homeostatically regulated levels of negative supercoiling in genomic DNA, transient supercoiling in both the positive and negative directions arises naturally in vivo from DNA metabolic processes including replication and transcription (Liu & Wang, Reference Liu and Wang1987; Lockshon & Morris, Reference Lockshon and Morris1983). DNA knotting is a potentially problematic topological form of DNA. Knotted DNA arises as a result of DNA metabolism (Peter et al. Reference Peter, Ullsperger, Hiasa, Marians and Cozzarelli1998; Postow et al. Reference Postow, Crisona, Peter, Hardy and Cozzarelli2001; Sumners et al. Reference Sumners, Ernst, Spengler and Cozzarelli1995), blocks transcription in vitro (Portugal & Rodríguez-Campos, Reference Portugal and Rodríguez-Campos1996) and in vivo (Deibler et al. Reference Deibler, Rahmati and Zechiedrich2001), and both accelerates mutation and causes cell death (Deibler et al. Reference Deibler, Mann, Sumners and Zechiedrich2007). DNA catenanes are a natural consequence of DNA replication (Hudson & Vinograd, Reference Hudson and Vinograd1967; Jaenisch & Levine, Reference Jaenisch and Levine1973; Kupersztoch & Helinski, Reference Kupersztoch and Helinski1973; Novick et al. Reference Novick, Smith, Sheehy and Murphy1973; Sakakibara et al. Reference Sakakibara, Suzuki and Tomizawa1976). Although not as immediately problematic as knots, unlinking of catenanes following replication is essential for segregation to occur.
Underscoring the importance of DNA topology, the topoisomerases that resolve and modulate these topologies are essential and common to all life (Forterre et al. Reference Forterre, Gribaldo, Gadelle and Serre2007; Schoeffler & Berger, Reference Schoeffler and Berger2008). Topoisomerases alter DNA topology by cleaving either one strand (type I topoisomerases) or both strands (type II topoisomerases) of the DNA, passing a second strand or helix through the break, and subsequently religating the DNA. Although necessary for cell survival, topoisomerases have the potential to become potent cellular toxins. Drugs that stabilize the normally transient intermediate, where the enzyme is covalently attached to cleaved DNA substrate, lead to cell death. This poison mechanism (Kreuzer & Cozzarelli, Reference Kreuzer and Cozzarelli1979) makes topoisomerases major pharmaceutical targets. One of the most prescribed classes of antimicrobial agents, the fluoroquinolones, target the bacterial topoisomerases (reviewed in Bolon, Reference Bolon2009; Drlica & Malik, Reference Drlica and Malik2003; Heeb et al. Reference Heeb, Fletcher, Chhabra, Diggle, Williams and Cámara2011; Robicsek et al. Reference Robicsek, Jacoby and Hooper2006). The alarming increase in fluoroquinolone resistance (Boyd et al. Reference Boyd, Atmar, Randall, Hamill, Steffen and Zechiedrich2008) underscores the importance of understanding topoisomerase function. Several important classes of anti-cancer drugs, including etoposide, anthracyclines, anthracenediones, and the camptothecins and their derivatives, target the human topoisomerases (reviewed in Martincic & Hande, Reference Martincic and Hande2005; Robicsek et al. Reference Robicsek, Jacoby and Hooper2006). A better understanding of the biophysical properties of topoisomerases and the DNA substrates upon which they act is required to understand how these drugs exert their effects and what goes awry when cells become resistant.
A central concept in the study of DNA topology is the linking number, Lk. The DNA linking number defines the number of times that the two strands in the double helix are interwound. Unless the backbone of the helix is broken, the Lk of a closed-circular DNA molecule is an invariant integer. Although eukaryotic chromosomes are linear, they may be anchored to the nuclear matrix at various points and the intervening DNA between anchor points has topological constraints, which produce some consequences equivalent to a closed-circular loop. Thus, in a topological sense, linear chromosomes also behave in an analogous fashion.
The linking number of a helix in its lowest energy, or relaxed state, is denoted Lk 0. By the theoretical definition of Lk 0,

where N is the length of the helix in base pairs and h is the helical repeat. The helical repeat is dependent on temperature, nucleotide sequence and ionic strength of the solvent. The value of N/h, and correspondingly, Lk 0, is not necessarily an integer; therefore, up to half a turn of overwinding or underwinding may be required to allow formation of a closed-circular DNA duplex.
The DNA molecule is strained when the linking number difference from the basal state, ΔLk=Lk−Lk 0, is non-zero. ΔLk depends on the length of the molecule and is, therefore, only suitable for comparing equal-length molecules. For this reason, it is common to describe DNA by the specific linking difference, or superhelical density, denoted by σ:

Non-zero ΔLk in unconstrained polymers is manifested in two forms: twist, Tw, and writhe, Wr (Fuller, Reference Fuller1978; Starostin, Reference Starostin, Calvo, Millett, Rawdon and Stasiak2005). The relationship between these fundamental properties, derived by White and Călugăreanu (Călugăreanu, Reference Călugăreanu1961; White, Reference White1969), is given by

Twist describes how one strand rotates around the other about the helical axis, while writhe describes how the helical axis winds (supercoils) about itself in three-dimensional space. It follows that

This equation makes explicit the trade-off between twist and writhe, that is, for a given ΔLk, ΔTw must decrease if ΔWr increases and vice versa. When ΔLk<0, DNA is underwound, or negatively supercoiled. Likewise, when ΔLk>0, DNA is overwound, or positively supercoiled. The partitioning between twist and writhe is a consequence of the sequence of the molecule, the electrostatic environment in the solution, steric constraints, and whether the molecule is positively or negatively supercoiled.
A significant consequence of DNA supercoiling is that it helps to compact the genetic material into a more manageable, condensed state (Vologodskii et al. Reference Vologodskii, Levene, Klenin, Frank-Kamenetskii and Cozzarelli1992). Another significant consequence is that modulating twist regulates access to the genetic information encoded on the DNA bases. Negative twist reduces the energy required for strand separation, thus facilitating processes such as transcription and replication that require access to the DNA bases. Overwinding of the helix, positive twist, inhibits strand separation and stabilizes the DNA helix against separation. The homeostatic underwound state of DNA in cells helps address the need for the genetic information to be efficiently, rapidly, and frequently accessed. Topoisomerases modulate DNA supercoiling to maintain the negative linking difference (reviewed in Fogg et al. Reference Fogg, Catanese, Randall, Swick, Zechiedrich, Benham, Harvey, Olson, Sumners and Swigon2009; Liu et al. Reference Liu, Deibler, Chan and Zechiedrich2009; Schoeffler & Berger, Reference Schoeffler and Berger2008). Measured levels of DNA supercoiling in plasmids purified from Escherichia coli are around σ=−0.06 to −0.075 (Liu & Wang, Reference Liu and Wang1975; Zechiedrich et al. Reference Zechiedrich, Khodursky, Bachellier, Schneider, Chen, Lilley and Cozzarelli2000). In hyperthermophilic organisms without a DNA gyrase to introduce negative supercoiling, DNA is relaxed (Charbonnier & Forterre, Reference Charbonnier and Forterre1994; Forterre & Gadelle, Reference Forterre and Gadelle2009; Musgrave et al. Reference Musgrave, Zhang and Dinger2003). In eukaryotes, the situation is made more complex by the presence of nucleosomes (reviewed in Bassett et al. Reference Bassett, Cooper, Wu and Travers2009; Bates & Maxwell, Reference Bates and Maxwell2005). Whereas negative supercoiling is constrained in eukaryotes by nucleosomes, regions devoid of nucleosomes, either because they are linker regions or because the nucleosomes have transiently dissociated, should have unrestrained negative supercoiling. The packaging of DNA in eukaryotic cells is a complex and controversial subject and beyond the scope of this review.
2. DNA structure and mechanics in the cellular milieu
2.1. Biological importance of DNA supercoiling
From experimental studies at the cellular level, DNA supercoiling is known to modulate gene expression, leading to its characterization as a regulatory ‘switch’ (reviewed in Liu et al. Reference Liu, Deibler, Chan and Zechiedrich2009), ‘a second transcription factor’ (Peter et al. Reference Peter, Arsuaga, Breier, Khodursky, Brown and Cozzarelli2004), and ‘a global regulator of the complement of genes in the cell’ (Blot et al. Reference Blot, Mavathur, Geertz, Travers and Muskhelishvili2006; Dorman, Reference Dorman and El-Sharoud2008; Muskhelishvili et al. Reference Muskhelishvili, Sobetzko, Geertz and Berger2010; Travers & Muskhelishvili, Reference Travers and Muskhelishvili2007). E. coli has been used as a model system to monitor changes in gene expression as a function of altered DNA supercoiling (Blot et al. Reference Blot, Mavathur, Geertz, Travers and Muskhelishvili2006; Khodursky et al. Reference Khodursky, Peter, Schmid, Derisi, Botstein, Brown and Cozzarelli2000; Peter et al. Reference Peter, Arsuaga, Breier, Khodursky, Brown and Cozzarelli2004; Zechiedrich et al. Reference Zechiedrich, Khodursky, Bachellier, Schneider, Chen, Lilley and Cozzarelli2000). Transcription of 306 E. coli genes (7% of the genome) was found to be sensitive to changes in DNA supercoiling: 200 genes showed repressed expression and 106 genes showed increased expression upon relaxation of supercoiling (Peter et al. Reference Peter, Arsuaga, Breier, Khodursky, Brown and Cozzarelli2004). Regulation of gene expression through DNA supercoiling is implicated in complex regulatory programs, including those controlling bacterial virulence (Dorman, Reference Dorman and El-Sharoud2008; Dorman & Corcoran, Reference Dorman and Corcoran2009) and the coordination of transcription during growth phase (Blot et al. Reference Blot, Mavathur, Geertz, Travers and Muskhelishvili2006). DNA supercoiling has also been speculated to play a major role in coordinating the unusual development cycle of Chlamydia, by regulating temporal changes in gene expression (Niehus et al. Reference Niehus, Cheng and Tan2008). Certain promoters in Chlamydia were found to be exquisitely sensitive to supercoiling. For example, transcription from the midcycle promoter ompA was 57-fold more efficient from a supercoiled template than from a linear template. Supercoiling levels in Chlamydia were found to vary throughout the developmental cycle (Niehus et al. Reference Niehus, Cheng and Tan2008). Promoter activity was regulated more than 8-fold by simply varying the supercoiling levels over the ranges encountered during the cycle. Superhelical density is highest at midcycle, therefore supercoiling may act as a switch to stimulate transcription from midcycle promoters. The DNA is more relaxed later in the developmental cycle, and therefore it is not surprising that promoters for genes transcribed in the cycle are much less sensitive to supercoiling. In addition to regulating gene expression, DNA supercoiling, itself, appears to be targeted for evolutionary selection (Crozat et al. Reference Crozat, Philippe, Lenski, Geiselmann and Schneider2005, Reference Crozat, Winkworth, Gaffé, Hallin, Riley, Lenski and Schneider2010; Woods et al. Reference Woods, Barrick, Cooper, Shrestha, Kauth and Lenski2011) and regulated in response to environmental stresses. Bacteria, for example, rapidly alter supercoiling in response to heat and cold shock (López-García & Forterre, Reference López-García and Forterre2000).
2.2. Supercoiling and DNA recognition
The importance of functional dynamics of proteins and, therefore, their participation in biological events has been studied in much detail (Brooks et al. Reference Brooks, Karplus and Pettitt1988). Many protein–DNA interactions are studied using purified molecules in the laboratory outside of the more complex cellular environment. Typically, the protein is isolated (or simulated) in its full-length form, in which case all possible elements that contribute to protein dynamics should be present. In stark contrast, the DNA sequence that would be bound by a protein is only a small fraction of the much larger genome (millions–billions of base pairs). Unfortunately, most biophysical and biochemical studies of DNA interacting with proteins employ short, linear DNA fragments because these are much more convenient to use. Thus, unlike proteins, which are studied in the context of the whole molecule, DNA is studied in the absence of many of the possible elements that contribute to DNA dynamics.
The mechanistic explanations for protein–DNA recognition, therefore, usually arise from the analysis of the protein. Any conformational changes observed in the DNA are attributed to the protein, generating a literature that is replete with studies of protein-mediated DNA-binding motifs, electrostatic surfaces, conserved binding sequences, and contact potentials (Ahmad et al. Reference Ahmad, Kono, Araúzo-Bravo and Sarai2006; Chenoweth & Dervan, Reference Chenoweth and Dervan2009; Gromiha et al. Reference Gromiha, Siebers, Selvaraj, Kono and Sarai2004; Nelson, Reference Nelson1995; Steffen et al. Reference Steffen, Murphy, Tolleri, Hatfield and Lathrop2002). Detailed analyses of the thermodynamics of protein binding to DNA have determined that when there is considerable DNA distortion (e.g. DNA bending and base unstacking), the strain leads to unfavorable (positive) enthalpic contribution, which is usually balanced by favorable (positive) entropic contribution (Chaires, Reference Chaires2006; Jen-Jacobson et al. Reference Jen-Jacobson, Engler and Jacobson2000). Despite the large free-energy cost of DNA distortion, many proteins may have evolved to utilize DNA distortion as part of the recognition process (Jen-Jacobson et al. Reference Jen-Jacobson, Engler and Jacobson2000). In all of these studies, the thermodynamics were determined using short, relaxed DNA duplexes; thus, the free energy available from supercoiling is absent from these systems. Although these studies have provided insight into the relationship between proteins and DNA and the thermodynamics of protein recognition of DNA in vitro, protein structure and dynamics do not tell the whole story of protein–DNA interactions. This fact may be one reason why the molecular basis of interactions between proteins and DNA remains somewhat elusive despite several decades of study.
Several observations reveal that focusing mostly on the protein with little consideration of the DNA leads to an incomplete understanding of protein–DNA interactions. For instance, the arrangement of amino acids with apparent specificity for certain nucleic acid bases or DNA sequences can often be altered in regulatory proteins without affecting recognition (Kono & Sarai, Reference Kono and Sarai1999). Changing the identity of a DNA base that is not obviously directly involved in the protein–DNA contact (as deduced from the structures of protein–DNA complexes) can have a significant effect on DNA-binding affinities, whereas changing the identity of a DNA base thought to be directly involved in the protein–DNA contact can have little or no effect (Koudelka & Carlson, Reference Koudelka and Carlson1992; Koudelka et al. Reference Koudelka, Harrison and Ptashne1987). It is not straightforward to predict the DNA sequences and protein motifs involved in a protein–DNA interaction, even when the structure of the protein–DNA complex is known (Shanahan et al. Reference Shanahan, Garcia, Jones and Thornton2004). Furthermore, structural motifs of a protein are insufficient to classify DNA-binding proteins. Prabakaran et al. (Reference Prabakaran, Siebers, Ahmad, Gromiha, Singarayan and Sarai2006) performed a cluster analysis of 62 protein–DNA structures based on parameters describing the protein–DNA interaction and found that different classes of DNA-binding proteins clustered together. They suggested that DNA-binding proteins were best classified by characterizing the protein–DNA structure, rather than by structural motifs of the protein alone. An additional complication in the analysis of protein–DNA interactions arises from the fact that many DNA-binding proteins contain regions that are intrinsically disordered in the absence of DNA and only become ordered upon DNA binding (Love et al. Reference Love, Li, Chung, Dyson and Wright2004; Wright & Dyson, Reference Wright and Dyson1999). Worse, some transcription factors have domains that apparently remained disordered, even after binding (Passner et al. Reference Passner, Ryoo, Shen, Mann and Aggarwal1999).
Olson et al. (Reference Olson, Gorin, Lu, Hock and Zhurkin1998) showed that certain sequence motifs, such as TA steps, act as flexible hinges in the DNA biopolymer, which facilitate molecular recognition through induced fit. Rohs et al. (Reference Rohs, West, Sosinsky, Liu, Mann and Honig2009) showed that A-tract DNA, known to possess a particularly narrow minor groove, is a strong target for positively charged arginine residues, presumably as a consequence of focusing the electrostatic potential from the negatively charged sugar-phosphate backbone. What is clear from these studies is that the overall shape and flexibility of DNA, which governs molecular recognition, is a subtle function of the underlying DNA sequence.
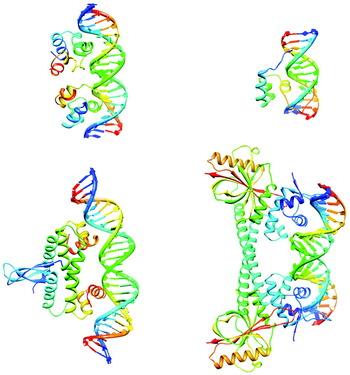
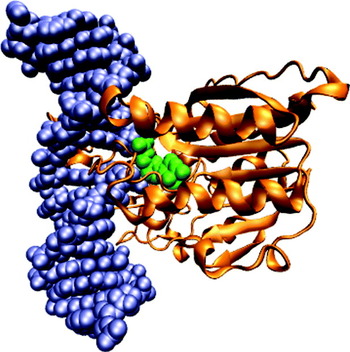
A striking example of supercoiling-dependent DNA–DNA recognition is provided by triplex formation in supercoiled DNA plasmids (Maxwell et al. Reference Maxwell, Burton and O'Hagan2006). Triplex formation occurs when a third DNA strand binds into a section of the major groove of a B-form double helix through Hoogsteen or reverse-Hoogsteen hydrogen bonds (Arnott & Selsing, Reference Arnott and Selsing1974; Hanvey et al. Reference Hanvey, Shimizu and Wells1988). Because the DNA must be underwound by around 4° per base pair in the triplex region (Arnott & Selsing, Reference Arnott and Selsing1974) to create sufficient room in the major groove for the third strand to bind, triplexes form more readily in negatively supercoiled DNA. The correlation between negative supercoiling and triplex binding is so robust that it has been developed into a commercial assay for topoisomerase activity, for example, to screen whether topoisomerases are inhibited by chemotherapeutic drugs (Maxwell et al. Reference Maxwell, Burton and O'Hagan2006). The extent of knowledge regarding how proteins interact with supercoiled DNA is fairly limited, due to the current lack of supercoiled substrates that can be used in quantitative binding assays. Despite this limitation, a number of proteins have been found to preferentially interact with supercoiled DNA. Examples of proteins that are influenced by DNA supercoiling include the bacteriophage 434 repressor, the factor for inversion stimulation (FIS), the MerR transcriptional regulator, and Hin recombinase (Fig. 1). These particular examples have been co-crystallized with a DNA substrate, and the structures of the protein–DNA complexes solved, providing an insight into the protein–DNA interactions. Although the DNA substrates in the complexes are linear, not supercoiled, distortion of the DNA in these complexes provides clues to why supercoiled DNA is a preferred substrate.
Supercoiling and protein–DNA interactions. Top left: the bacteriophage 434 repressor (PDB ID: 3CRO.pdb) has an enhanced affinity for overwound DNA (Koudelka, Reference Koudelka1998). Top right: Hin recombinase (PDB ID: 1HCR.pdb) will only bind to a site containing a CAG/CTG triplet when the DNA is supercoiled (Bae et al. Reference Bae, Yun, Sun, Lim and Choi2006). Bottom left: the FIS protein (PDB ID: 3JRE.pdb) is both a transcription factor and a nucleoid-associated protein that constrains negative supercoils (Stella et al. Reference Stella, Cascio and Johnson2010). Bottom right: MerR (PDB ID: 1R8E.pdb) is a bacterial repressor that on binding Hg (II) activates mercury resistance genes by untwisting the DNA-binding site (Ansari et al. Reference Ansari, Chael and O'Halloran1992).

The 434 repressor binds to DNA using helix-turn-helix motifs (Aggarwal et al. Reference Aggarwal, Rodgers, Drottar, Ptashne and Harrison1988), a structural motif commonly found in DNA-binding proteins. Although the protein binds to a 14 bp sequence, the central 4 bp of this binding site are not involved in direct base-specific contacts with the protein (Koudelka, Reference Koudelka1998). Despite the lack of direct contacts to the central 4 bp, the protein is still able to distinguish between different center sequences. The DNA in the complex is overwound by ~30° at the central base steps and is also markedly bent (Aggarwal et al. Reference Aggarwal, Rodgers, Drottar, Ptashne and Harrison1988; Koudelka & Carlson, Reference Koudelka and Carlson1992). Consistent with this finding was the observation that the repressor has enhanced affinity for overwound DNA, and decreased affinity for underwound DNA (Koudelka, Reference Koudelka1998). Overwinding is required to align the two halves of the binding site to form a strained complex. The relative sequence-dependent ability of the central bases to be overwound is proposed to play a role in distinguishing between different binding sites (Koudelka, Reference Koudelka1998).
Bearing in mind that almost all DNA in cells is underwound (i.e. negatively supercoiled), increased affinity of 434 repressor for overwound DNA is somewhat surprising. Indeed, in most cases where a preference for binding supercoiled DNA is known, negatively supercoiled DNA is preferred. The FIS protein, which also contains helix-turn-helix motifs, is a well-known example of a protein that binds to and constrains negative supercoils. Together with topoisomerases and other nucleoid-associated proteins (e.g. IHF, H-NS, and HU), FIS helps regulate the level of supercoiling in bacterial cells (Dorman & Deighan, Reference Dorman and Deighan2003). DNA supercoiling has been proposed to act as a global regulator of transcription in bacterial cells and FIS has been implicated in the response to changes in supercoiling (Travers & Muskhelishvili, Reference Travers and Muskhelishvili2005). Indeed, mutations in the fis gene, together with mutations in topA, the gene for topoisomerase I, and dusB, which regulates expression of fis, were identified in long-term evolution experiments (Crozat et al. Reference Crozat, Winkworth, Gaffé, Hallin, Riley, Lenski and Schneider2010). The result of these mutations was an overall increase in negative supercoiling, suggesting that supercoiling itself may be a target for evolutionary selection. Although FIS can indiscriminately bind to any DNA sequence, it will preferentially bind certain sequences with higher affinity. The DNA within the complexes for both non-specific and specific binding shows marked curvature and this DNA bending is an essential part of induced fit by the protein (Stella et al. Reference Stella, Cascio and Johnson2010). We have discussed how DNA supercoiling may facilitate protein-induced DNA bends in a prior review (Fogg et al. Reference Fogg, Catanese, Randall, Swick, Zechiedrich, Benham, Harvey, Olson, Sumners and Swigon2009). Supercoiled DNA has significant intrinsic curvature, particularly at the superhelical apices and at helix–helix juxtapostions. Because FIS-induced bending is an essential part of the indirect recognition employed by the protein, intrinsic DNA shape and sequence-dependent deformability are likely to play a role in the recognition (Stella et al. Reference Stella, Cascio and Johnson2010). DNA supercoiling has significant effect on both its shape and its deformability as we will describe in more detail later.
In the previous two examples, DNA distortion played a major role in the protein–DNA interaction, providing clues to how supercoiled DNA may be preferentially recognized. Similarly, the DNA in the complex with Hin-recombinase is stretched and unwound, and this distortion allows exquisite sequence-dependent binding response to DNA supercoiling. A mutated Hin-binding site, hix-AG, containing a CAG/CTG triplet, is bound by Hin only when the DNA is supercoiled (Bae et al. Reference Bae, Yun, Sun, Lim and Choi2006). This particular sequence was found to have high intrinsic twist and bending flexibility (Bae et al. Reference Bae, Yun, Sun, Lim and Choi2006). This flexibility, combined with the extrinsic flexibility afforded by supercoiling, allows the enzyme to respond in both a sequence-dependent as well as a supercoiling fashion. DNA supercoiling is proposed to allow discrimination by only facilitating binding for sequences that have high intrinsic flexibility (Bae et al. Reference Bae, Yun, Sun, Lim and Choi2006).
MerR, a bacterial repressor, becomes a transcriptional activator, Hg-MerR, upon binding mercury (Hg(II)). Unlike the repressor form, the activator form induces unwinding of the mer operator to induce transcription of bacterial mercury-resistance genes (Ansari et al. Reference Ansari, Chael and O'Halloran1992). This localized unwinding rearranges out-of-phase promoter elements to a more optimal phasing, thereby transforming the promoter to a transcriptionally active form. The DNA acts as a transmission line to deliver the message to the RNA polymerase to begin transcription. Thus, the DNA is not a passive, inert partner in the initiation of transcription, but is, in many ways the driver of the process.
2.3. Supercoiling and DNA transcription
Whether a particular gene is up- or down-regulated following an alteration in negative supercoiling in bacteria has been shown to be evolutionarily ‘tunable’ through the adenine and thymine (AT) content of the promoter and coding regions. Enriched AT content is associated with a repression in transcription when the levels of negative supercoiling are increased (Ferrándiz et al. Reference Ferrándiz, Martín-Galiano, Schvartzman and De La Campa2010; Peter et al. Reference Peter, Arsuaga, Breier, Khodursky, Brown and Cozzarelli2004); guanine and cytosine (GC)-rich sequences have a propensity to be repressed when levels of negative supercoiling are decreased. Negative supercoiling stresses the base stacking interactions, thereby weakening the duplex structure and promoting the formation of single-stranded regions. Optimal transcription requires a delicate balance between DNA melting and reannealing. The influence of supercoiling on promoter unwinding and promoter clearance (the dissociation of RNA polymerase from the promoter that allows elongation of the transcript) has been studied at the single molecule level using magnetic tweezers (Revyakin et al. Reference Revyakin, Liu, Ebright and Strick2006). Results from these experiments demonstrate that the mechanical effect of underwinding influences the rate of formation and stability of the open complex during transcription. Promoter clearance in the E. coli galP1 and galP2 was the step most profoundly affected by supercoiling, with negative supercoiling decreasing the number of aborted RNA transcripts and favoring production of full-length RNA (Lim et al. Reference Lim, Lewis, Lee, Liu and Adhya2003).
An additional mechanism for control of transcription by DNA is through supercoiling-induced formation of non-B DNA structures, such as cruciforms, triplexes, quadruplexes, and slipped strand DNA (Bagga et al. Reference Bagga, Ramesh and Brahmachari1990; Belotserkovskii et al. Reference Belotserkovskii, De Silva, Tornaletti, Wang, Vasquez and Hanawalt2007; Dai et al. Reference Dai, Kloster and Rothman-Denes1998; Wang & Vasquez, Reference Wang and Vasquez2006; Zhao et al. Reference Zhao, Bacolla, Wang and Vasquez2010), which can potentially act as roadblocks to elongation, and the formation of folded H-DNA (triplex) structures, as has been observed for the human c-myc gene (Kouzine & Levens, Reference Kouzine and Levens2007). Certain sequences containing alternating purine and pyrimidine bases can form Z-DNA when negatively supercoiled. During this major conformational change, the DNA switches from a right-handed to a left-handed helix, with concomitant base-flipping at the B–Z junction (Ha et al. Reference Ha, Lowenhaupt, Rich, Kim and Kim2005; Wang et al. Reference Wang, Quigley, Kolpak, Crawford, Van Boom, Van Der Marel and Rich1979). A number of Z-DNA-binding proteins have been identified (Rich & Zhang, Reference Rich and Zhang2003), including RNA adenosine deaminase (ADAR1) (Herbert et al. Reference Herbert, Lowenhaupt, Spitzner and Rich1995). The structure of the Z-DNA-binding domain of ADAR1 bound to Z-DNA has been solved (Schwartz et al. Reference Schwartz, Rould, Lowenhaupt, Herbert and Rich1999). Despite this structure, the role of Z-DNA is not fully understood, although it is thought to be involved in gene expression (Rich & Zhang, Reference Rich and Zhang2003; Sinden, Reference Sinden2005). Inherently unstable, Z-DNA requires the energy from negative supercoiling. The prevalence of Z-DNA forming sequences near transcription start sites supports a model for the role of Z-DNA as a transcriptional sensor that is modulated by negative supercoiling (Champ et al. Reference Champ, Maurice, Vargason, Camp and Ho2004).
Just as DNA supercoiling can affect transcription, transcription influences DNA topology. The ‘twin supercoiled domain model’, proposed by Liu & Wang (Reference Liu and Wang1987), envisions the RNA polymerase generating positive supercoils ahead and leaving negative supercoils behind as it moves along the DNA. Although topoisomerases relax positive supercoiling that might otherwise stall the polymerase, transcription-generated supercoiling acts to couple genes into ‘promoter arrays’ that extend over several kb of bacterial chromosome to coordinately enhance or repress transcription (Dorman, Reference Dorman and El-Sharoud2008). There is evidence that, even in a cell with normal concentrations of functional topoisomerases, the dynamic supercoiling persists for up to 30 minutes following transcription (Kouzine et al. Reference Kouzine, Sanford, Elisha-Feil and Levens2008). This result indicates that cellular topoisomerases are unable to immediately keep up with or prevent the build-up of transient transcription-induced torsional stress. The dynamic supercoiling produced as a result was found to propagate across large distances within the genome (Kouzine et al. Reference Kouzine, Sanford, Elisha-Feil and Levens2008), thus promoting conformational changes in far upstream regulatory elements. The DNA may be acting as a ‘transmission line’ by communicating the transcriptional status of one gene to a secondary gene located at a distant site.
2.4. Domain barriers in DNA
The E. coli chromosome is organized into ~400 supercoiled domains, each containing an average of ~10 kb (Postow et al. Reference Postow, Hardy, Arsuaga and Cozzarelli2004 and references therein). These domains are randomly distributed in size and are highly dynamic during the cell cycle. It is thought that individual domains are insulated from topological changes in other domains, such as the effects of supercoil generation by transcription. Therefore, genes that are topologically connected can be altered by repositioning these domain barriers, providing yet another layer of regulatory control over the bacterial genome. The ‘barriers’ that serve to isolate each topological domain are formed either by attachment of the DNA to the cell membrane or by the nucleoid-associated proteins, IHF, FIS, H-NS, and HU (reviewed in Dillon & Dorman, Reference Dillon and Dorman2010; Muskhelishvili et al. Reference Muskhelishvili, Sobetzko, Geertz and Berger2010). Nucleoid-associated proteins can also stabilize supercoiling to a given domain by wrapping the DNA and thereby trapping some of the torsional stress (reviewed in Travers & Muskhelishvili, Reference Travers and Muskhelishvili2007).
2.5. Switchable DNA structural motifs and DNA polymorphism
A remarkable example of the ability of DNA to switch between radically different conformational states in response to supercoiling is provided by the far upstream element (FUSE) of the human c-myc gene (Kouzine et al. Reference Kouzine, Liu, Sanford, Chung and Levens2004, Reference Kouzine, Sanford, Elisha-Feil and Levens2008; Liu et al. Reference Liu, Kouzine, Nie, Chung, Elisha-Feil, Weber, Zhao and Levens2006c). The protein c-Myc, the gene product of c-myc, is a crucial regulator of up to 15% of human genes, and is essential for cell homeostasis, differentiation, and growth (Liu et al. Reference Liu, Kouzine, Nie, Chung, Elisha-Feil, Weber, Zhao and Levens2006c). Improperly regulated, however, c-myc becomes a lethal oncogene and is implicated in many cancers. As both c-myc mRNA and the c-Myc protein are too short-lived to provide an effective feedback mechanism, the cell has evolved an alternative feedback that uses DNA dynamics. The 90 bp FUSE sequence is exquisitely sensitive to DNA supercoiling and denatures to single-strands at a sharp threshold of torsional stress. Binding of the c-myc transcriptional regulator, FUSE-binding protein (FBP), is dependent upon melting of the FUSE sequence to single strands, allowing FBP to bind only when the superhelical density is beyond the threshold level. Elevated supercoiling across the FUSE sequence is likely to be observed only when RNA polymerase is actively transcribing the c-myc gene. FBP activates c-myc transcription, and another protein, the FBP interacting repressor (FIR), represses c-myc transcription. The complex ‘molecular servomechanism’ uses FUSE melting as a sensor of transcription to provide either positive feedback (via FBP), or negative feedback (via FIR) to regulate c-myc transcription.
An additional level of c-myc regulation comes through a 22 bp region within FUSE capable of reannealing, following torsional stress-induced opening, into H-DNA. This H-DNA forms rather slowly (~1 min); consequently, H-DNA does not form in response to the transient supercoiling induced by transcription (Kouzine et al. Reference Kouzine, Liu, Sanford, Chung and Levens2004). This dependence of DNA structure on time subjected to supercoiling stress could potentially be exploited biologically as a genomic timing device. It is possible that not only must a protein recognize a correct sequence, but also only at the correct time. Indeed, changes in supercoiling are associated with biological processes that must include a measurement of time, such as those involved in the cell cycle (Warren & Cook, Reference Warren and Cook1978) and circadian rhythms (Vijayan et al. Reference Vijayan, Zuzow and O'Shea2009). There are numerous additional non-canonical DNA structures, such as left-handed Z-DNA, cruciforms, quadruplexes, and slipped structures that also represent plausible regulation mechanisms (Kouzine & Levens, Reference Kouzine and Levens2007). In addition to altering DNA mechanics, these structures surely interact differently with DNA-binding proteins. Examples of the interplay between DNA supercoiling and DNA metabolism are continuing to be uncovered, and the extraordinarily adaptable beauty of the DNA double helix better appreciated. It is apparent that the ‘protein-centric’ view is naïve.
2.6. How do proteins find their DNA target in large genome?
The DNA genome is enormous relative to the size of a protein. How does a protein find its target DNA site in a virtual sea of competitor DNA? Whereas a protein is thought to encounter only a monotonous negatively charged, ion-screened phosphate backbone, specific DNA sites can be located and bound by proteins with remarkable efficiency, despite the apparent absence of clues to the DNA sequence hidden within. How this recognition is accomplished has been the subject of numerous studies. There may be multiple different mechanisms; one proposed mechanism is a ‘shotgun’ approach, in which the protein initially uses imprecise and/or non-specific interactions in order to shrink the search distance for the specific site (Li et al. Reference Li, Macarthur, Bourgon, Nix, Pollard, Iyer, Hechmer, Simirenko, Stapleton, Hendriks, Chu, Ogawa, Inwood, Sementchenko, Beaton, Weiszmann, Celniker, Knowles, Gingeras, Speed, Eisen and Biggin2008). Studies with EcoRI and Lac repressor have suggested models for how proteins may execute a series of ‘hops’ (three-dimensional, inter-segmental transfers) and ‘slides’ (one-dimensional transfers) to locate a DNA-binding site (Berg et al. Reference Berg, Winter and Von Hippel1981; Modrich, Reference Modrich1982; Winter & von Hippel, Reference Winter and Von Hippel1981; Winter et al. Reference Winter, Berg and Von Hippel1981; and recently reviewed by Halford & Marko, Reference Halford and Marko2004 and Sokolov et al. Reference Sokolov, Metzler, Pant and Williams2005). Other proteins are thought to use similar search mechanisms.
To understand protein–DNA and DNA–DNA interactions, one must consider a more active role for DNA, including the dynamic involvement of the surrounding solvent molecules and counterions, and the fact that the target sequence is part of a much longer genome. DNA in cells is not an inert linear, one-dimensional string of bases, but instead has topological diversity and is subject to constraints that affect its curving, twisting, kinking, base-flipping, denaturing, counterion flux, and likelihood to juxtapose with another DNA helix.
Proteins are thought to locate their target site through a combination of one-dimensional (sliding) and three-dimensional (hopping) search mechanisms, and it is the combination of these two that results in the remarkably rapid target location (Halford & Marko, Reference Halford and Marko2004). Sliding is typically a random search process, the protein goes back and forth along the DNA, with no prevailing direction. The optimal sliding distance is ~100 bp, longer sliding distances result in too much time wasted because the same site may be sampled repeatedly (Halford & Marko, Reference Halford and Marko2004). If the sliding distance is too short, that is, if the search mechanism is mostly three-dimensional, then the proteins waste time by exploring the solvent instead of the DNA sequence. Three-dimensional hopping enables the protein to transfer to a site located at a long distance away from the backbone, such a transfer would be very inefficient by sliding. The compaction that results from DNA supercoiling brings sites that are separated in linear space along the DNA backbone close together in three-dimensional space, thereby facilitating target search (Gowers & Halford, Reference Gowers and Halford2003; van den Broek et al. Reference Van Den Broek, Lomholt, Kalisch, Metzler and Wuite2008; Vologodskii & Cozzarelli, Reference Vologodskii and Cozzarelli1996). Supercoiling should therefore favor three-dimensional over one-dimensional search mechanisms. The effect of supercoiling on target site location is presumably not limited to simply compaction of the DNA. The presence of non-B DNA conformations, such as hairpins, cruciforms, kinks, and flipped-out bases may act as a roadblock to sliding. Similarly DNA crossovers may inhibit movement along the backbone. DNA in vivo is bound by a large number of proteins such as histones and nucleoid-associated proteins which may also act as roadblocks. Because DNA is a highly charged molecule, electrostatic interactions are also extremely important. The effect of supercoiling on the distribution on counterions is sequence-dependent, and therefore the altered charge distribution may act as target on the DNA. The fundamental question of how proteins find their target site, and how DNA supercoiling and the cellular environment affect this process, remains to be answered.
As this role of supercoiling, as well as so much of our understanding of DNA dynamics comes from using theory and molecular simulation to interpret biophysical experiments, we describe these studies in more depth below.
3. Understanding supercoiled DNA at the molecular level by combining modeling and experiment
3.1. Elastic rod models of supercoiled DNA
Until recently, the most common theoretical and computational models capable of treating DNA molecules of a sufficient size to allow consideration of topology have reduced the complexity of DNA by assuming that it behaves as an isotropic elastic polymer (Shimada & Yamakawa, Reference Shimada and Yamakawa1985). Elastic polymer models have been used to study DNA knotting (Schlick & Olson, Reference Schlick and Olson1992) and looping (Jian et al. Reference Jian, Schlick and Vologodskii1998; Merlitz et al. Reference Merlitz, Rippe, Klenin and Langowski1998; Vologodskii et al. Reference Vologodskii, Levene, Klenin, Frank-Kamenetskii and Cozzarelli1992). To model supercoiling in a closed circle of DNA (e.g. to model a plasmid) or an end-constrained segment, the free energy of supercoiling, ΔG SC, is assumed to obey Hooke's Law and to be proportional to the square of the linking difference, i.e.,

where K is the spring constant. Normalizing to the size of the circle gives:
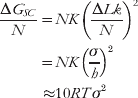
assuming NK=1100RT and h=10.5 bp/turn (Bates & Maxwell, Reference Bates and Maxwell2005). As previously described, there is a trade-off between twist and writhe for a given ΔLk. Writhing reduces torsional strain, but requires bending at the apices of a supercoiled loop. Consequently, the amount of writhe in a DNA loop at a given superhelical density will depend on the relative magnitudes of the bending and torsional rigidity. In linear elastic models, bending and twisting deformations of the DNA helix are also usually assumed to follow elastic theory with

and

where L is the axial length of the DNA helix, B (350 kJ/mol bp) and C (440 kJ/mol bp) are the bending and twisting moduli, and θ and φ are the bending and twisting angles, respectively, in radians. The energetics of supercoiled DNA are also influenced by electrostatics. Elastic rod models typically consider the contribution of electrostatics along the DNA by including it in the model of persistence length. Solvent-mediated backbone interactions are often neglected in these coarse-grained models, which sometimes assume that the electrostatic screening is sufficiently strong that it can be neglected over mesoscopic length scales.
Other mesoscale physical models of DNA include the so-called worm-like chain models, which typically discretize the length of the helix into a series of rigid rods, each with length approximately equal to the persistence length of DNA (~30–50 nm). After two persistence lengths, there is little correlation between the directions of the two ends of a DNA segment; therefore, this is the length of a segment that can be approximately considered freely jointed. Because Kuhn recognized the power of such statistical segments, the sum of two persistence lengths is known as a Kuhn statistical length (Kuhn, Reference Kuhn1934). The angles between adjacent rods are sampled from a Boltzmann distribution according to the assumptions of the rigidity of the molecule. Until recent work (Liverpool et al. Reference Liverpool, Harris and Laughton2008; Wiggins et al. Reference Wiggins, Phillips and Nelson2005; Yan & Marko, Reference Yan and Marko2004; Yan et al. Reference Yan, Kawamura and Marko2005; Zhang & Crothers, Reference Zhang and Crothers2003), the worm-like chain models neglected local, sequence-dependent, non-linear deformations, and potential asymmetric internal energies of DNA that result from DNA bending and torsional stress, all of which should affect protein–DNA interactions.
The continuum worm-like chain models work well to explain average effects of long DNA molecules, as measured by single molecule manipulation experiments and simulation at low torsional forces (Marko et al. Reference Marko, Feig, Pettitt, Russo, Salahub and Witko2003; Strick et al. Reference Strick, Allemand, Bensimon and Croquette1998; Vologodskii, Reference Vologodskii2006). The DNA dynamics sampled in these coarse-grained models, however, occur over length scales much larger than the DNA sequence recognized by a DNA-binding protein. Models of the dynamics of large DNA molecules (Benham & Mielke, Reference Benham and Mielke2005) typically require coarse graining or simplifying assumptions, such as modeling the DNA as flexible rods with substantial persistence lengths (McCammon & Harvey, Reference Mccammon and Harvey1987), and these models fail to reveal the intricacies of DNA dynamics at the atomic and molecular level where molecular recognition operates. Thus, averaged behavior can obfuscate local variations that could be important for DNA recognition. Consequently, the importance of DNA topology to DNA recognition is not fully explored. The models have no atomic details and break down when structural deformations, including torsional deformations well within the biological realm, are present. Because these models assume constant values for the effective diameter, persistence length, and charge density of DNA, in effect the theory assumes Lk 0 is constant despite its strong dependence on temperature, sequence, and the ionic strength of the solvent. As explained below, molecular dynamics (MD) simulations are able to reveal atomistic detail, but even with advances in computing power, these simulations are still typically restricted to small DNA fragments and short timescales. Classical elastic models allow for much longer sequences and timescales to be sampled than may be achieved with MD simulations. Refinements to the classical elastic models that incorporate the findings from studies of DNA mechanics at the atomistic level such as sequence-dependent flexibility (Czapla et al. Reference Czapla, Swigon and Olson2006), denaturation, and non-linear elasticity (Liverpool et al. Reference Liverpool, Harris and Laughton2008), provide a more accurate description of DNA mechanics and help bridge the gap between coarse-grained and atomistic models. These findings, discussed below, have provided greater insight into the complex behaviors of the various topological forms of DNA, and the forces and ionic environment that modulate them.
3.2. DNA mechanics at the atomistic and molecular level
There is currently no experimental information about the structure of supercoiled DNA at the atomistic level, as it has not yet been possible to obtain a crystal structure or high-resolution nuclear magnetic resonance (NMR) structure of DNA long enough to be a closed loop. Nonetheless, relatively recent computer simulations coupled with experimental data have led to insight and understanding of DNA mechanics at the atomistic level. Biochemical experimentation has provided indirect evidence that DNA forms a rich repertoire of structures in response to torsional stress. Computer simulation studies have provided atomistic details of what these structures might look like.
3.3. Sequence-dependent bending flexibility of DNA
DNA packaging and DNA looping are examples of processes that involve considerable distortion and bending of the DNA helix to achieve. Despite the energetic expense, sharp DNA bending plays a critical role in these and many other fundamental processes (Garcia et al. Reference Garcia, Grayson, Han, Inamdar, Kondev, Nelson, Phillips, Widom and Wiggins2007).
Consider, for example, packaging of DNA in eukaryotes. DNA is very tightly packed into the nucleus, the first stage of this packing is wrapping the DNA around histones to form the nucleosome. The DNA is wrapped approximately 1.7 times around the core of the nucleosome, over a very short length of DNA (147 bp). The persistence length of DNA, the scale over which the biopolymer is essentially a rigid rod, is ~150 bp. Thus, the DNA in the nucleosome has extreme curvature. The structure of the nuclesome (Luger et al. Reference Luger, Mäder, Richmond, Sargent and Richmond1997) revealed that this is achieved not via a smooth-bending regime, but is instead mediated by a number of distinct bends at positions around the nucleosome. Pioneering work by the late Jonathan Widom has begun to unravel how nucleosome positioning is strongly influenced by sequence-dependent variations in the ability of the DNA to be sharply bent (Segal et al. Reference Segal, Fondufe-Mittendorf, Chen, Thåström, Field, Moore, Wang and Widom2006). Packaging of the DNA into the heads of viruses also requires considerable bending (Garcia et al. Reference Garcia, Grayson, Han, Inamdar, Kondev, Nelson, Phillips, Widom and Wiggins2007) because of the confined space that the viral genome must be packed into. Extremely small DNA loops, significantly smaller than the persistence length of DNA are thought to occur at the center of viral heads.
Another process that requires considerable bending and distortion is DNA looping. In this process, a protein (or proteins) is simultaneously bound to two spatially separated sites on the DNA, looping out the intervening DNA. It has been suggested that the vast majority of DNA reactions are mediated, not by a single protein acting at a single site as is often envisioned, but instead by proteins interacting with two or more sites spaced apart on the DNA (Halford et al. Reference Halford, Welsh and Szczelkun2004). DNA looping over long distances, much greater than the persistence length, is not limited by DNA flexibility, but is instead influenced by how proteins are able to locate the two separate sites. As explained earlier in this review, this search mechanism, and the juxtaposition of two sites separated by a long stretch of sequence, is facilitated by DNA supercoiling. DNA looping of short intervening sequences is strongly influenced by DNA flexibility. Sharply bent DNA loops are a common feature of mechanisms of transcriptional regulation, one of the most well-known best studied of these being the lac operon (Jacob & Monod, Reference Jacob and Monod1961). The Lac repressor regulates transcription by binding to two operator sites close together on the DNA. The intervening DNA is sharply bent making the lac repressor an excellent model system for studying DNA looping in vitro (Rutkauskas et al. Reference Rutkauskas, Zhan, Matthews, Pavone and Vanzi2009), in vivo (Bond et al. Reference Bond, Peters, Becker, Kahn and Maher2010), and by modeling (Swigon et al. Reference Swigon, Coleman and Olson2006).
The most common explanation for sharp DNA bending is that protein binding provides the large force required to overcome the intrinsic bending resistance of short DNA helices (Maher, Reference Maher1998). Inherent in this assumption is that DNA behaves according to classical models of DNA elasticity, therefore sharp bending requires large forces to overcome the intrinsic stiffness of DNA. Consequently, spontaneous formation of small DNA loops in protein-free DNA was largely ignored until Cloutier & Widom (Reference Cloutier and Widom2004), while studying DNA looping in gene regulation, found that some DNA sequences, including nucleosome-positioning sequences, are much more flexible than predicted by classical models of DNA flexibility (Crothers et al. Reference Crothers, Drak, Kahn and Levene1992; Merlitz et al. Reference Merlitz, Rippe, Klenin and Langowski1998; Podtelezhnikov et al. Reference Podtelezhnikov, Mao, Seeman and Vologodskii2000; Zhang & Crothers, Reference Zhang and Crothers2003; Zhang et al. Reference Zhang, Mcewen, Crothers and Levene2006). By measuring circularization of short DNA sequences by DNA ligase, they found these sequences cyclize three to five orders of magnitude more efficiently than predicted. Furthermore, the torsional flexibility of these efficiently ligated DNA sequences exceeded theoretical predictions by 400-fold (Cloutier & Widom, Reference Cloutier and Widom2005). Continuum models fail to predict topological and geometrical properties of small DNA circles when the DNA length is much shorter than the persistence length of linear DNA and the internal structure of the duplex is perturbed.
Although the interpretation of the experimental results of Cloutier and Widom continues to be debated (Demurtas et al. Reference Demurtas, Amzallag, Rawdon, Maddocks, Dubochet and Stasiak2009; Du et al. Reference Du, Smith, Shiffeldrim, Vologodskaia and Vologodskii2005), new theories provide plausible explanations for their results. Both Du et al. (Reference Du, Smith, Shiffeldrim, Vologodskaia and Vologodskii2005) and Wiggins et al. (Reference Wiggins, Phillips and Nelson2005) modified traditional DNA bending theory to allow for ‘rare’ transient appearances of sharp DNA kinks, while others proposed a role for spontaneous melting of base pairs (Liverpool et al. Reference Liverpool, Harris and Laughton2008; Yan & Marko, Reference Yan and Marko2004; Yan et al. Reference Yan, Kawamura and Marko2005). The idea that strong bending in DNA would produce distinct ‘kinks’ was first proposed by Crick & Klug (Reference Crick and Klug1975), and kinks have been observed in a variety of protein–DNA crystal structures, including the nucleosome–DNA complex (Richmond & Davey, Reference Richmond and Davey2003) and the TATA binding protein–DNA complex (Kim et al. Reference Kim, Nikolov and Burley1993a, Reference Kim, Geiger, Hahn and Siglerb). Investigating the behavior of DNA in the sharp bending regime is a difficult undertaking and the evidence for kinks in protein-free DNA remains controversial.
Missing from these analyses, however, was any consideration of inherent sequence-dependent DNA deformability. Models that incorporate sequence-dependent flexibility can explain the results of Cloutier and Widom without the need to invoke large or artificial distortions of the DNA. Olson and co-workers (Czapla et al. Reference Czapla, Swigon and Olson2006) developed a coarse-grained model of DNA flexibility to account for sequence-dependent variability of each base pair step and these account for the intrinsic flexibility of the nucleosome-positioning sequences used by Cloutier and Widom (Balasubramanian et al. Reference Balasubramanian, Xu and Olson2009; Tolstorukov et al. Reference Tolstorukov, Colasanti, McCandlish, Olson and Zhurkin2007). In addition, direct visualization of the 94 bp minicircles by electron cryomicroscopy revealed no evidence of sharp kinks in the backbone (Demurtas et al. Reference Demurtas, Amzallag, Rawdon, Maddocks, Dubochet and Stasiak2009).
Recently published data suggest that high levels of torsional strain can result in distorted sites, e.g., denaturation bubbles and wrinkled conformations (Mitchell et al. Reference Mitchell, Laughton and Harris2011). This underwinding destabilized DNA may act as a hyperflexible site. This was supported by recent electron cryomicroscopy data showing evidence of DNA kinks at two distinct sites in torsionally strained minicircles (Lionberger et al. Reference Lionberger, Demurtas, Witz, Dorier, Lillian, Meyhöfer and Stasiak2011). This kinking was proposed to occur in a cooperative, sequential manner. Kinking at the first site induced sharp bending resulting in a second kink located approximately 180° apart from the first kink along the circumference of the DNA. The elastic properties of torsionally strained and sharply bent DNA remain a controversial and poorly understood subject. Because much of the evidence for DNA kinks, and other sequence-dependent DNA distortions, comes from MD simulations; we describe these studies in more depth below.
3.4. All-atom MD simulations of minicircles
Thus, it is provident that as we begin to realize the limitations of elastic polymer models, advances in computing power are making feasible all-atom MD simulations of DNA long enough to be circularized. This allows the DNA to be under- or overwound in the simulations and therefore exhibit more physiologically relevant behavior. Unlike worm-like chain models, all-atom models explicitly take into account bond lengths, bond angles, dihedral angles, van der Waals forces, and electrostatic forces in saline solution, allowing more realistic modeling of DNA structure and dynamics. All-atom models allow simulations of DNA, for any sequence and with explicit solvent and salt. Explicit atomic simulations of short, linear DNA molecules also yield values of the elastic stretching-deformation constants in good agreement with the parameters of the mesoscale elastic models (Marko et al. Reference Marko, Feig, Pettitt, Russo, Salahub and Witko2003).
It is important to note that even the most recent DNA forcefields, such as the AMBER parmbsc0 forcefield, underestimate the twist of DNA by around 2° per base pair (Pérez et al. Reference Pérez, Lankas, Luque and Orozco2008), and this must be corrected for when calculating the superhelical density of an in silico DNA loop (Mitchell et al. Reference Mitchell, Laughton and Harris2011). In addition, care must be taken not to overinterpret the results of atomistic MD as being applicable to all systems, as each simulation is only able to provide information about the sequence being interrogated and over a very limited timeframe. The huge computational expense of atomistic MD means that even with the largest current supercomputing facilities, simulation timescales are generally less than a microsecond for sequences containing more than ~20 bp. Because DNA dynamics typically occur over timescales far longer than a microsecond, larger driving forces are typically used in silico than are actually encountered by the DNA in experiment. For example, simulations that twist DNA exert stronger torsional forces than the equivalent manipulation experiments to induce the same structural changes during the timeframe of the simulation (Wereszczynski & Andricioaei, Reference Wereszczynski and Andricioaei2006). Although state-of-the-art simulations improve conformational sampling by performing multiple calculations, they are still nowhere near the degree of ensemble averaging inherent in a biochemical experiment. Even manipulation experiments that probe the dynamics of a single-DNA molecule must be repeated many times to interpret the results from the stochastic behavior of a single molecule. Despite these caveats, the ability of atomistic simulation to provide a structural model of dynamic DNA processes has made it invaluable in interpreting the results of biochemical assays and single molecule experiments at the molecular level and also in the prediction of novel behaviors such as kinking, base-flipping, denaturation, and local fluctuations in twist and writhe.
Lankas et al. (Reference Lankas, Lavery and Maddocks2006) used all-atom MD simulations to model the 94 bp Cloutier & Widom (Reference Cloutier and Widom2004) sequence to attempt to provide an explanation for the anomalously high bending flexibility observed. They performed five 80 ns simulations of 94 bp DNA minicircles in explicit solvent with monovalent ions. Two of the minicircles in these simulations were slightly overwound; three were torsionally relaxed. The simulations revealed localized destacking or kinking caused by the acute curvature in these small circles that was exacerbated by torsional stress.
The predominant type of kink observed resulted from a negative roll angle between two consecutive base pairs relative to the major groove edge. Only a single example of an alternative type of kink was observed and it was found in one of the positively supercoiled helices. This kink was composed of three consecutive base pairs where the central base pair denatured and its bases remained stacked with the 5′ neighboring base. These results have been questioned because of flaws in the AMBER ff94 forcefield used (Svozil et al. Reference Svozil, Sponer, Marchan, Pérez, Cheatham, Forti, Luque, Orozco and Sponer2008). Although the forcefield used in these calculations has been updated (Pérez et al. Reference Pérez, Lankas, Luque and Orozco2008), and the detailed bending forces required to generate kinks is still under debate (Curuksu et al. Reference Curuksu, Zacharias, Lavery and Zakrzewska2009), these initial minicircle MD studies were the first glimpse into the atomic detail of DNA as a function of bending and twisting. Most importantly, they showed that torsional or bending stress may induce structural transitions in DNA in the absence of protein, and, consequently, that the ability of DNA to kink may be an inherent property of DNA.
Building upon the results of Lankas and co-workers, Harris et al. (Reference Harris, Laughton and Liverpool2008) used all-atom MD simulations to study the effects of torsional stress on the structure of minicircles containing between 90 and 178 bp to determine the physical principles underlying the partitioning of twist and writhe as a function of superhelical density, salt concentration, and DNA length. The 90 bp circles were modeled in explicit water and counterions, however, the larger 178 bp circles were modeled using the Generalized Born (GB/SA) implicit solvation method, in which the water and counterions are treated as a dielectric continuum. This approach allowed exploration of a wider range of DNA lengths and superhelical densities than Lankas et al. (Reference Lankas, Lavery and Maddocks2006), although each one was explored in less detail, and less accurately in the case of the implicit solvation simulations.
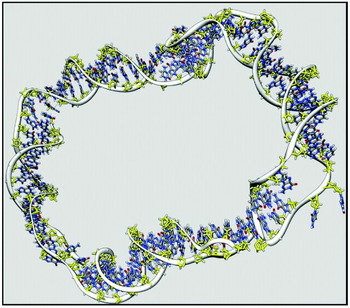
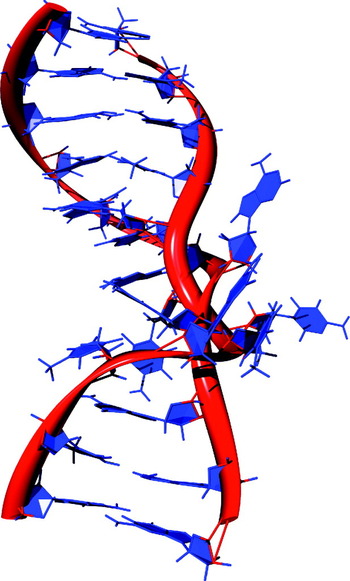
Because of the large torsional stresses investigated, Harris et al. (Reference Harris, Laughton and Liverpool2008) observed many different structural distortions and deformations in the DNA duplex, including ~3 bp denatured regions in highly underwound (σ≈−0.1) circles, as shown (Fig. 2). In addition to revealing the various types of defects likely to form in supercoiled DNA, the calculations also showed that the shape of small, supercoiled DNA circles depends upon a delicate balance of a number of energetic terms (Harris et al. Reference Harris, Laughton and Liverpool2008). Writhe was suppressed when the unfavorable bending energy at the apices and electrostatic repulsion at the DNA–DNA crossing points exceeded the free energy available from supercoiling. Writhing was easier in larger DNA circles because although the bending energy required to form the apices remained approximately the same, there was more supercoiling free energy available for the larger DNA molecule. Increasing the salt concentration promoted conversion of twist into writhe by screening the DNA electrostatic repulsion, especially at the point where the two strands crossed. These results suggest that that the overall shape of DNA is determined by variables that can potentially be biologically controlled.
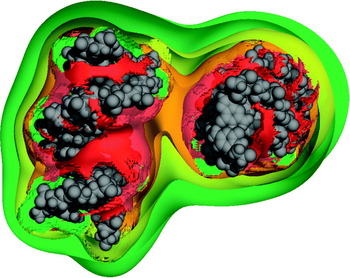
Representative structure from a MD simulation of a highly underwound 90 bp d(GC)90 minicircle (Harris et al. Reference Harris, Laughton and Liverpool2008). Denatured regions are clearly visible within the duplex. Image was generated using Chimera (Pettersen et al. Reference Pettersen, Goddard, Huang, Couch, Greenblatt, Meng and Ferrin2004).

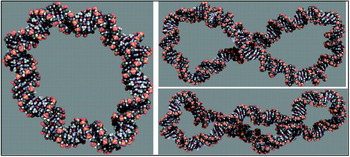
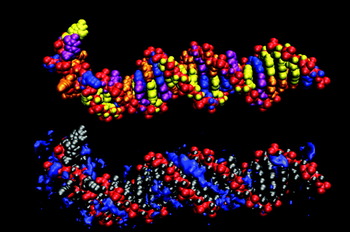
The simulations of Harris et al. (Reference Harris, Laughton and Liverpool2008) indicated that there is a distinct asymmetry between the mechanical effects of overwinding and underwinding DNA minicircles (Fig. 3), and simulation results for linear DNA agreed (Kannan et al. Reference Kannan, Kohlhoff and Zacharias2006; Randall et al. Reference Randall, Zechiedrich and Pettitt2009; Wereszczynski & Andricioaei, Reference Wereszczynski and Andricioaei2006). Although both underwound and overwound duplexes were found to denature under extremely high torsional stresses, the overwound sequences were considerably more resistant. Overtwisting pushes the stacked bases closer together and underwinding pulls them apart. Therefore, it is not surprising that underwound DNA is more prone to denaturation than overwound DNA. Less well understood is the difference in the propensity of overtwisted and undertwisted minicircles to adopt writhed conformations. Although overwound circles of only 90 bp formed writhed structures in explicit solvent and minimal salt, the underwound writhed state was far more elusive and required larger circles (178 bp) and high (1 M) salt concentrations.
Representative structures from MD simulations of d(GC)n minicircles (Harris et al. Reference Harris, Laughton and Liverpool2008), showing a relaxed 90 bp DNA circle (left), an underwound and writhed 178 bp minicircle (top right) and an overwound and writhed 178 bp circle (bottom right). Images generated using QuteMol (Tarini et al. Reference Tarini, Cignoni and Montani2006).

The smaller minicircles studied had particularly curious properties. It was possible to ‘tune’ the superhelical density of 148 bp minicircles in high salt so that the energy cost for bending the apices of the writhed loop plus the electrostatic energy cost of forming the crossing point was almost exactly balanced by the free energy associated with the negative superhelical stress in the circle. These circles were conformationally ‘frustrated’ and exhibited particularly large thermal fluctuations between writhed and open circular structures (Harris et al. Reference Harris, Laughton and Liverpool2008), implying that there is a rapid transition between the two states. Under the same conditions, no equivalent behavior was detected for overwound circles. The biological implications of the ability of negatively supercoiled DNA to exist in a state of tension in which twist and writhe are continuously repartitioned through thermal fluctuations are unknown, but the ability to regulate the partition between twist and writhe allows exquisite potential switching between active and inactive DNA states. Increased negative twist will facilitate localized denaturation of the double helix to expose the DNA bases; increased writhe will facilitate site-juxtaposition. A protein may be able to exploit this balance and transiently shift the equilibrium to either state for the duration of binding.
3.5. Exploring DNA structure using supercoiled minicircles
Circular DNAs smaller than 500 bp are extremely useful because they are experimentally tractable. Their small size means than specific sequences can be studied without the complications of a large excess of non-specific DNA. Additionally, homogenous populations of a single topoisomer with defined Lk can be isolated. Minicircles of varying Lk can be readily generated, including ones with negative and positive supercoiling. Biochemical experiments with topologically defined minicircles have lagged behind simulations, in large part because of the difficulty in making minicircles in quantities sufficient for most biophysical analyses. Du et al. (Reference Du, Kotlyar and Vologodskii2008) devised a way to isolate very small DNA minicircles (albeit in very limiting quantities) to probe the effect of curvature on structural deformations in DNA. They synthesized linear duplex DNA with long single-stranded DNA tails having cohesive ends and then annealed, polymerized, and ligated the DNAs. In this way, circles ranging from 63 to 205 bp were made and probed for kinks like those observed in the MD simulations of Lankas et al. (Reference Lankas, Lavery and Maddocks2006). Assuming a helical repeat of 10.5 bp/turn, a 63 bp circle should have an integral number of helical turns (Lk=6). The Du and co-workers’ method ligation, somewhat surprisingly, yielded two topoisomers, one of these was interpreted as being torsionally relaxed (ΔLk ~ 0) and the other topoisomer interpreted as being significantly underwound (ΔLk ~−1). Structural distortions were detected by probing the minicircles with the nucleases, BAL-31 or S1. BAL-31 is thought to preferentially recognize single base pair distortions of the DNA duplex, whereas S1 requires a larger region of denatured DNA for maximal nucleolytic activity (Desai & Shankar, Reference Desai and Shankar2003; Fuchs, Reference Fuchs1975; Lau & Gray, Reference Lau and Gray1979; Legerski et al. Reference Legerski, Gray and Robberson1977); however, the exact mechanism by which these nucleases interact with and act on DNA is unclear. Using these probes, Du and co-workers found that even the torsionally relaxed (ΔLk~0) 63 bp circles appeared to contain defects, as indicated by endonucleolytic cleavage by BAL-31. These defects are presumably the result of the bending stress in the tiny circles, although the slow digestion rate suggested that these defects were rare. The underwound (ΔLk~−1) topoisomer of the 63 bp circles was rapidly digested by both enzymes, indicating that these circles contain regions of single-stranded DNA, possibly as a consequence of the considerable torsional stress. Larger circles (84–205 bp) were only sensitive to either enzyme if underwound (i.e. torsionally strained), from which the authors concluded that the bending stress, alone, was insufficient to cause disruptions in the larger circles. MD simulations of relaxed 65 bp minicircles with the same sequence as the Du et al. (Reference Du, Kotlyar and Vologodskii2008) study (with an extra 2 bp added to correct for known underestimation of twist in the AMBER forcefield), revealed sharp kinks and denaturated bubbles in response to bending stress, in close agreement with the observations from experiment (Mitchell et al. Reference Mitchell, Laughton and Harris2011). Underwound (ΔLk ~−1) 65 bp circles contained more significant disruptions including regions of single-stranded DNA, again in agreement with observations from experiment (Mitchell et al. Reference Mitchell, Laughton and Harris2011).
Employing a technique to make much greater quantities of supercoiled minicircles, albeit not as small as the minicircles studied in Du et al. (Reference Du, Kotlyar and Vologodskii2008), Zechiedrich and co-workers studied writhing as a function of superhelical density (Fogg et al. Reference Fogg, Kolmakova, Rees, Magonov, Hansma, Perona and Zechiedrich2006). The approach allowed multiple topoisomers with different discrete ΔLk values to be analyzed, including highly underwound minicircles that may replicate the transient extreme supercoiling generated by transcription and replication. Underwinding by one helical turn in a 339 bp circle induced a conformational change significant enough to increase the electrophoretic mobility of the DNA, indicating writhe (Fogg et al. Reference Fogg, Kolmakova, Rees, Magonov, Hansma, Perona and Zechiedrich2006). Further increases in underwinding generated increasingly tightly interwound, multiply writhed, rod-shaped conformations with very narrow radius of curvature at the superhelical apices, as visualized by atomic force microscopy. Highly writhed underwound minicircles were only observed in the presence of divalent counterions. Presumably in the absence of counterion screening, torsional strain in hypernegatively supercoiled minicircles is relieved by denaturation. In contrast to underwound DNA, positively supercoiled minicircles are able to writhe even under conditions of low counterion screening (Fogg, J.M, Catanese, D. J. and Zechidrich, L., manuscript in preparation). The powerful combination of biochemical studies on small DNA circles with atomistic simulation are starting to reveal the structural richness of supercoiled DNA, which may contain strong bends, local kinked deformations, denatured regions, and in which writhing may bring regions of the same molecule into close proximity.
3.6. Simulating twist in the absence of writhe
The Harris et al. (Reference Harris, Laughton and Liverpool2008) study looked at the effect of ΔLk on DNA structure and geometry without any explicit restrictions on the interconversion between Tw and Wr. In cells, there are situations where DNA is pulled taut or is sterically constrained, and, thus, writhe may be inhibited. For example, consider the combination of the extraordinary speed with which DNA is replicated and the force exerted on the DNA as it is polymerized. Single molecule studies reveal that a single DNA (replication) or RNA (transcription) polymerase exerts a transient force of 34 and 20 pN on the double helix, respectively (Dumont et al. Reference Dumont, Cheng, Serebrov, Beran, Tinoco, Pyle and Bustamante2006; Wang et al. Reference Wang, Schnitzer, Yin, Landick, Gelles and Block1998; Wuite et al. Reference Wuite, Smith, Young, Keller and Bustmante2000; Yin et al. Reference Yin, Wang, Svoboda, Landick, Block and Gelles1995). The application of as little as ~1 pN tensile force is enough to prevent writhing of underwound DNA causing the DNA to behave in ways not predicted by classical elastic rod or worm-like chain models (Strick et al. Reference Strick, Allemand, Bensimon and Croquette2000). In contrast, 8 pN of tensile force is required to prevent writhing of overwound DNA (Strick et al. Reference Strick, Allemand, Bensimon and Croquette2000). Consequently, the intermolecular force involving one polymerase may be enough to prevent DNA rapidly ‘springing’ back into B-form following transcription or replication.
Modeling the effect of torsional stress in the absence of writhe is non-trivial because an unrestrained underwound or overwound linear helix quickly relaxes, and circular DNA writhes or kinks. Randall et al. (Reference Randall, Zechiedrich and Pettitt2009) employed periodic boundary conditions in MD simulations to simulate a helix that was unbent, yet circular with infinite radius. For systems of reasonable repeat length in the simulations, the roughly linear configuration of the DNA precluded the formation of writhe. MD simulations incorporating twist via periodic boundary conditions were used to test 19 systems generated from the same DNA sequence with σ ranging from −0.220 to 0.391 during 10 ns simulations. There were significant differences in the dynamics and structure to simulate a response of DNA to underwinding and overwinding, contrary to the assumptions of elastic polymer models, but in agreement with single-molecule force extension experiments (reviewed in Bustamante et al. Reference Bustamante, Bryant and Smith2003; Marko, Reference Marko, Benham, Harvey, Olson, Sumners and Swigon2009), and the simulations of Harris et al. (Reference Harris, Laughton and Liverpool2008) . For underwound DNA, the twist deficit was completely absorbed into regions of base-flipping and local denaturation, which allowed the remainder of the helix to return to the relaxed B-form structure (Randall et al. Reference Randall, Zechiedrich and Pettitt2009). Consequently, the helix became partitioned into regions of localized structural failure and relaxed B-form (Fig. 4). This behavior differs from that predicted by an elastic rod where the underwinding would distribute evenly over the length of the DNA helix. Outside of the localized defects, the remainder of the DNA reverts to B-form. Within the sections reverted back, the average base pair step parameters (Fig. 5), major groove width, minor groove width, and helical diameter, approach the B-form values predicted by NMR and X-ray crystallography data for the DNA sequence (Lankas et al. Reference Lankas, Sponer, Langowski and Cheatham2003; Olson et al. Reference Olson, Gorin, Lu, Hock and Zhurkin1998).
Representative structure from an MD simulation of a highly underwound (σ=−0.135) DNA duplex (Randall et al. Reference Randall, Zechiedrich and Pettitt2009). The helix partitions into regions of localized structural failure allowing the remainder of the helix to adopt relaxed B-DNA. This is related to the ion atmosphere (bottom). Counterion densities are contoured in dark blue showing the expected signatures in the grooves of the B-DNA region and the atypical response in the regions of structural failure.

Base pair step parameters as a function of σ. The filled circles show the average values of the parameters over the last 4 ns of simulations of DNA helices with fixed σ in a system that prohibits writhe (Randall et al. Reference Randall, Zechiedrich and Pettitt2009). The horizontal dashed lines are the values of a relaxed helix with the same sequence, as predicted by analysis of PDB structures (Olson et al. Reference Olson, Gorin, Lu, Hock and Zhurkin1998). The sloped dashed line shows what the average twist would be if uniformly distributed over the length of the DNA.

The partitioning of torsional stress between helix failure and B-form was found in all of the underwound systems of Randall et al. (Reference Randall, Zechiedrich and Pettitt2009) in contrast to the helix partitioning observed by Kannan et al. (Reference Kannan, Kohlhoff and Zacharias2006) that occurred only at extreme underwinding (σ⩽−0.25). In the simulations of Kannan et al. limitations in computing power at the time resulted in helical twist being constrained for only 1.2 ns at a time. Even in the few years between the studies, the rapid increase in computing power has made longer simulations feasible. Thus, because 1.2 ns was not enough time to observe the base-flipping and denaturation events that occurred in all of the underwound systems of Randall et al. (Reference Randall, Zechiedrich and Pettitt2009), the time scale sampled in the simulations of Kannan et al. was likely too short to allow the DNA structure to equilibrate.
For 0<σ⩽0.28, DNA behaved like an elastic rod on the time scales sampled (Randall et al. Reference Randall, Zechiedrich and Pettitt2009). Twist increased linearly with increased σ, and other base pair step parameters varied with σ in accordance with predicted behavior. Thus, previous results and conclusions using worm-like chain models accurately describe DNA locally only in the low to moderate overwinding regime. At σ>0.28, a localized region of DNA showed a structural failure and rapidly transitioned into an inside-out configuration, while the rest of the double helix DNA relaxed back to B-form (Fig. 6). This bimodal distribution between complete structural failure and normal helix is similar to what was observed for underwound DNA. The inside-out conformation of DNA (Fig. 7) is reminiscent of Linus Pauling's proposed structure of DNA where the backbone phosphates intertwined and the bases splayed outward (Pauling & Corey, Reference Pauling and Corey1953), and thus is referred to as Pauling-like DNA (P-DNA).
Representative structure from an MD simulation of a highly overwound (σ=0.391) DNA duplex (Randall et al. Reference Randall, Zechiedrich and Pettitt2009). The very high torsional strain is relieved by the formation of a 5 bp region of P-DNA, allowing the remainder of the helix to relax back to B-DNA (bottom). Counterion densities are contoured in dark blue showing the expected signatures in the grooves of the B-DNA region. In the region of P-DNA, counterions are highly concentrated near the intertwined negatively charged backbones.

The structure of a P-DNA region as determined by MD simulations. The DNA structure shown in Fig. 6 was rendered as a cartoon view with periodic boundary conditions translated to the center of the cartoon view to facilitate visualization of the P-DNA. The path of the DNA backbone is rendered as a red ribbon, bases are in blue.

P-DNA was originally hypothesized to explain results of single molecule experiments of overwound DNA (Allemand et al. Reference Allemand, Bensimon, Lavery and Croquette1998; Wereszczynski & Andricioaei, Reference Wereszczynski and Andricioaei2006). Evidence for the presence of P-DNA in positively supercoiled DNA had previously come from chemical probing experiments. McClellan & Lilley (Reference Mcclellan and Lilley1991) induced positive ΔTw in an alternating AT sequence in plasmid DNA, by intercalation of actinomycin D, which introduces negative ΔTw, at GpC sequences, thereby generating compensatory positive ΔLk elsewhere in the closed-circular substrate that had previously been relaxed by topoisomerase I. Although perplexing at the time, moderate positive supercoiling caused the AT tract to become strongly reactive to osmium tetroxide, indicating the presence of bases exposed to solvent. Allemand et al. (Reference Allemand, Bensimon, Lavery and Croquette1998) generated positively supercoiled DNA by single-molecule manipulation and also probed this DNA for the presence of unpaired bases using glyoxal. Both positive and negative supercoiling induced structural alterations that resulted in increased reactivity to glyoxal; however, much higher levels of positive supercoiling were required to achieve the same reactivity. The presence of unpaired, solvent exposed bases in positively supercoiled DNA is consistent with the proposed and simulated inside-out conformation of P-DNA. Whereas the overwinding threshold in MD simulations (σ>0.33; Randall et al. Reference Randall, Zechiedrich and Pettitt2009) was greater than the threshold (σ>0.037) found in single molecule experiments (Allemand et al. Reference Allemand, Bensimon, Lavery and Croquette1998; Forth et al. Reference Forth, Deufel, Sheinin, Daniels, Sethna and Wang2008), the difference makes sense considering that 23–41 bp were used in simulation and ~50 000 bp were used in single molecule experiments. Estimates from single molecule experiments suggest that P-DNA has a σ~2 (Allemand et al. Reference Allemand, Bensimon, Lavery and Croquette1998; Léger et al. Reference Léger, Romano, Sarkar, Robert, Bourdieu, Chatenay and Marko1999; Marko, Reference Marko2007; Sarkar et al. Reference Sarkar, Léger, Chatenay and Marko2001); therefore, only a fraction of the helix needs to partition into P-DNA to accommodate the overwinding. For the σ=0.333 helix in the simulations of Randall et al. (Reference Randall, Zechiedrich and Pettitt2009), 4 bp converted to P-DNA, only ~17% of the helix, but enough to achieve σ~0.3. The absence of P-DNA below this threshold (σ>0.333) in the simulations may reflect the minimal DNA length (4 bp) able to form P-DNA.
The mechanism for the conversion from B-DNA to P-DNA began with the collapse of the minor groove, which permitted the bases to flip into the major groove and, thereby, allowed the backbones to wrap around each other (Randall et al. Reference Randall, Zechiedrich and Pettitt2009). With the excess twist absorbed in the P-DNA region, the remaining DNA was then relaxed back to B-DNA. Although only a limited number of the possible repertoire of sequence variations has yet been examined, base pair steps that are more easily mutable into a collapsed minor groove allow P-DNA transitions and rigid base pair steps help maintain B-DNA structure.
What are the biological implications of the various DNA conformations that have been observed in MD simulations? A long-standing question is how specific DNA sequences are found by DNA-binding proteins, or by homologous DNA molecules, within a sea of competitor DNA, given that the base sequence information is buried inside the helix. Sequence-dependent DNA distortion, non-B DNA conformations and base-flipping may contribute to sequence recognition. Pauling & Corey (Reference Pauling and Corey1953) recognized that the outward orientation of the bases in Pauling's proposed structure permitted the bases ‘to interact vigorously with other molecules’. Although there is as yet no definitive evidence of the presence of P-DNA under physiological conditions, it could potentially provide a means to modulate the binding of proteins and possible other DNA strands. Base flipping and denaturation caused by DNA underwinding also provide a way to display sequence information. The demonstration that base-flipping is a feature in methyltransferase binding to DNA (Fig. 8) (Klimasauskas et al. Reference Klimasauskas, Kumar, Roberts and Cheng1994; Reinisch et al. Reference Reinisch, Chen, Verdine and Lipscomb1995) led Roberts to postulate that base-flipping was an ‘ancient evolutionary discovery’ likely to be much more prevalent than previously thought (Roberts, Reference Roberts1995) and this must indeed be the case. Simulation studies reveal that base pairs located in rigid regions of sequence (Giudice et al. Reference Giudice, Varnai and Lavery2003; Lankas et al. Reference Lankas, Sponer, Langowski and Cheatham2003; Olson et al. Reference Olson, Gorin, Lu, Hock and Zhurkin1998) with mild stacking interactions (Santalucia et al. Reference Santalucia, Allawai and Seneviratne1996) are more likely to exhibit base-flipping and denaturation when subjected to torsional stress than those with strong stacking interactions. MD simulations revealed that base-flipping and denaturation are sequence-dependent (Randall et al. Reference Randall, Zechiedrich and Pettitt2009). Sequence-dependent base-flipping mediated by DNA underwinding may account for protein recognition of DNA sequence in some cases, just as underwinding-mediated DNA denaturation is likely to be important at sequences involved in initiation of transcription and replication.
Structure of HaeIII methyltransferase bound to a flipped base of DNA (Reinisch et al. Reference Reinisch, Chen, Verdine and Lipscomb1995; PDB ID: 1DCT.pdb). The DNA helix is rendered in spheres of blue except for the flipped out cytosine, which is rendered in green. The methyltransferase is rendered as a gold ribbon.

3.7. DNA electrostatics
Atomistic MD simulations have revealed that the familiar B-form is only one of many potential conformational states of the DNA double helix. When subjected to bending and supercoiling stress, DNA can form kinks, single-stranded regions, and writhed structures. The duplex can even be persuaded to turn inside-out to form P-DNA. An additional key piece of information provided by MD simulations is the concomitant redistribution of counterions surrounding a given DNA structure.
DNA is a highly charged polyelectrolyte. Every base pair has a net charge of −2 arising from the phosphate groups aligned along the surface of the backbone. This negative charge is screened by the surrounding solvent with positively charged counterions that are attracted to the negative charge density of DNA. The DNA helix depends on counterions to diminish the electrostatic repulsion between the backbone phosphate groups (Anderson & Bauer, Reference Anderson and Bauer1978; Marvin et al. Reference Marvin, Spencer, Wilkins and Hamilton1958; Rybenkov et al. Reference Rybenkov, Vologodskii and Cozzarelli1997b; Xu & Bremer, Reference Xu and Bremer1997). Theory predicts and simulations support that positively charged ions, attracted to the negative charge, condense on the DNA backbone in the major and minor grooves (Chapman, Reference Chapman1913; Feig & Pettitt, Reference Feig and Pettitt1988; Gouy, Reference Gouy1910; Makarov et al. Reference Makarov, Feig and Pettitt2002; Manning, Reference Manning1969a, Reference Manningb). The ions distribute to create a local gradient in the surrounding solvent that decreases with the distance from the DNA backbone. Multivalent cations are more effective than monovalent cations at screening the electrostatic forces because of their greater charge density (Pack et al. Reference Pack, Wong and Lamm1999). Hence, fewer multivalent than monovalent cations are required to achieve an equivalent level of screening. The screening effect of multivalent cations allows the close packing of DNA necessary to fit into cells (Bloomfield, Reference Bloomfield1996, Reference Bloomfield1997).
3.8. Counterions and overwound DNA
It has long been appreciated that the presence of counterions can influence the helical repeat of DNA (Xu & Bremer, Reference Xu and Bremer1997; reviewed in Bates & Maxwell, Reference Bates and Maxwell2005). What was not known was whether underwinding and/or overwinding DNA could influence local counterion concentration. Hints that this might be the case were revealed in simple atomic models (Randall et al. Reference Randall, Pettitt, Buck and Zechiedrich2006). In such models, when twist is uniformly distributed, the minor groove narrows with increasing DNA twist, which closes the distance between the phosphate groups and, hence, increases the charge density. Commonly the saline environment in such studies is approximated by the Poisson–Boltzmann equation (Chapman, Reference Chapman1913; Gouy, Reference Gouy1910):

where an electric field, φ, at position r (left side of the equation) is related to the dielectric constant of the solute and surrounding medium, ∊ (r), charge density ρ (r) and a Boltzmann-weighted distribution of point counterion species, s, of charge qs and concentration cs. Solutions to the Poisson–Boltzmann equation suggest that higher concentrations of counterions are attracted to this increased local charge density (Fig. 9).
Continuum theory is somewhat suspect when dealing with large fields and intimate molecular details. More reliable all-atom MD simulations in 500 mM NaCl showed that, up to the P-DNA threshold, overwinding DNA increased counterion condensation in the major and minor grooves (Randall et al. Reference Randall, Zechiedrich and Pettitt2009). For negatively supercoiled DNA, base-flipping and denaturation reduced, on average, the effect of underwinding on local counterion concentrations. Predictably, the counterion concentrations in the regions of the underwound helices that returned to B-DNA were similar to those of the relaxed (σ=0.0) helix. There was tremendous local variance in counterion concentrations in areas where the DNA structure failed, and examples of this for underwound and overwound DNA are shown in Figs 4 and 6, respectively. In regions of P-DNA structure, in the overwound helices, counterions were interspersed with the flipped out bases and highly concentrated near the intertwined backbones (Fig. 6).
Poisson–Boltzmann predictions of the effect of DNA twist on counterion concentrations. According to the calculations, the charge density of the helix decreases with decreasing twist thereby reducing the counterion condensation. These calculations assumed an ionic strength of 150 mM. Lk is calculated assuming the helix is a fragment of a 339 bp minicircle.

3.9. Counterions and DNA–DNA juxtapositions
The potential of overwound DNA to attract higher concentrations of counterions in the major and minor grooves may at least partially explain its greater propensity to writhe compared to underwound DNA (Fogg, J.M, Catanese, D. J. and Zechidrich, L., manuscript in preparation). As discussed above, writhe is favorable only when the intrinsic electrostatic repulsion between two helical segments is shielded by counterions in the intervening solvent. The relationship between the bulk concentrations of cations and the interconversion between twist and writhe, as measured by the number of crossovers in supercoiled plasmids, has been observed by electron cryomicroscopy, atomic force microscopy, and implicit solvent MD simulation (Bednar et al. Reference Bednar, Furrer, Stasiak, Dubochet, Egelman and Bates1994; Boles et al. Reference Boles, White and Cozzarelli1990; Cherny & Jovin, Reference Cherny and Jovin2001; Harris et al. Reference Harris, Laughton and Liverpool2008). These studies all agree that writhe is minimal in low salt and increases with increasing salt. The implication is that the self-repulsion of the negatively charged DNA backbone is screened sufficiently in solutions of ionic strength comparable to the conditions found inside a cell.
Although contemplating models for type II topoisomerase action, Buck and Zechiedrich (Reference Buck and Zechiedrich2004) found that arranging bent charged rods in hooked juxtapositions created an attractive force. Such a force could stabilize DNA–DNA juxtapositions, reducing protein binding of DNA juxtapositions from a three-body problem to a two-body problem. However, the conjecture regarding the attractive potential of helix–helix juxtapositions did not consider the ionic shielding of the cations. To explore the effects of shielding, the Poisson–Boltzmann equation was solved for all-atom models of DNA juxtapositions with varying curvatures (Randall et al. Reference Randall, Pettitt, Buck and Zechiedrich2006). The solutions showed a strong, negatively charged electric field between the juxtaposed helices, and that a concentration of counterions in this electric field screened the electrostatic interaction between the helices (Fig. 10). For instance, a minimum bulk concentration of monovalent cations of only 50 mM is required to screen two DNA helices separated by 1 nm, and the concentration of counterions attracted to the electric field in the interhelical region can be as high as 1 M. Thus, any change in the electrostatic interaction between the helices arising from their curvature in a smooth bending regime is nullified by monovalent cation concentrations lower than those estimated to be physiological. Divalent or polyvalent cations screen more effectively at even lower concentrations (much lower than are found in physiological conditions). These studies revealed a previously underappreciated diversity and non-uniformity of counterion charge distribution surrounding DNA and how DNA juxtapositions could affect counterions concentrations locally.
Poisson–Boltzmann predictions of counterion concentrations in the vicinity of juxtaposed 12 bp helices (Randall et al. Reference Randall, Pettitt, Buck and Zechiedrich2006). The DNA helices are rendered in gray and oriented so that the viewer is looking down the axis of the helix on the right. Isosurfaces of the counterion concentrations are colored red (2 M), orange (1 M), yellow (0.5 M), and green (0.25 M). High concentrations of counterions ‘neck’ in the interhelical region as demonstrated by the orange region between the two helices. Reprinted from Randall et al. (Reference Randall, Pettitt, Buck and Zechiedrich2006) with permission.

The balance between repulsion and attraction of DNA helices, modulated by ions, suggests a mechanism by which electrostatic interactions exert control over DNA topology. Indeed, the cellular distribution of ions fluctuates during the cell cycle (Strick et al. Reference Strick, Strissel, Gavrilov and Levi-Setti2001). During mitosis the chromosomes become condensed, switching from loosely packed chromatin into a higher-order chromosome structure, requiring a sufficient concentration of cations to overcome the electrostatic self-repulsion of DNA. This is concomitant with an increase in the nuclear concentration of Ca2+ and Mg2+ ions, stabilizing chromosome structure (Strick et al. Reference Strick, Strissel, Gavrilov and Levi-Setti2001). At other stages in the cell cycle, DNA is decondensed, and we propose that decondensation may be, at least partially, achieved by reduction of the local screening which would allow the natural electrostatic repulsion of DNA to help separation of DNA strands. Indeed, when cells are depleted of Ca2+ and Mg2+ ions, the chromosomes are partially decondensed (Strick et al. Reference Strick, Strissel, Gavrilov and Levi-Setti2001).
3.10. Interaction between homologous duplex DNAs
Above we discussed how torsional stress-induced structural distortion in DNA and the counterion alteration that accompanies it is dependent upon DNA sequence, how DNA sequence affects the distribution of counterions, and how the distribution of counterions affects interactions between DNA duplexes. Electrostatic interactions have also recently been found to play an important role in the association of homologous duplex DNAs (Baldwin et al. Reference Baldwin, Brooks, Robson, Wynveen, Goldar, Leikin, Seddon and Kornyshev2008; Kornyshev & Wynveen, Reference Kornyshev and Wynveen2009; Wynveen et al. Reference Wynveen, Lee, Kornyshev and Leikin2008, and reviewed by Falaschi, Reference Falaschi2008). Calculating the energetic effects of DNA helices sliding along each other, Kornyshev uncovered a surprising attractive electrostatic force between homologous duplex DNAs in the absence of proteins. The attraction was speculated to be a result of in-register alignment of negatively charged phosphates on one helix with grooves on the other helix to minimize repulsion between phosphates and to maximize the favorable attractive force between phosphates and counterions bound in the grooves. Early experiments detected a modest but significant attraction between 294 bp linear DNA fragments with homologous sequences (Baldwin et al. Reference Baldwin, Brooks, Robson, Wynveen, Goldar, Leikin, Seddon and Kornyshev2008). These data may have implications for DNA transactions that involve homologous duplex DNA, including homologous recombination, chromosome pairing during mitosis and meiosis, and site-specific recombination. Because DNA bending, writhing, and twisting should affect electrostatic correlations between duplexes, it would be expected that supercoiling should affect these interactions and indeed this was the case (Wang et al. Reference Wang, Zhang, Mao and Seeman2010). When two homologous segments were placed in inverted orientation across each other on the same supercoiled plasmid, a dramatic conformational change in the plasmid occurred at a critical superhelical density (σ~−0.05) that resulted in dumbbell-shaped molecules. Increased interwrapping of the homologous sequences occurred concomitantly with relaxation supercoiling in the apical regions. The interwrapped structure was proposed to be paranemic crossover (PX) DNA, a four-stranded DNA molecule (Wang et al. Reference Wang, Zhang, Mao and Seeman2010). Supercoiling appears to bring homologous sequences together, thus facilitating processes that employ homology recognition, presumably by promoting interwrapping, but denaturation and counterion upheaval may also play a role. Whereas supercoiling-promoted homology attraction has been demonstrated for homologous sequences on the same supercoiled plasmid, it is yet to be determined the extent to which supercoiling can drive homology recognition between sequences on two separate DNA molecules.
3.11. Protein recognition of DNA topology
Knotted, catenated, and writhed manifestations of DNA topology increase the likelihood of juxtaposition of non-adjacent sequences (Bao et al. Reference Bao, Lee and Quake2003; Buck & Zechiedrich, Reference Buck and Zechiedrich2004; Liu et al. Reference Liu, Mann, Zechiedrich and Chan2006a, Reference Liu, Zechiedrich and Chanb; Vologodskii, Reference Vologodskii2006; Vologodskii et al. Reference Vologodskii, Levene, Klenin, Frank-Kamenetskii and Cozzarelli1992). Many enzymes, including topoisomerases, site-specific recombinases, integrases, and transposases, act on at least two juxtaposed DNA helices (Guo et al. Reference Guo, Gopaul and Van Duyne1997; Lu & Churchward, Reference Lu and Churchward1994; Madden et al. Reference Madden, Stewart and Champoux1995; Patel et al. Reference Patel, Yakovleva, Shuman and Mondragón2010; Yang, Reference Yang2010; Zechiedrich & Osheroff, Reference Zechiedrich and Osheroff1990, Reference Zechiedrich and Osheroff2010). We focus here on the topoisomerases, in particular type II topoisomerases, because recognition of DNA topology is such an integral part of the mechanism of these enzymes. Topoisomerases perform an essential role, and therefore must be very efficient, and the consequences of acting at the wrong place or wrong time could also be disastrous. The enzymes must, therefore, have an efficient mechanism to recognize DNA knots, catenanes, and supercoiled DNA.
Type II topoisomerase do not appear to indiscriminately catalyze DNA strand passage at all juxtaposed helices; if that were the case, then equilibrium levels of knots and catenanes would remain unchanged with topoisomerase addition (Burnier et al. Reference Burnier, Weber, Flammini and Stasiak2007; Darcy et al. Reference Darcy, Scharein and Stasiak2008; Vologodskii et al. Reference Vologodskii, Zhang, Rybenkov, Podtelezhnikov, Subramanian, Griffith and Cozzarelli2001). Instead, type IIA topoisomerases reduce concentrations of knots and catenanes 16–90 times below equilibrium levels expected for relaxed DNA (Rybenkov et al. Reference Rybenkov, Ullsperger, Vologodskii and Cozzarelli1997a). All type II topoisomerases use the free energy of ATP hydrolysis to drive the reaction, therefore topology simplification does not contradict thermodynamic laws (Bates & Maxwell, Reference Bates and Maxwell2007). Several models have been proposed to explain how type IIA topoisomerases shift this equilibrium (reviewed in Bates & Maxwell, Reference Bates and Maxwell2007; Fogg et al. Reference Fogg, Catanese, Randall, Swick, Zechiedrich, Benham, Harvey, Olson, Sumners and Swigon2009; Liu et al. Reference Liu, Deibler, Chan and Zechiedrich2009; Schoeffler & Berger, Reference Schoeffler and Berger2008).
It should be noted that the physiological significance of topology simplification has been brought into question in recent years. The free energy input required is very low, much less than that provided by ATP hydrolysis (Stuchinskaya et al. Reference Stuchinskaya, Mitchenall, Schoeffler, Corbett, Berger, Bates and Maxwell2009). Additionally, the type IIB topoisomerases only relax knots and catenanes to equilibrium (Corbett et al. Reference Corbett, Benedetti and Berger2007), suggesting that topology simplification, for these enzymes at least, is not an essential role (Stuchinskaya et al. Reference Stuchinskaya, Mitchenall, Schoeffler, Corbett, Berger, Bates and Maxwell2009). The true ancestral role of ATP hydrolysis is probably not driving reactions beyond equilibrium, but may instead be to allow controlled, sequential, separation of protein–protein interfaces during strand passage (Bates et al. Reference Bates, Berger and Maxwell2011). The requirement for an energy input allows protein–protein interfaces in the enzyme to be very strong, preventing unregulated dissociation, thereby providing a safeguard against accidental cytotoxic double strand breaks (Bates et al. Reference Bates, Berger and Maxwell2011). The question of how topoisomerases carry out their essential physiological role remains a fundamental one, regardless of the significance of topology simplification.
Most of the proposed models (of how topoisomerases recognize DNA topology) assume that a global property such as DNA topology could not affect local properties that might be recognized by enzymes. Buck & Zechiedrich (Reference Buck and Zechiedrich2004) pointed out multiple different local parameters at a juxtaposition that can yield information regarding the global topological state of the DNA. These parameters include the angle between the DNA helices and the degree of curvature at the point of juxtaposition. Thorough single molecule manipulation experiments (Neuman et al. Reference Neuman, Charvin, Bensimon and Croquette2009) revealed that type II topoisomerases bind to and promote passage on DNA juxtaposed in a nearly perpendicular orientation. Buck and Zechiedrich argued, and subsequent analysis has agreed (Liu et al. Reference Liu, Mann, Zechiedrich and Chan2006a, Reference Liu, Zechiedrich and Chanb, Reference Liu, Deibler, Chan and Zechiedrich2009, Reference Liu, Zechiedrich and Chan2010a, Reference Liu, Zechiedrich and Chanb), that two juxtaposed helices are more likely to be curved toward each other when two DNA strands are linked. Such ‘hooked’ juxtapositions are contrasted with ‘free’ juxtapositions, where the unlinked DNA helices curve away from each other. Monte Carlo sampling of coarse-grained lattice models of strand passages at hooked juxtapositions found the probability of unlinking catenated loops (n=200) was 85% compared to a 13% probability of linking uncatenated loops (Liu et al. Reference Liu, Zechiedrich and Chan2006b). The probability of linking uncatenated loops at free juxtapositions was 90%. Hence, strand passage at hooked juxtapositions shows a strong statistical bias toward unlinking catenanes and knots (Liu et al. Reference Liu, Mann, Zechiedrich and Chan2006a, Reference Liu, Zechiedrich and Chanb). In addition, the action of polymerases and helicases on DNA (Johnson et al. Reference Johnson, Bai, Smith, Patel and Wang2007; Revyakin et al. Reference Revyakin, Liu, Ebright and Strick2006) may bring DNAs into close proximity and these are likely to be hooked. Mechanical forces, such as those occurring during chromosome separation during cell division, should also strongly affect the probability of two helices juxtaposing.
The observation that type IB topoisomerases preferentially bind to helix–helix juxtapositions is somewhat perplexing because the proposed mechanism of relaxation by these enzymes does not require a second helix (Zechiedrich & Osheroff, Reference Zechiedrich and Osheroff1990, Reference Zechiedrich and Osheroff2010 and references therein). The role of this preferential binding was addressed by a recent structure of D. radiodurans topoisomerase I bound to DNA (Patel et al. Reference Patel, Yakovleva, Shuman and Mondragón2010). Unlike previous structures, the DNA in the complex was bound to a secondary site on the enzyme, away from the active site, indicating that the enzyme is able to interact with two helices. Although binding of the second helix was found to be unnecessary for activity of the enzyme, it may play role in stabilizing synapse formation and promoting plectonemic binding (Patel et al. Reference Patel, Yakovleva, Shuman and Mondragón2010; Zechiedrich & Osheroff, Reference Zechiedrich and Osheroff2010).
Two partial crystal structures of type II topoisomerases, the ParC dimer of E. coli topoisomerase IV and the DNA-binding and cleavage core of Saccharomyces cerevisiae topoisomerase II bound to a double-nicked short duplex DNA, support the notion that the DNA is bent in the complex (Corbett et al. Reference Corbett, Schoeffler, Thomsen and Berger2005; Dong & Berger, Reference Dong and Berger2007). In the former, only DNA with a marked bend can be modeled into the atomic structure of the enzyme; in the latter, double-nicked DNA is strongly bent in the co-crystal. Recent single molecule manipulations and atomic force microscopy experiments with E. coli topoisomerase IV, yeast topoisomerase II, and human topoisomerase IIα also provide evidence of strong bending of the gate segment but that this alone cannot account for topology simplification (Hardin et al. Reference Hardin, Sarkar, Seol, Liou, Osheroff and Neuman2011). Therefore, DNA curvature appears to be involved in type II topoisomerase interaction with DNA. It is important to note that there are no crystal structures of type II topoisomerases containing two helices, therefore the extent of curvature in the second helix remains to be determined.
4. Conclusions and future perspectives
In this review, we have focused on how DNA may control its own metabolism through torsional stress, topology, geometry, and the concomitant alterations in the location and density of counterions. We reviewed the simulations of structural deformations that occur in bent and torsionally stressed DNA. We also considered how DNA topology may be revealed to enzymes through the angle and curvature of DNA–DNA juxtapositions. Structural deformations, including kinks, base-flipping, denaturation, and perhaps even P-DNA, may occur naturally as consequences of DNA metabolism. The influence of these structural deformations in the cellular milieu is likely coupled to the effect of the deformations on counterion concentrations. All of these structural deformations, and their concomitant effects on counterion concentrations, must therefore be understood before we can fully understand DNA metabolism.
We propose that DNA supercoiling-mediated denaturation, base-flipping, and P-DNA formation are coupled to modulations of counterion concentrations to provide an exquisitely sensitive mechanism for proteins or other DNA strands to recognize preferred sequences. Instead of merely a passive polymer pushed around by proteins, DNA may interact with other DNAs and proteins to regulate its own metabolism. Transient waves of torsional stress cause transient waves of strain and resulting structural changes. DNA may then recruit proteins, such as single-strand binding proteins, to stabilize what would otherwise be only transient DNA structures. All of these, of course, depend upon the relevant proteins being expressed, which can depend upon regulation of gene expression by the underwinding and overwinding of DNA (Khodursky et al. Reference Khodursky, Peter, Schmid, Derisi, Botstein, Brown and Cozzarelli2000; Lilley & Higgins, Reference Lilley and Higgins1991; Peter et al. Reference Peter, Arsuaga, Breier, Khodursky, Brown and Cozzarelli2004; Schneider et al. Reference Schneider, Travers and Muskhelishvili2000).
4.1. Future perspectives
Moving beyond elastic rod mesoscale models finally permits studies that delve into the role of sequence in the stability of the helical structure under bending and torsional stress. Simulations of underwound and overwound DNA have shown that some base pair steps are more rigid than others, leading to higher likelihoods of denaturation and base-flipping. This finding agrees with the base pair rigidity measurements in the PDB DNA structures (Lankas et al. Reference Lankas, Sponer, Langowski and Cheatham2003; Olson et al. Reference Olson, Gorin, Lu, Hock and Zhurkin1998). We can extrapolate that each possible sequence has a unique tolerance for bending and torsional stress. How biologically relevant sequences, such as the TATA box, oriC, FUSE, etc., respond to these stresses could reveal new mechanisms for sequence-specific protein–DNA binding, specifically an enhanced role for DNA relative to that of proteins. By combining atomistic simulation with biochemical studies, we have obtained an atomically detailed view of the structural changes that occur due to supercoiling, and have seen that DNA has a particularly rich repertoire of alternative structures that it can access in response to an applied stress. As yet, the connection between the atomically detailed picture provided by simulation and the biological role of supercoiling and topology as ‘a global regulator of the complement of genes in the cell’ is not understood. We predict that as further research establishes how intimately DNA is involved in its own regulation, our view of the double helix will be transformed from being simply a medium for ‘information storage’ to a more interactive role.
4.2. Unresolved problems
The concept of DNA being an active participant in its own interactions is only recently beginning to gain widespread acceptance. The most convincing support for this hypothesis currently comes from high-resolution simulation data. The most detailed descriptions of DNA dynamics only recently became possible because of the rapid advances in computing power. Consequently there remains significant experimental research to be done to validate these results. The potential implications of DNA being involved in its own metabolism have also not yet been fully realized and with this review we hope to stimulate further investigations into this phenomenon. To facilitate this, a number of potential topics for further exploration are discussed below.
4.3. Toward better prediction of protein–DNA interactions in vivo
Analyses of protein–DNA complexes have shown that DNA recognition is exquisitely sensitive to the local shape and flexibility of the DNA, which is in turn a non-trivial function of the underlying sequence. In studies of protein–DNA recognition where the DNA has been the central focus, analysis of the known protein–DNA structures has shown that the shape and flexibility of the DNA at the base-pair level is important in DNA recognition. DNA genome sequence data are being acquired at a phenomenal rate but interpreting the vast amount of data is proving to be a difficult challenge. Elliott Margulies and co-workers used hydroxyl radical cleavage patterns, measured at the base-pair level, to probe structural variations as a function of sequence (Parker et al. Reference Parker, Hansen, Abaan, Tullius and Margulies2009). The authors determined that these local structural variations are highly evolutionary constrained, and were a much better predictor of functional, non-coding elements (e.g. enhancers) than the nucleotide sequence alone. These data suggest that the shape of the DNA may help in protein–DNA recognition and these may provide a marker for proteins to find functional elements in the genome. DNA supercoiling produces even greater variations in DNA structure as we explain and again, this is a non-trivial function of sequence.
In recent years, researchers in the field of systems biology have sought to understand complex interactions in the context of biological systems rather than studying individual isolated components. Although a noble and worthy undertaking, this has been fraught with difficulty, in particular quantifying these interactions. Protein–DNA interactions have proven particularly difficult. Ingenious high-throughput technologies such as microfluidic systems have been developed to help address these shortfalls (Maerkl & Quake, Reference Maerkl and Quake2007). Although this type of method has great promise, it only correctly predicts a small subset of protein–DNA interactions. We assert that more accurate predictions of biological function will only be achieved by using supercoiled DNA substrates instead of the short linear duplexes used. It would also be useful to determine what binds as a function of supercoiling. At present there is no easy way to assay the supercoiling dependence of protein binding because most supercoiled substrates (e.g. plasmids) are not suitable for quantitative biophysical assays. Some proteins have relatively low affinity for relaxed B-form DNA and therefore, will not be detected in conventional screens. Screening for protein–DNA interactions using a supercoiled substrate should identify previously unknown interactions.
4.4. Therapeutic potential for targeting small molecules
Supercoiling-dependent DNA conformations are potential targets for therapeutic small molecules. For example, a number of small molecules that bind to and stabilize G-quadruplexes have been identified. Transcriptional repression through stabilization of these structures in the promoters of oncogenes holds promise as an anti-cancer therapy (Balasubramanian et al. Reference Balasubramanian, Hurley and Neidle2011).
In addition, a better understanding of the structure of supercoiled DNA should better inform understanding of drug–DNA interactions in the cell. Understanding the effect of supercoiling on the efficacy of the drugs should facilitate the development of DNA targeting drugs with greater efficacy and specificity.
4.5. Positive supercoiling
We discussed the importance and properties of positively supercoiled DNA in a previous review (Fogg et al. Reference Fogg, Catanese, Randall, Swick, Zechiedrich, Benham, Harvey, Olson, Sumners and Swigon2009). Many enzymes preferentially recognize positively supercoiled DNA. How they do so is still under debate. Recent atomistic MD simulations continue to reveal differences between positively and negatively supercoiled DNA (Randall et al. Reference Randall, Zechiedrich and Pettitt2009). For many years, little was known about the structure of positively supercoiled DNA because of the difficulty in isolating overwound DNA substrates. Positively supercoiled DNA is more stable and less easily denatured than negatively supercoiled DNA and should remain B-form at moderate superhelical densities. Most non-canonical DNA structures that are known are associated with negatively supercoiled DNA. P-DNA is a very unusual conformation that is associated with positive supercoiling but the biological significance of P-DNA is still unknown.
4.6. A high-resolution structure of supercoiled DNA?
X-ray crystallography has proved invaluable and irreplaceable as a tool for determining protein structures. Although many DNA structures have been solved, these are all of relaxed linear DNA and, therefore the fine details of supercoiled DNA structure are still unknown. The highly dynamic nature and considerable free energy of a supercoiled DNA molecule may make it impossible to crystallize a free supercoiled DNA molecule. A more realistic goal would be to determine the structure of a protein bound to a supercoiled DNA molecule. This would provide an unparalleled insight into the structure of supercoiled DNA and also reveal to what extent DNA is able to shove the protein around.
Acknowledgements
We thank Dr Richard W. Deibler, Dr Mary-Jane Lombardo, Dr Michael F. Schmid, Dr Daniel J. Catanese Jr. and Erol Bakkalbasi for helpful comments and critical review. G. L. R. was initially supported by a training fellowship from the Keck Center for Interdisciplinary Bioscience Training of the Gulf Coast Consortia (NLM Grant No. 5T15LM07093). The Robert A. Welch Foundation (E-1028) and the National Institutes of Health (R01 GM066813) partially supported G. L. R. and B. M. P. Support for J. M. F. and L. Z. was from NIH (R01 AI054830). S. A. H. was supported by the UK Engineering and Physics Science Research Council.