Alcohol use disorder among adolescents and young adults has become an increasingly serious public health issue. Among individuals aged 15–39 years, the occurrence of injuries accounted for most alcohol-related disability-adjusted life years in 2020. Current recommendations on alcohol consumption vary by age and geographic location. The National Institute of Alcoholism and Alcoholism (NIAA) defines moderate alcohol consumption as no more than 56 g (four drinks) on any single day. Despite variations among countries, this is the most widely accepted standard(1,Reference Chiva-Blanch, Arranz and Lamuela-Raventos2) . However, in recent decades, the definition of moderate alcohol consumption has evolved, trending towards lower levels of intake, which complicates the comparison of clinical trials.
Over the past decades, studies about the effects of alcohol on health have yielded inconclusive results(Reference Burton and Sheron3). Some studies have indicated that the daily consumption of certain alcoholic beverages may have beneficial effects on our health(Reference Ronksley, Brien and Turner4,Reference McElduff and Dobson5) . However, small health benefits associated with moderate alcohol consumption are outweighed by an increase in other health risks(Reference Stockwell, Zhao and Panwar6). A recent study based on global reports regarding alcohol-related health effects indicated that the safest level of drinking is total abstinence(7).
There is ongoing controversy regarding the potential impact of alcohol on blood flow and vasculature. After red wine consumption, cerebral blood flow (CBF) and endothelium-dependent vasodilatation rapidly increase, although some findings suggest regional and individual variability(Reference Strang, Claus and Ramchandani8–Reference Tolentino, Wierenga and Hall10). The acute effects of red wine consumption on the retinal microvasculature and blood flow are poorly understood(Reference Luksch, Resch and Weigert11–Reference Dhasmana, Herbert and Patel13). A recent study demonstrated a deterioration in visual function after drinking alcohol, but the underlying mechanism remains unclear(Reference Casares-López, Castro-Torres and Martino14). Polyphenols, the principal biologically active components in red wine, have been reported to have potent antioxidant and anti-inflammatory properties. Oxidative stress and inflammation play a critical role in the initiation and progression of age-related ocular diseases that lead to progressive loss of vision and blindness(Reference Cornebise, Perus and Hermetet15). Moreover, it is reported that polyphenols elicit dilation of isolated mammalian retinal arterioles through the role of nitric oxide (NO) and potassium channels(Reference Nagaoka, Hein and Yoshida16,Reference Vanden Daele, Boydens and Pauwels17) . A high correlation was found between changes in retinal microvasculature and ophthalmic diseases that increasingly affect younger age groups, such as hypertensive and diabetic retinopathy(Reference Newman, Andrew and Casson18,Reference Kwa19) . Therefore, it is important to evaluate the effects of red wine on retinal microvasculature and blood flow under normal physiological or specific pathological conditions.
Acute effects of a daily dose of red wine may cause deterioration of visual function, and further exploration of its possible mechanisms can supplement public dietary habit on alcohol consumption recommendations. The present study investigated whether moderate amounts of red wine consumption acute changed visual function and affect retinal and choroid blood flow in healthy young adults. Animal experiments were then further performed to study the short-term acute effects of red wine administration on the morphology and blood flow of the retinal microvasculature, and possible mechanisms were explored though both in vivo and in vitro experiments.
Methods
Healthy young adults’ studies
Participants
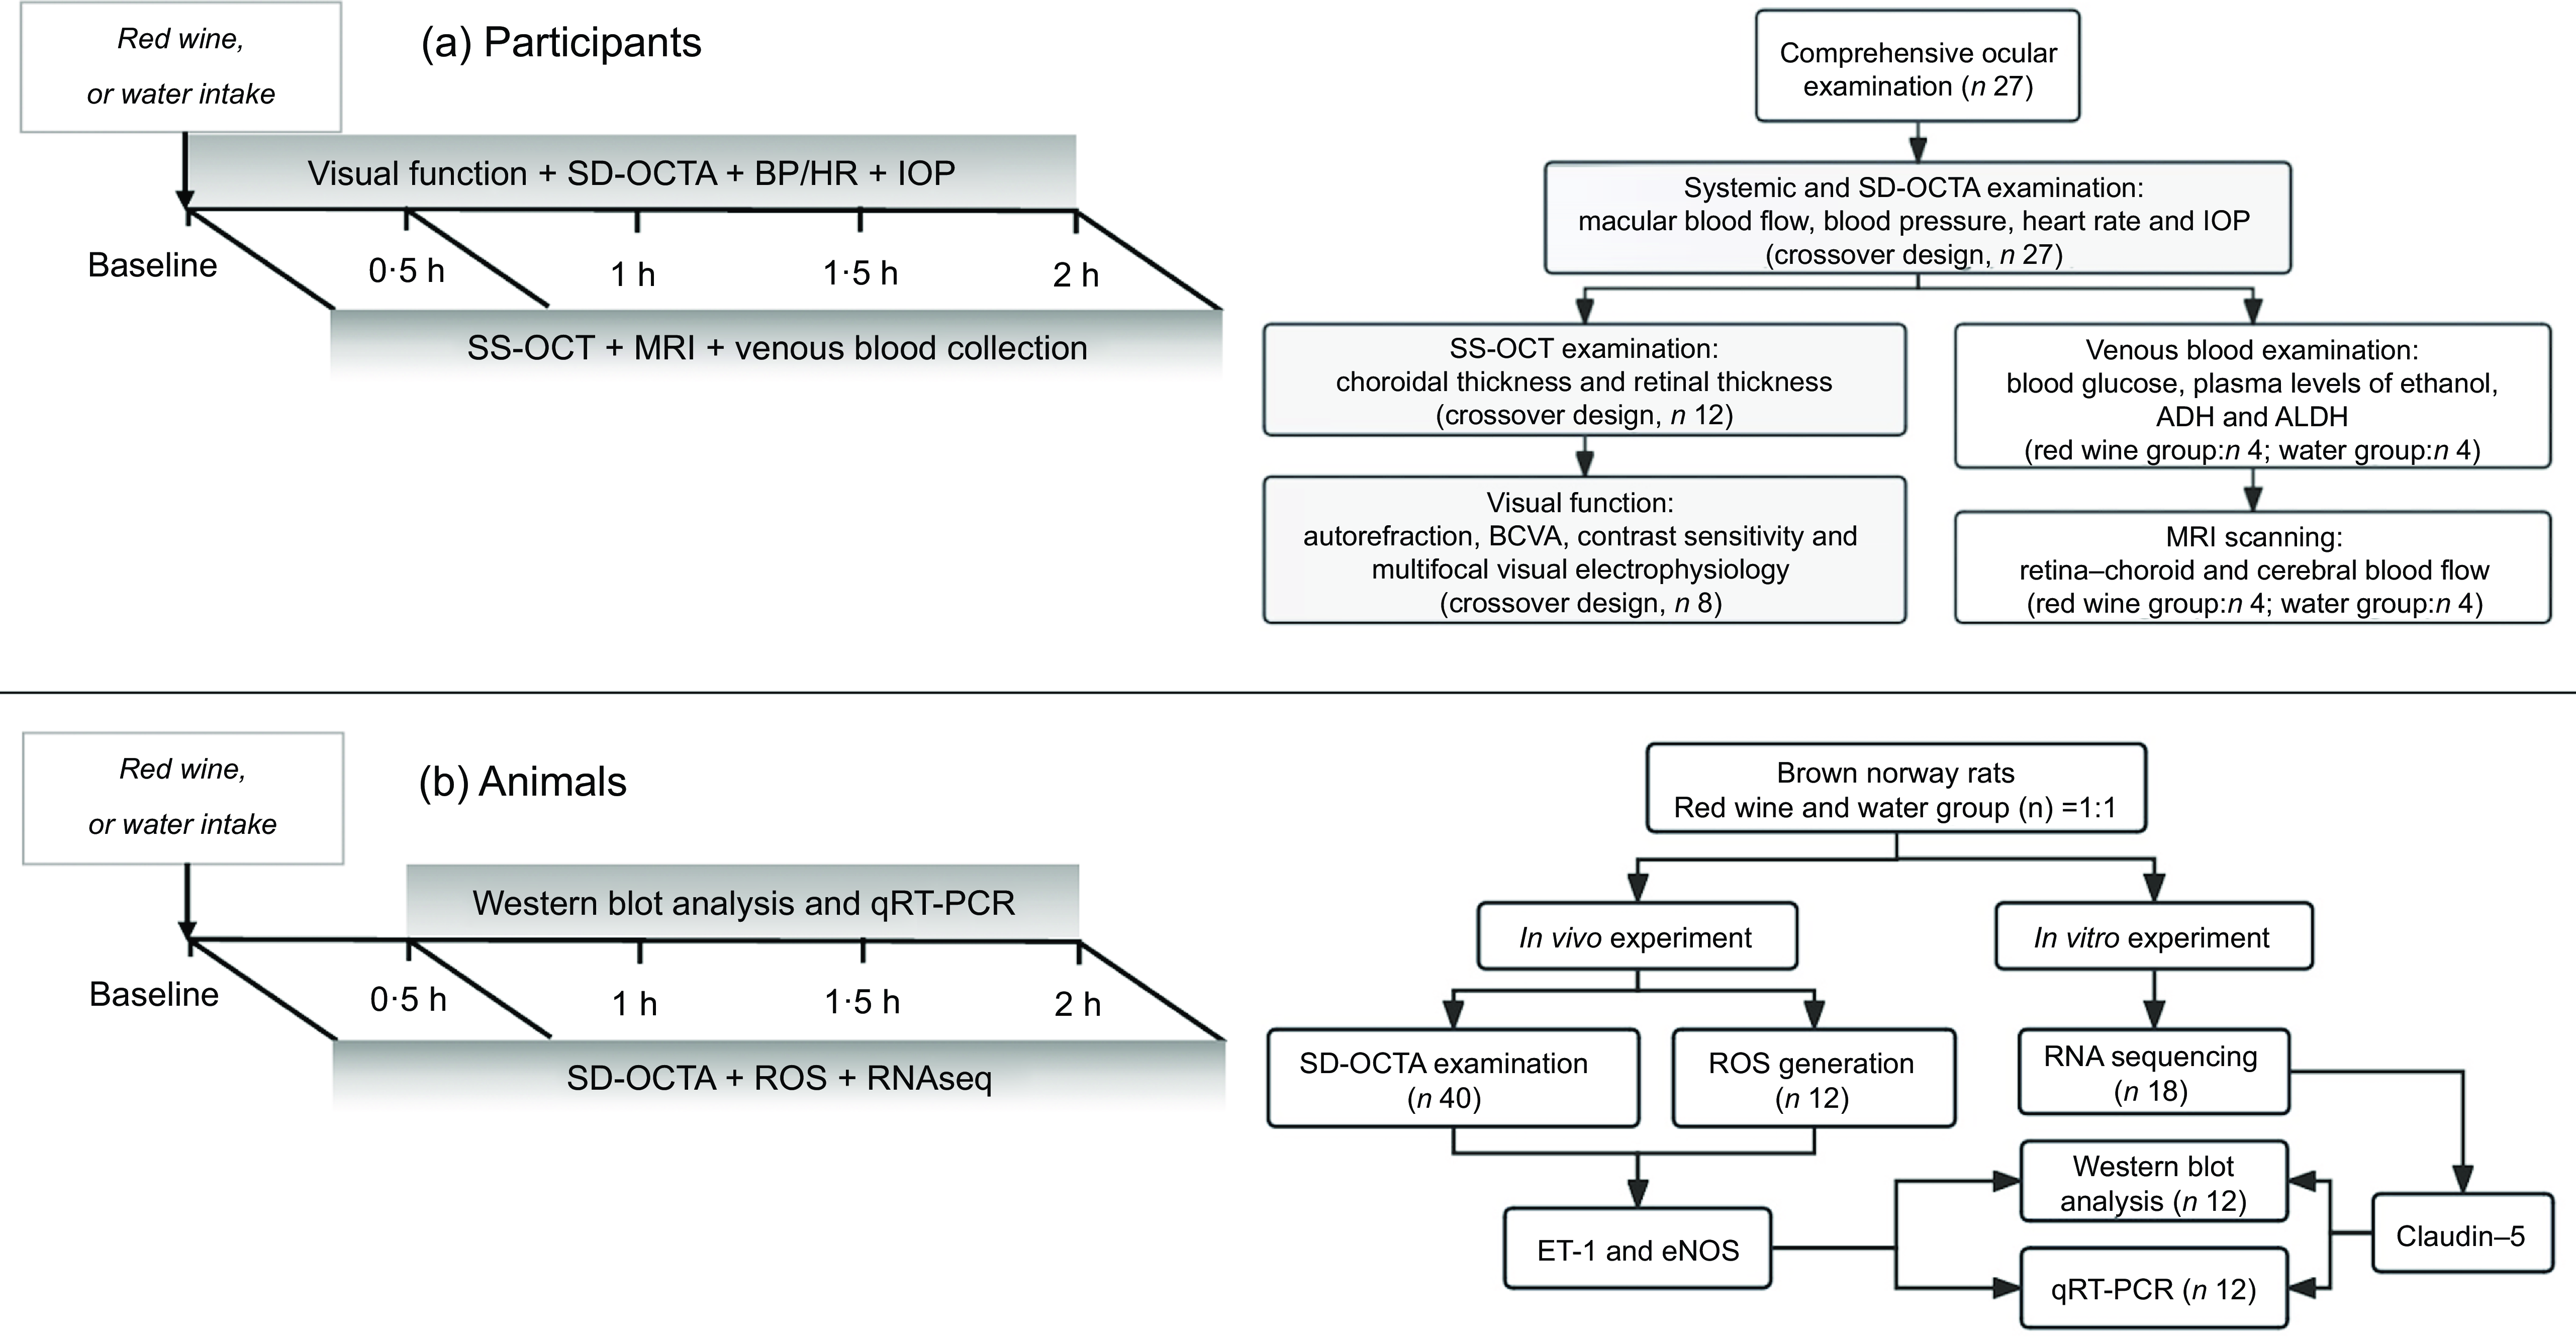
This was a randomised self-controlled study. Participants were randomised to drink either red wine or water first but each served as their own control (crossover design). University students were recruited through public advertisements in the Shanghai Eye Disease Prevention and Treatment Center from March to June 2019. Healthy young adults who were non-smokers (never smoked), non-drinkers (never/almost never drink) and not heavy coffee drinkers (< 2·5 cups/d, coffee consumption correlates with retinal microvessel diameter)(Reference Mozaffarian, Marfisi and Levantesi20–Reference Zhu, Zhu and Wang22), with no history of ocular, systemic (including liver disease) or neurological disease and without refractive errors (spherical equivalent degree ≤ –3 dioptres) were recruited. In addition, female participants during menstruation were excluded. Figure 1(a) illustrates the recruitment and randomisation of participants in a flow diagram.
Overview of the experimental protocols for healthy young adults and animal studies. Visual function: examinations included autorefraction, BCVA, contrast sensitivity and multifocal visual electrophysiology measurements; MRI: blood flow measurement including retinal–choroidal and cerebral blood flow based on MRI. SD-OCTA, spectral-domain optical coherence tomography angiography; SS-OCT, swept-source optical coherence tomography; BCVA, best corrected visual acuity; BP/HR, blood pressure and heart rate measurements; IOP, intraocular pressure measurement; ADH, alcohol dehydrogenase; ALDH, aldehyde dehydrogenase; ROS, reactive oxygen species; ET-1, endothelin-1; eNOS, endothelial nitric oxide synthase; qRT-PCR, quantitative real-time PCR.

Participants were asked to not eat or drink any caffeinated or alcoholic products and to avoid strenuous exercise for at least 24 h and sleep for more than 8 h the night before the experiments.
Our study was approved by the Institutional Review Board of Shanghai General Hospital (no. 2017(88)) and adhered to the tenets of the Declaration of Helsinki. Written informed consent was obtained from each participant before enrolment. The study was registered on clinicaltrials.gov (NCT03416088).
Protocols
Participants visited the study centre on two mornings with at least one week apart. Participants ate the same low-energy meal, followed by no eating for 2 h before the baseline examination. Based on previous research, considering safety, effectiveness and ethical aspects, we chose two drinks of red wine (moderate dose (21–50 g/d ethanol)) as the trial dose for our preliminary exploration study(Reference Holmes, Dale and Zuccolo23–Reference Catena, Novello and Dotto25). Participants were randomised to drink 300 ml (37·5 g of ethanol) of either red wine (dyed wine, 12·5 % vol, Comte Rossi De Prieuac) or water, generated by a random number table according to the time the participants admitted to study centre. The experimental procedures are shown in Figure 1(a).
All participants underwent systematic and ocular examination before the experiments. Twenty-seven college students were enrolled, including fifteen females and twelve males, with an average age of 22·7 (sd 3·1) years, weight of 60·4 (sd 15·0) kg, height of 165·2 (sd 6·9) cm and BMI of 22·0 (sd 4·5) kg/m2. All participants had the best corrected visual acuity (BCVA) in their worse eye above 20/20, an se of −1·1 D (sd 1·5), axial length of 23·9 (sd 1·0) mm and intraocular pressure (IOP) of 14·6 (sd 2·7) mmHg.
During the research process, only data collection and analysis personnel were blinded.
All twenty-seven participants had their blood pressure (BP), heart rate and IOP measured and spectral-domain optical coherence tomography angiography (SD-OCTA) performed at baseline and 0·5 h and 2 h after red wine or water consumption. Swept-source optical coherence tomography (SS-OCT) was performed in twelve of the participants at the three time points above. Then, eight of these twelve participants underwent autorefraction (KR-8900; Topcon), BCVA (Early Treatment Diabetic Retinopathy Study (ETDRS) chart), multifocal visual electrophysiology (mfERG) (RETI port/scan 21; ROLAND)(Reference Harrison, Osmotherly and Biancardi26) and contrast sensitivity (Takaci-CGT-1000; Seiko)(Reference Hayashi, Hayashi and Nakao27) to assess visual function at baseline and 2 h after red wine or water consumption.
Another eight of all twenty-seven enrolled participants were randomly assigned to either the red wine or the water group (four participants in each group) for MRI scanning at three time points. Before each MRI scan, venous blood samples were collected to determine glucose and ethanol concentrations by GC. The activity of enzymes related to ethanol metabolism, including alcohol dehydrogenase (ADH) (MAK053, Sigma-Aldrich) and aldehyde dehydrogenase (ALDH) (CSB-E11854h, Cusabio), was measured using colorimetric tests and ELISA, respectively.
Equipment
SS-OCT (DRI-OCT-1 Atlantis, Topcon) was used to measure the retinal and choroidal thickness, according to previously described procedures(Reference Jin, Zou and Zhu28). Once the tomography was obtained, the ETDRS grid was used to divide into the central foveal circle (1 mm in diameter), the parafoveal circle (3 mm in diameter) and the perifoveal circle (6 mm in diameter). The average retinal and choroidal thickness for each subfield was calculated using the built-in software. Image acquisition was repeated three times, excluding any images with a signal strength below 60.
Images of SD-OCTA (Cirrus, Carl Zeiss Meditec) were obtained according to previous described procedures(Reference Kim, Rodger and Shahidzadeh29). An automatic segmentation algorithm was used to generate the superficial retinal layer (SRL), deep retinal layer (DRL) and overall retinal layer (ORL). Quantitative analysis was performed using custom MATLAB (R2013b) software to convert both segmented and unsegmented angiographic images into binarised and skeletonised images. Then, parameters including vessel diameter index (VDI), vessel area density (VAD) and flow impairment region were used to describe the retinal microvascular morphology and blood flow.
A 3.0 Tesla whole body clinical scanner (Discovery MR750, GE Healthcare) was used to perform head and eye MRI scans. An eight-channel array of head coil and a custom single-loop radio-frequency coil (round, 47 mm in diameter) fixed in front of the right eye were used to image retina–choroidal blood flow and regional CBF with pseudo-continuous arterial spin labelling combining fast suppression spin-echo imaging. The scanning sequences are described in detail in the Supplemental Methods(Reference Strang, Claus and Ramchandani8,Reference Peng, Zhang and Nateras30) . To study retina–choroidal blood flow, imaging of the optic nerve head was roughly bisected by using an axial slice and evaluated using FUNCTOOL workstation (AW4.2, GE Healthcare). The frontal lobe was used as region of interest to evaluate changes in regional CBF(Reference Strang, Claus and Ramchandani8). The blood flow of the whole retina was determined as a function of the distance from the optic nerve head, where the blood flow was measured at the peaks of the projection profiles. Averaged values of blood flow were obtained by using a region of interest, which outlined the parafoveal retina with a size of 0·7–0·8 mm across the retina–choroidal thickness(Reference Zhang, San Emeterio Nateras and Peng31,Reference Gonzaga, Callera and Yogi32) .
Animal studies
Animals
Brown Norway rats (male, age 8–10 weeks, weight 180–200 g) were used in experiments during the light phase of the light–dark cycle with food and water abstinence for 6 h. All animal protocols were approved by the Laboratory Animal Care and Use Committee of Shanghai General Hospital and were implemented in accordance with the National Institutes of Health Guidelines.
Protocol
To further investigate and validate the reliability of participant studies’ results, we constructed an animal model and conducted in vivo and in vitro experiments. Moreover, in vitro experiments can further explore the mechanisms behind physiological changes. For intragastric gavage, the rats were anesthetised with 10 % chloral hydrate (0·3 ml/100 g; Sigma-Aldrich). Red wine (8 ml/kg of dyed wine, 12·5 % vol, Comte Rossi De Prieuac, about 1 g/kg ethanol) or the same amount of water was administered to the corresponding red wine and water groups by gavage in animals fasted for 12 h. The dose of red wine used in our study corresponds to a moderate ethanol consumption per day in humans(1,Reference Münzel, Afanas’ev and Kleschyov33) . At baseline, 0·5 h and 2 h time points, the animals underwent a series of experimental procedures (Figure 1(b)).
In vivo assays
SD-OCTA imaging was performed at three time points, as previously described(Reference Meyer, Marx and Strack34). Scanning dimensions (3 × 3 mm2) were chosen, and the scanning area centred on the region of the optic nerve head. The generation of reactive oxygen species (ROS) in the rat retina was measured under in vivo conditions(Reference Münzel, Afanas’ev and Kleschyov33,Reference Ola, Alhomida and LaNoue35) , with the fluorogenic marker 5-(and 6-) chloromethyl-2,7-dichlorodihydrofluorescein diacetate acetyl ester (CM-H2DCFDA; Invitrogen, cat.no.C6827), a chloromethyl derivative of H2DCFDA. A volume of 3 µl of a CM-H2DCFDA stock solution was injected into the vitreous cavities of anesthetised rats. At the different time points, the whole retina was dissected, sonicated and centrifuged. Then, 100 µl of the supernatant was extracted, and fluorescence analysis was performed at the 485-nm excitation and 538-nm emission wavelengths by using a plate reader (SpectraMax Plus; Molecular Devices).
In vitro assays
The in vitro experimental protocols are described in detail in the Supplemental Methods. The retinas of the rats were dissected from their eyes. Triplicate samples from rats at 0·5 h and 2 h after drinking red wine or water were assayed for differentially expressed genes. Library construction and sequencing were conducted by Sinotech Genomics. Differentially expressed genes analysis of mRNA was performed using the edgeR package. Differentially expressed RNAs were considered significantly modulated and retained for further analysis. Gene ontology as well as Kyoto Encyclopedia of Genes and Genomes (KEGG) pathway analysis were performed via the R package ‘enrich’.
The expression of specific genes in rat retinal tissues was quantitated by real-time PCR (RT-PCR) using ChamQ Universal SYBR qPCR master mix (Vazyme Biotech, Q711-02) and an ABI 7500HT device. The quantitative real-time PCR (qRT-PCR) primer sequences are presented in online Supplementary Table S1. Rat retinal extract samples were loaded and transferred onto PVDF membranes. Specific antibodies to endothelin-1 (ET-1), claudin-5, endothelial nitric oxide synthase (eNOS), β-tubulin and β-actin and the corresponding secondary antibodies were used. Visualisation of the blots was achieved using the enhanced chemiluminescence automated gel imaging analysis system (Amersham Imager 600, GE).
Statistical analysis
Statistical analyses were performed with SPSS version 21.0 (IBM Corporation). Given that the standard deviation parameter of retinal capillary perfusion could not be obtained from the existing literature, the healthy young adults’ study was designed on an exploratory basis with 90 % power and a two-sided 5 % significance. A sample size of 25 per group was recommended for small (0·2) standardised effect sizes(Reference Whitehead, Julious and Cooper36). The distribution of the quantitative variables was analysed through the Kolmogorov–Smirnov test. The correlation of dichotomous variables between the two groups was analysed using the χ 2 test.
In healthy young adults’ studies, repeated-measures ANOVA was used to compare the values (systemic and blood parameters, choroidal and retinal thickness (SS-OCT), macular blood flow (SD-OCTA), eye-ring and CBF (MRI)) of the two groups at baseline, 0·5 h and 2 h; paired-samples t test is used to compare intra-group differences, while independent-sample t test is used to compare inter-group differences in the visual function at baseline and 2 h. Moreover, in animal studies, repeated-measures ANOVA was used to compare the retinal blood flow between the two groups at baseline, 0·5 h and 2 h; paired-samples t test is used to compare intra-group differences, while independent-sample t test is used to compare inter-group differences in retinal ROS production, qRT-PCR and western blot at 0·5 h and 2 h. A P value < 0·05 was considered significant.
Results
Healthy young adults’ studies
Participants’ systemic parameters
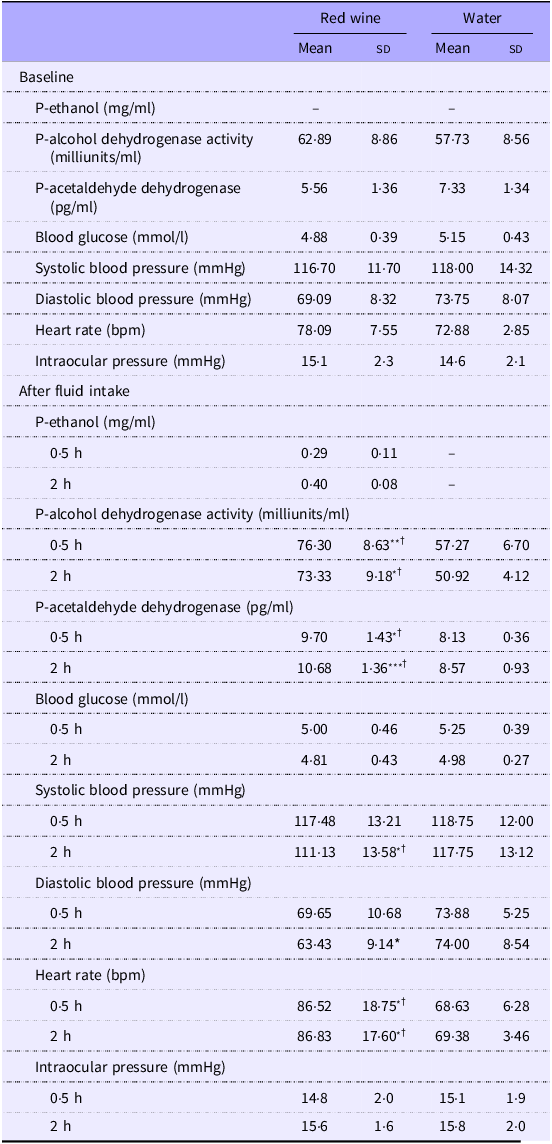
At baseline, there were no significant differences in heart rate, systolic or diastolic BP, IOP, blood glucose, and ADH or ALDH enzyme activity among participants. Two hours after red wine consumption, the plasma ethanol concentration was significantly higher compared with that at 0·5 h after intake. ADH and ALDH activities were significantly increased after red wine consumption compared with the corresponding baseline values in the red wine consumption group and compared with the activities measured in the water group. Moreover, in the red wine consumption group, systolic and diastolic BP values were significantly decreased at 2 h after red wine consumption, whereas heart rate was significantly increased at 0·5 h and 2 h, compared with the baseline values and the corresponding values in the water group (Table 1).
Healthy young adults’ systemic and blood parameters before and after drinking red wine or water (Mean values and standard deviations)

Systemic parameters are represented as the mean (sd) with n 27. Blood parameters are represented as the mean (sd) with n 4. -, Not detected.
Repeated-measures ANOVA:Time effects (reference group: baseline), significance levels: ***P < 0·001, **P < 0·01, *P < 0·05.
Treatment effects (reference group: water intake), significance levels: † P < 0·05.
Participants’ ocular parameters
Visual function
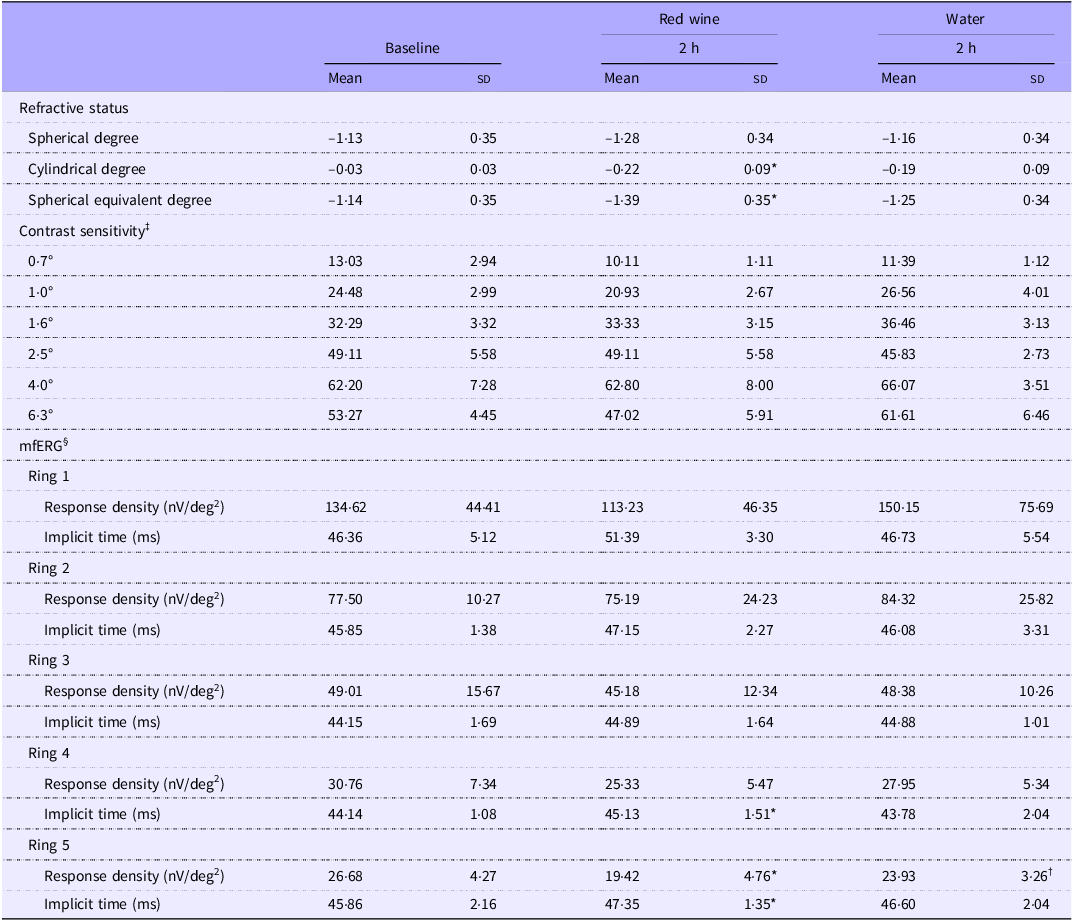
There were no significant differences in refractive status, BCVA, contrast sensitivity and mfERG values at baseline among participants in the two groups. Compared with baseline, the cylindrical and spherical equivalent degrees were significantly lower, and the implicit time values of rings 4 and 5 were significantly longer at 2 h after red wine consumption. Moreover, compared with the corresponding values in the water group, the response density of ring 5 was significantly lower after red wine consumption (Table 2)
Healthy young adults’ visual function parameters before and after drinking red wine or water (Mean values and standard deviations)

mfERG, multifocal electroretinography.
Values are represented as the mean (sd) with n 8.
‡ Contrast sensitivity value was defined as 1/sensitivity threshold.
§ mfERG was performed according to International Society of Clinical Electrophysiology of Vision (ISCEV) standards.
Paired-samples t test:Reference group: baseline, significance levels: *P < 0·05.
Independent-samples t test:Reference group: water intake, significance levels: † P < 0·05.
Choroidal and retinal thickness
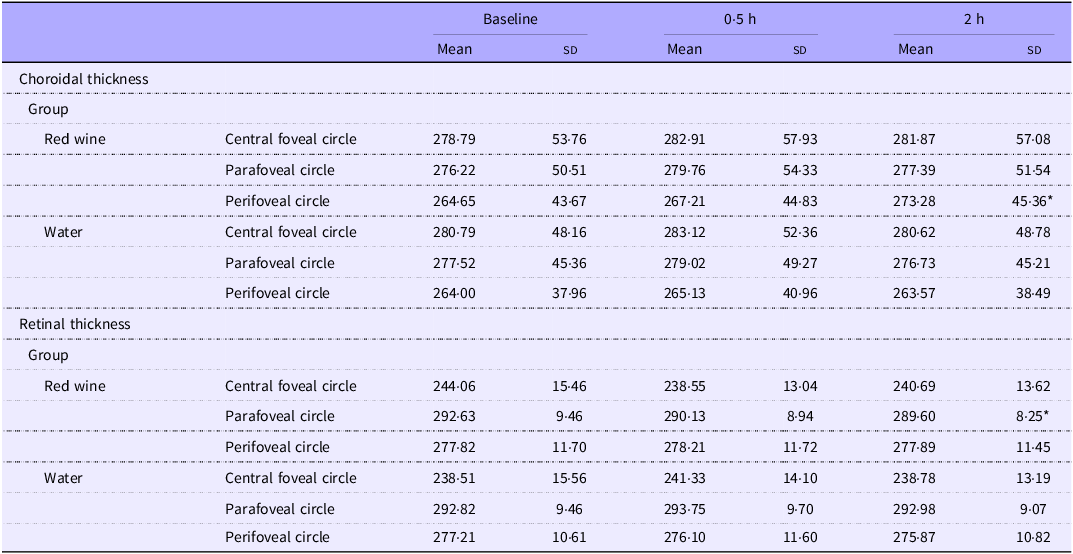
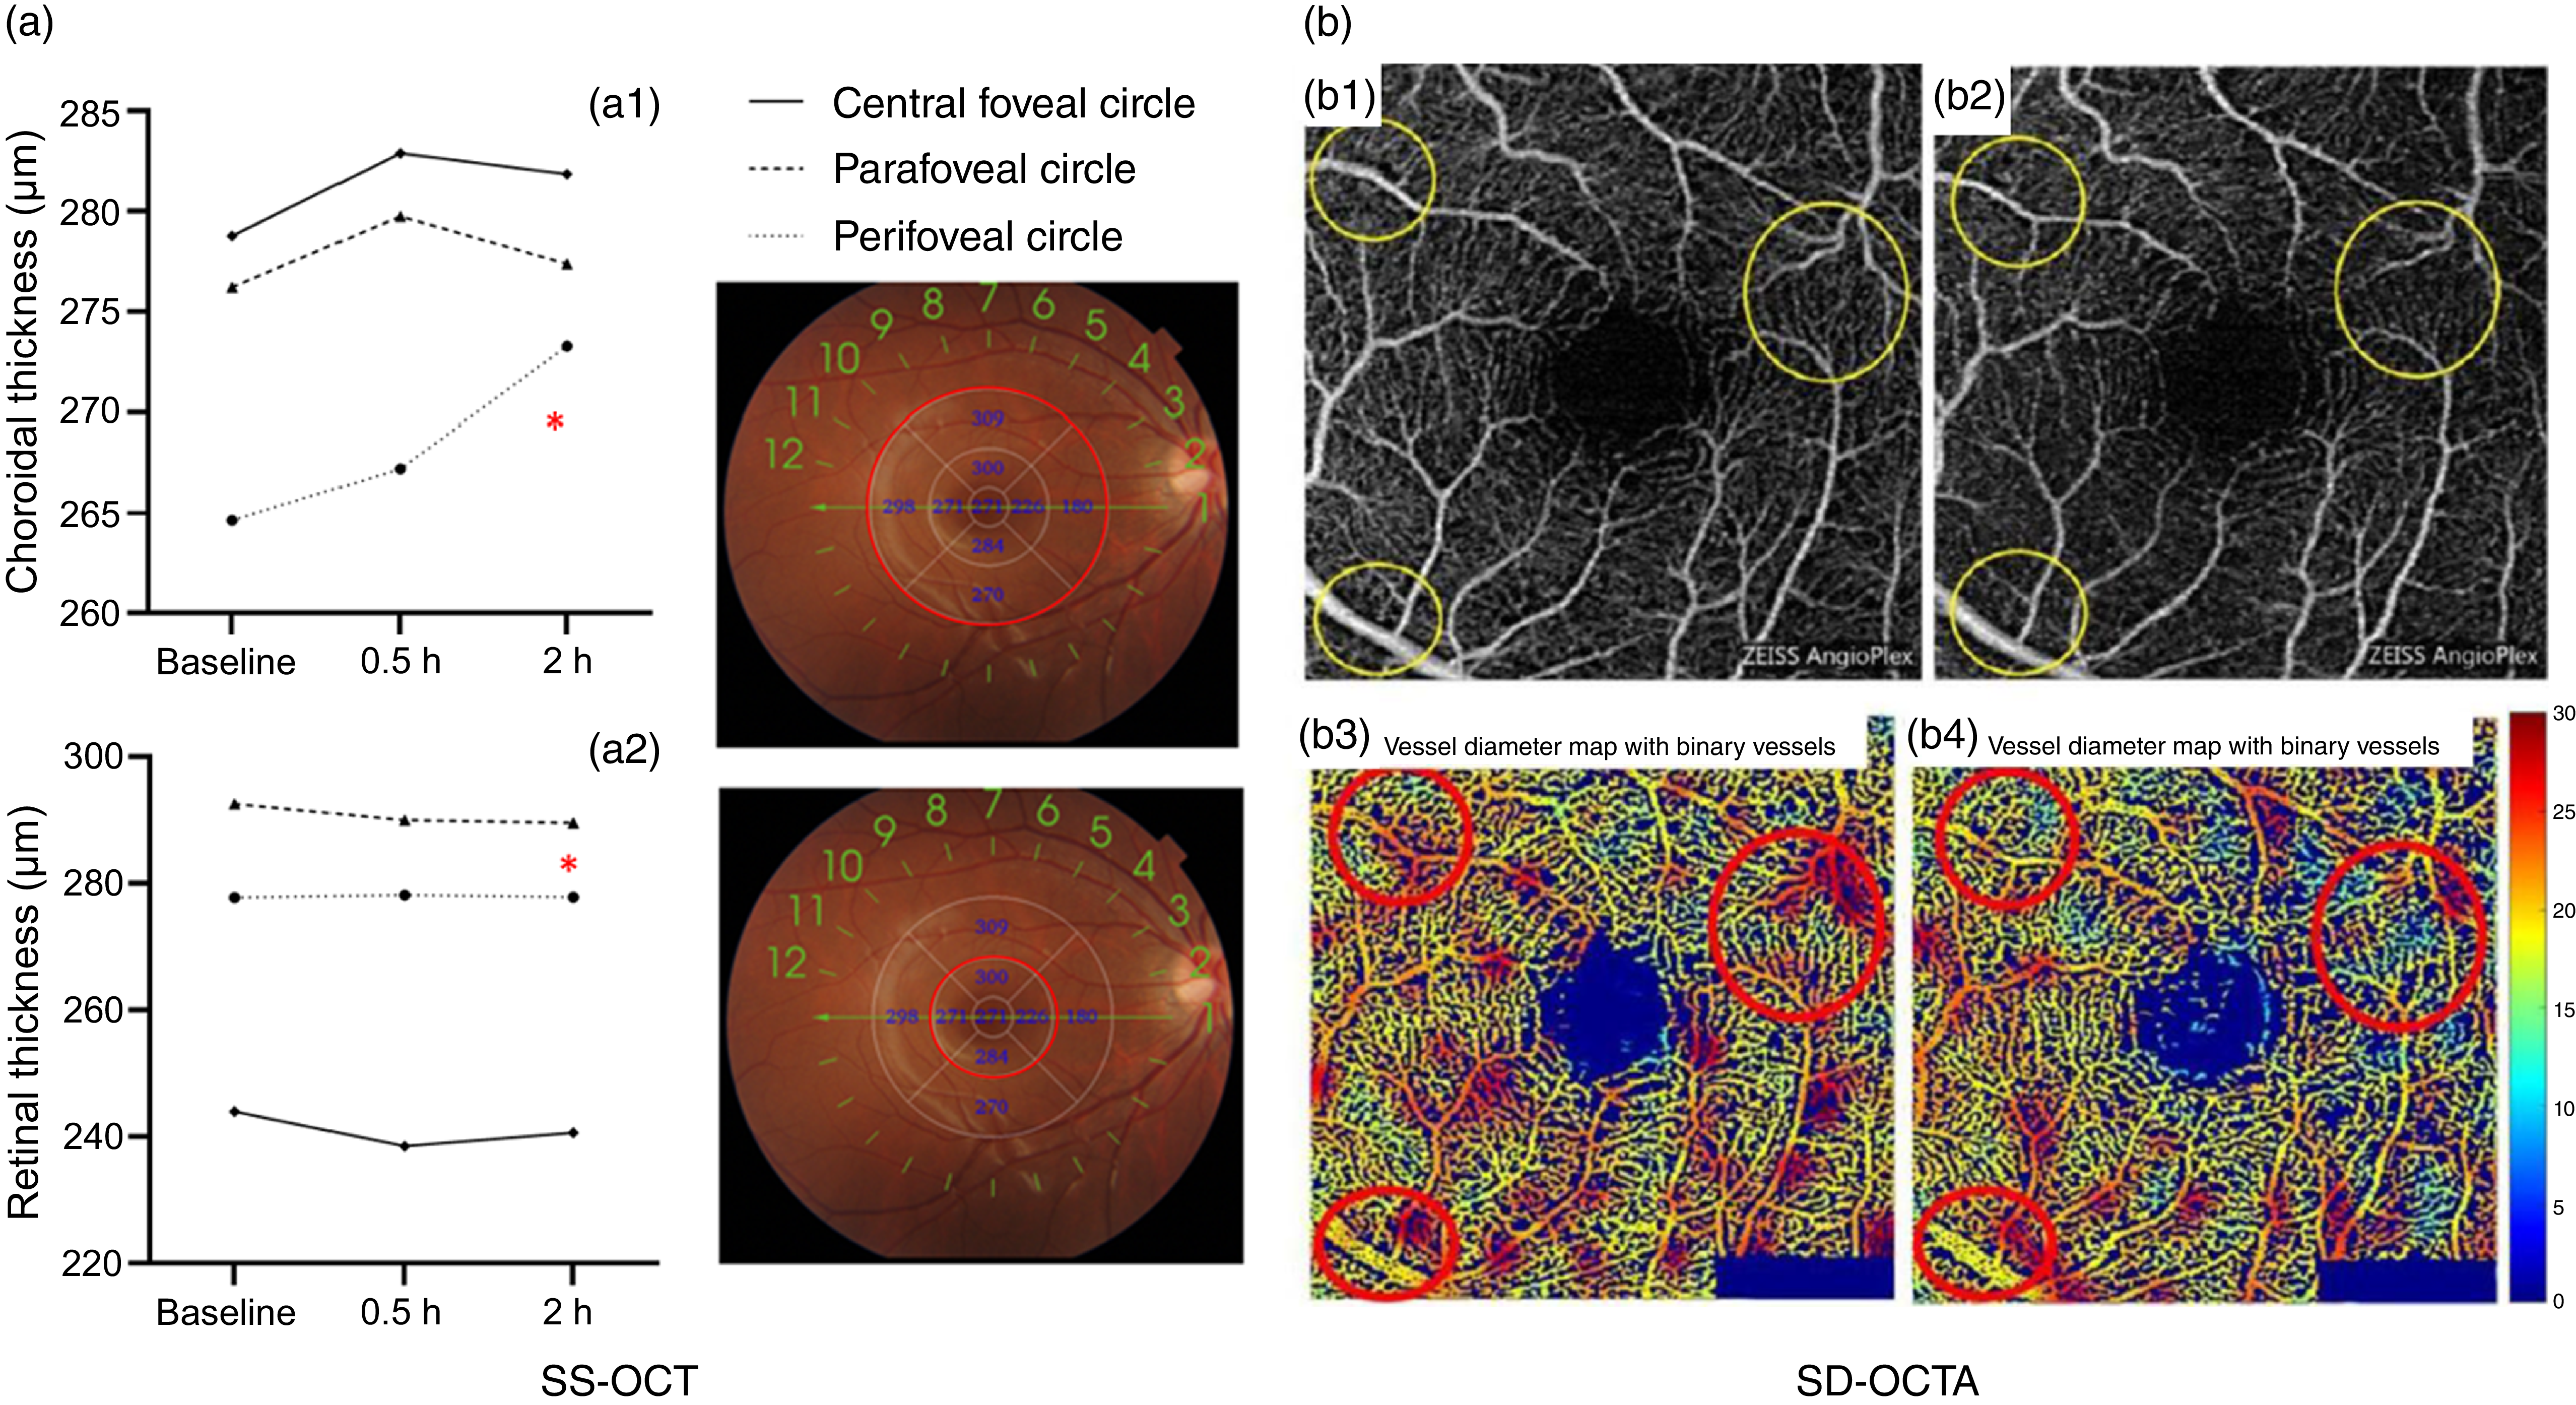
Among the twenty-seven enrolled participants, six men and six women underwent SS-OCT examinations (Table 3 and Figure 2(a)). There was a significant effect of time on the choroidal thickness in the perifoveal circle (F = 7·896, P = 0·001). Choroidal thickness in the perifoveal circle showed a significant interaction between group and time (F = 11·116, P < 0·001), with choroidal thickness increasing with time in the red wine group (Figure 2(a1)). The retinal thickness in the parafoveal circle showed a significant time effect and a significant interaction between group and time (F = 4·074, P = 0·024 and F = 7·194, P = 0·002, respectively). Specifically, the retinal thickness decreased over time in the red wine group. In the central foveal circle, there was no significant effect of time on retinal thickness (F = 0·714, P = 0·495), but a significant interaction was found between group and time (F = 4·386, P = 0·018, Figure 2(a2)).
Healthy young adults’ choroidal and retinal thickness values before and after drinking red wine or water (Mean values and standard deviations)

Values are represented as the mean (sd) with n 12.
Central foveal circle: diameter = 1 mm; parafoveal circle: diameter = 3 mm; perifoveal circle: diameter = 6 mm.
Repeated-measures ANOVA:Time effects (reference group: baseline), significance levels: *P < 0·05.
Healthy young adults’ choroidal and retinal thickness and superficial retinal layer in SD-OCTA images. (a) Red circles indicate areas with significant differences after red wine consumption. Data are presented as mean (sd) (n 12). *P < 0·05 v. water group. (b) 3 × 3-mm areas around the fovea in a healthy 24-year-old man. (b1) and (b2) Original en-face optical microangiography images before and 2 h after red wine consumption. Yellow circles indicate retinal vessels with visible local constriction. (b3) and (b4) Vessel diameter maps with binary vessels. Red circles indicate regions in dark red, demonstrating a significant decrease in the superficial retinal layer from baseline to 2 h after red wine consumption. SD-OCTA, spectral-domain optical coherence tomography angiography; SS-OCT, swept-source optical coherence tomography.

Macular blood flow
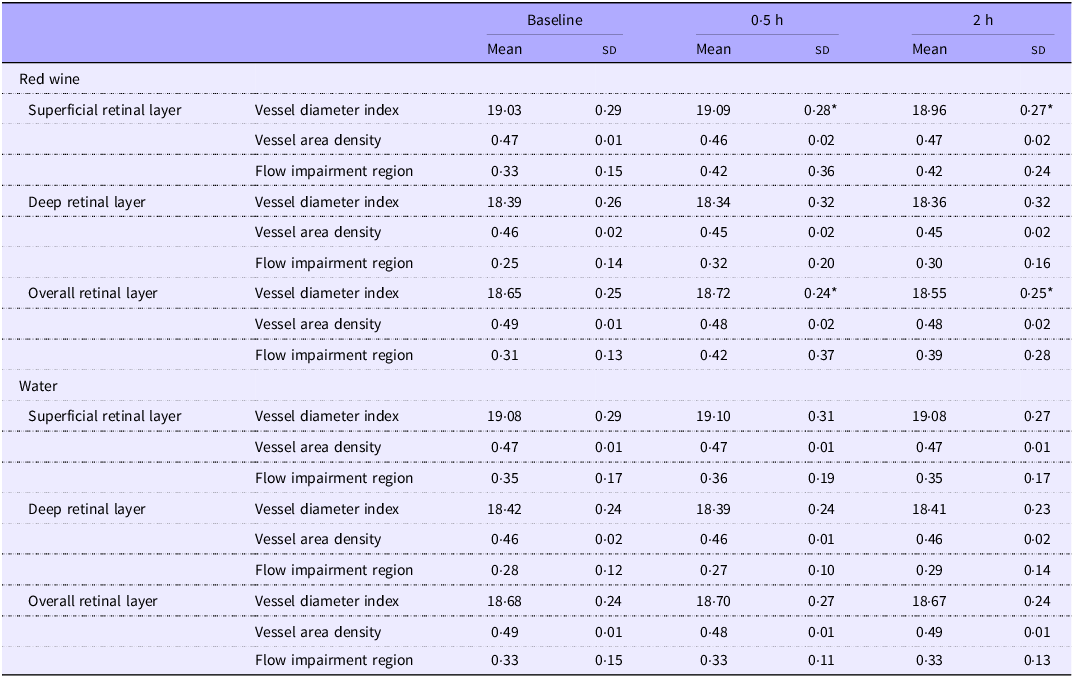
Among all participants, VDI, VAD and flow impairment region showed no significant differences in the baseline SRL, DRL or ORL before red wine or water consumption (Table 4). Compared with the corresponding values in the water group, there were no significant differences in VDI, VAD and flow impairment region of the three retinal layers at 0·5 h and 2 h after red wine consumption. Compared with baseline, VDI of both the SRL and ORL increased significantly at 0·5 h after red wine consumption but decreased significantly at 2 h (Figure 2(b)). VDI in the SRL and ORL showed no significant differences between sexes (P > 0·05). Neither VAD nor flow impairment region significantly changed in the SRL, DRL or ORL after red wine consumption.
Healthy young adults’ macular perfusion parameters before and after drinking red wine or water (Mean values and standard deviations)

Values are represented as the mean (sd) with n 27.
Repeated-measures ANOVA:Time effects (reference group: baseline), significance levels: *P < 0·05.
Participants’ MRI parameters
Eye-ring blood flow
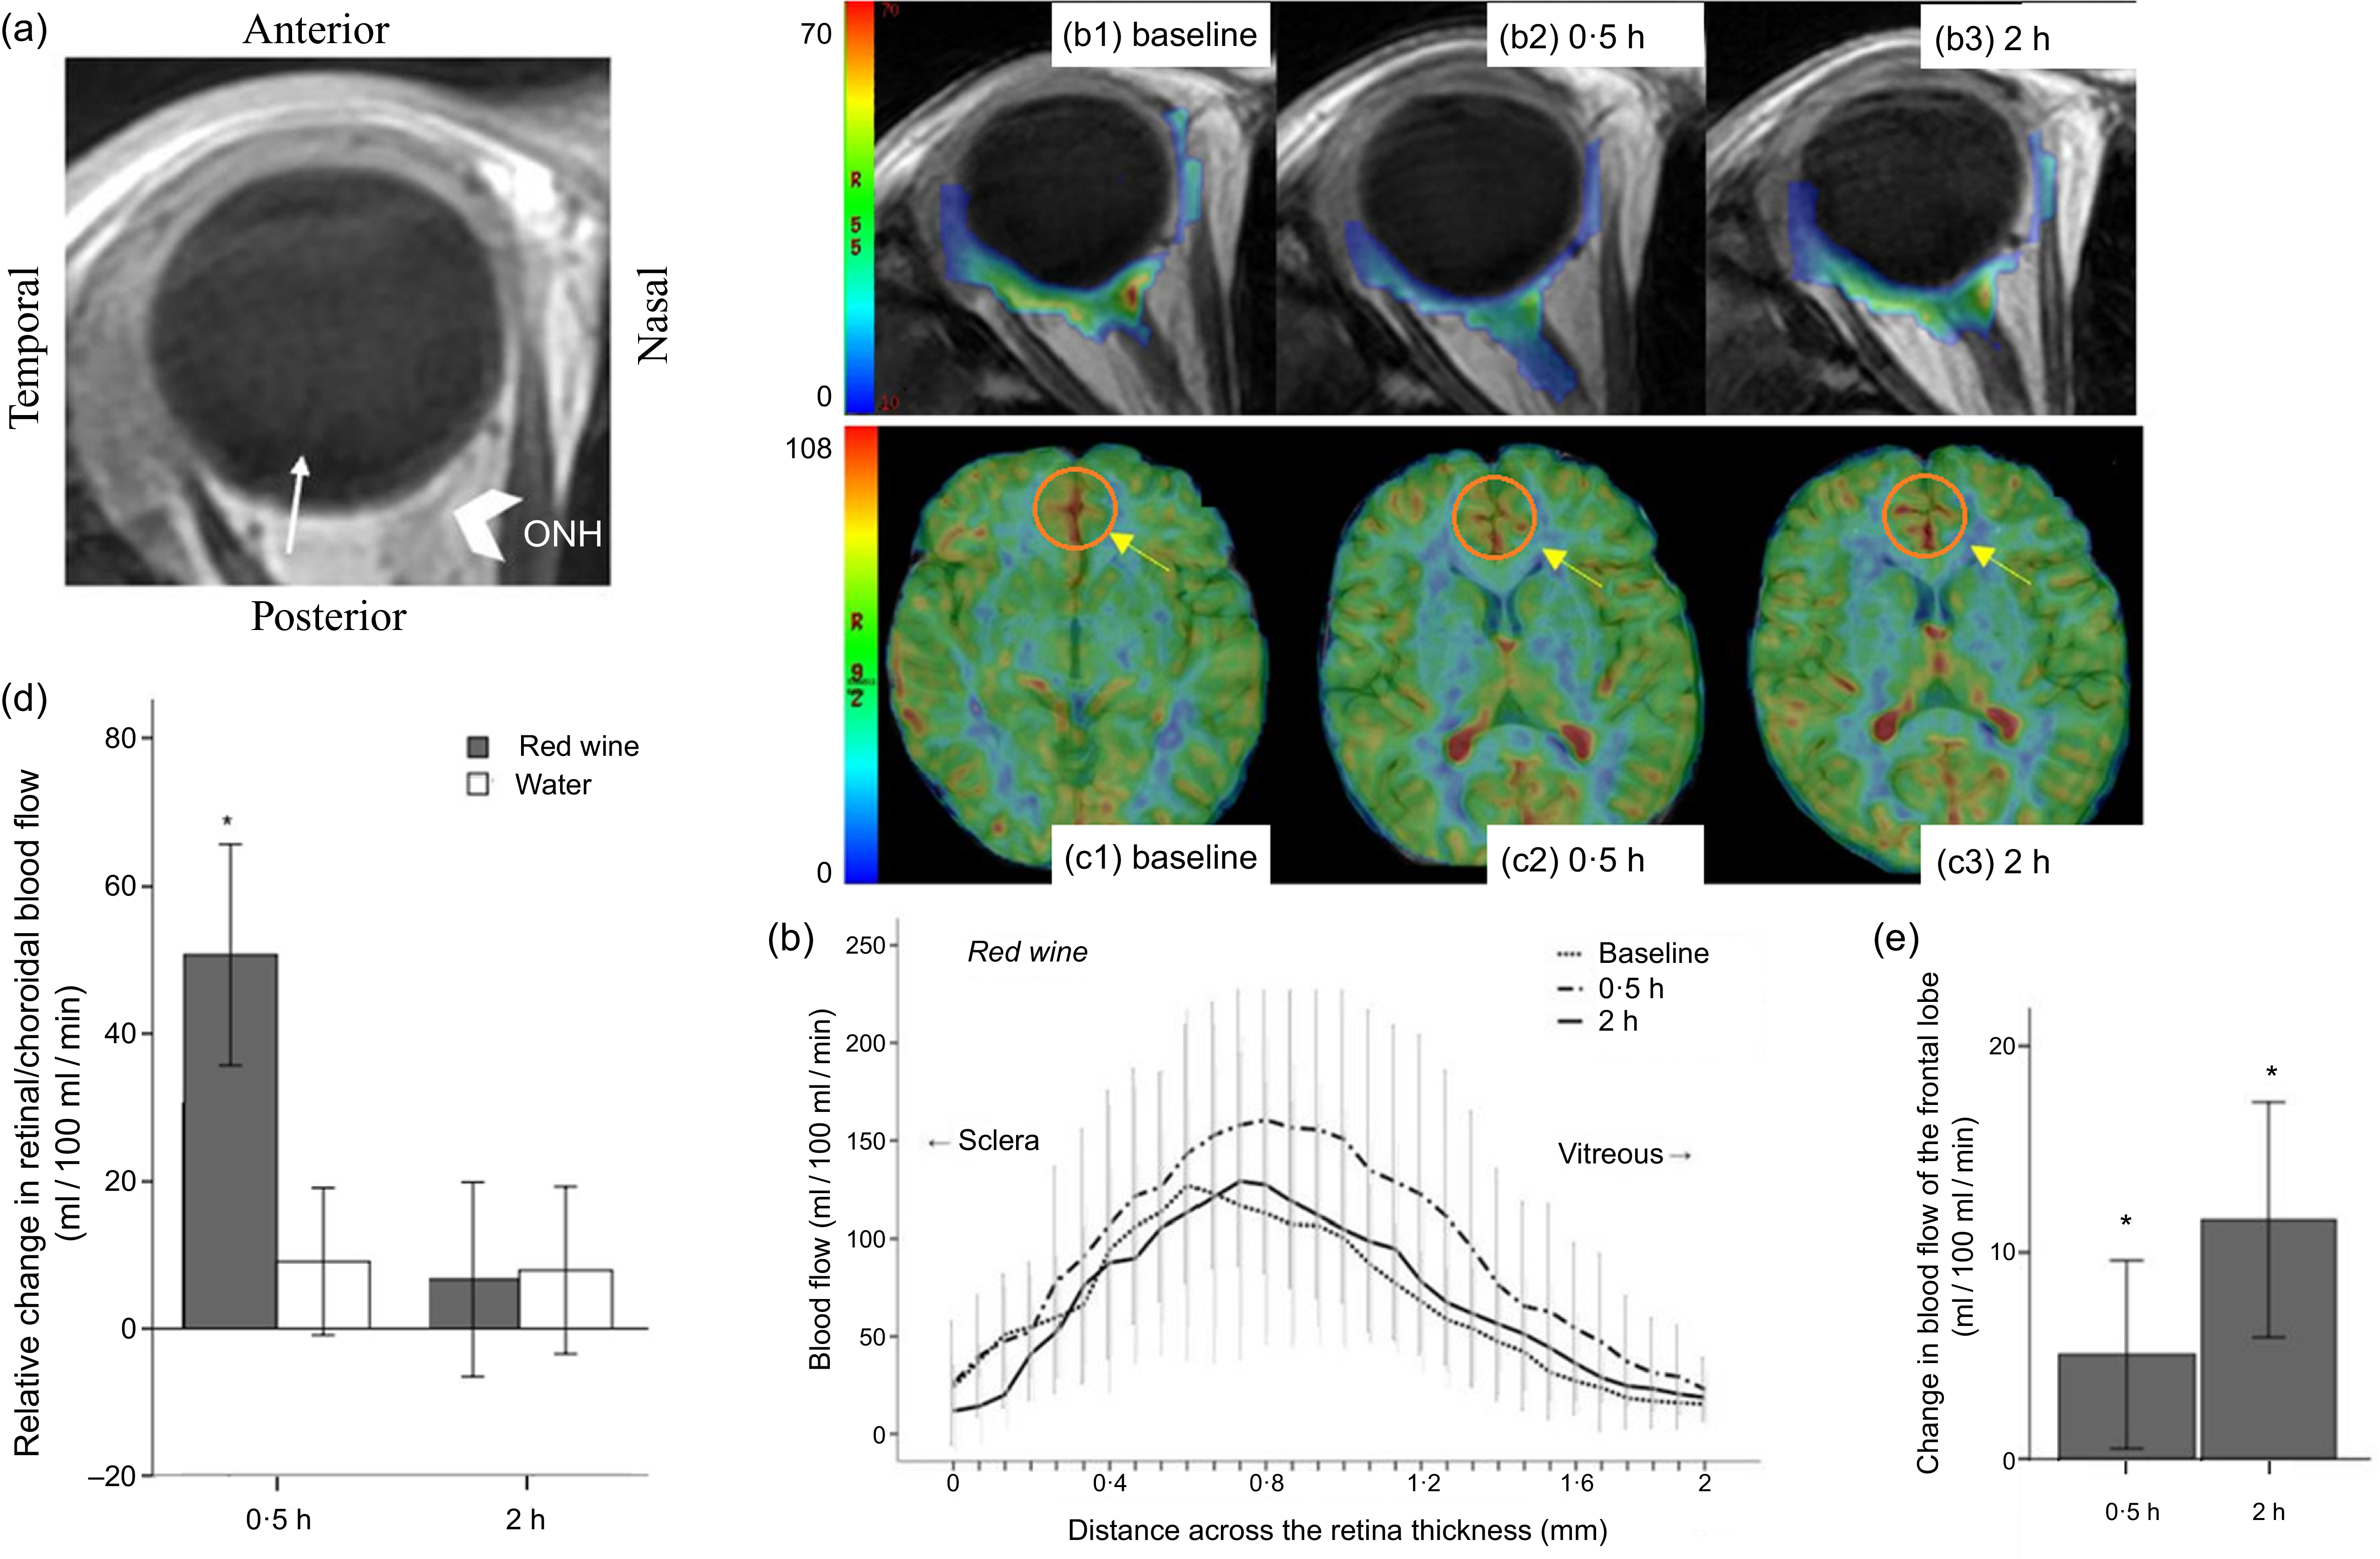
Study participants showed no significant differences in the retina–choroidal blood flow at baseline before red wine or water consumption. The retina–choroidal blood flow was significantly increased at 0·5 h after red wine consumption compared with the baseline level (166·27 (sd 50·43) v. 115·54 (sd 42·12) ml/100 ml/min, P < 0·001) and compared with the corresponding value in the water group (166·27 (sd 50·43) v. 116·36 (sd 29·74) ml/100 ml/min, P < 0·001). However, the retina–choroidal blood flow was not significantly different at 2 h after red wine consumption compared with the baseline level and with the corresponding value in the water group (122·23 (sd 42·58) v. 115·54 (sd 42·12) ml/100 ml/min and 122·23 (sd 42·58) v. 115·16 (sd 12·77) ml/100 ml/min, respectively; Figure 3(a), (b) and (d)). After water consumption, the retina–choroidal blood flow was not significantly different from that observed at baseline.
Healthy young adults’ blood flow across retina–choroidal thickness from the sclera to the vitreous and cerebral blood flow (CBF). MRI based on the pseudo-continuous arterial spin labelling sequence technique was used to compare the blood flow before (baseline) and after red wine consumption. Data are presented as mean (sd) (n 4). *P < 0·05 v. baseline. Vertical lines represent standard errors of the mean. (a) Scout image and slice position. The white thin arrowhead roughly indicates the foveal region, and the white thick arrowhead indicates the optic nerve head (ONH). (b) Blood flow profile before and after red wine consumption across the retinal–choroidal thickness from the sclera to the vitreous. (b1)–(b3) Representative quantitative blood flow (ml/100 ml/min) in rainbow scale from a healthy 23-year-old woman. (c) The frontal lobe map was chosen as the region of interest in different groups. (c1)–(c3) Baseline, 0·5 h and 2 h after red wine consumption. The yellow arrows demonstrate a significant change in blood flow in these regions. (d) Relative changes in retinal–choroidal blood flow from the baseline to 0·5 h and 2 h after red wine and water consumption. (e) Changes in the average regional CBF (ml/100 g/min) as assessed with circled clusters comparing baseline level and levels after red wine consumption, plotted by session and time.

Regional cerebral blood flow
The regional CBF (the frontal lobe) was not significantly different at baseline, 0·5 h and 2 h after red wine consumption when compared with the corresponding values in the water group. However, when compared with the baseline level, regional CBF was significantly increased at both 0·5 h and 2 h after red wine consumption (92·15 (sd 21·54) v. 87·40 (sd 13·80) ml/100 ml/min and 98·85 (sd 23·99) v. 87·40 (sd 13·80) ml/100 ml/min, P < 0·05; Figure 3(c) and (e)).
Animal studies
Retinal blood flow
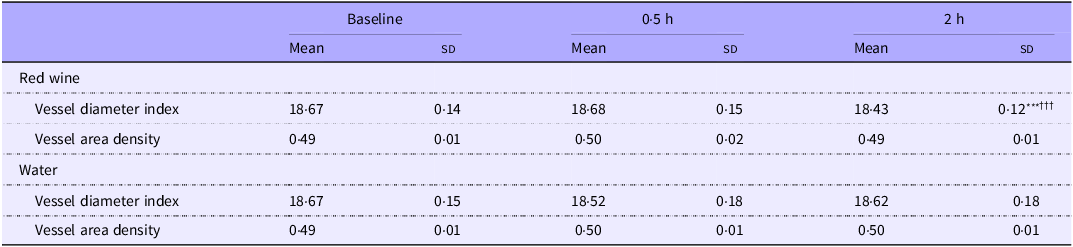
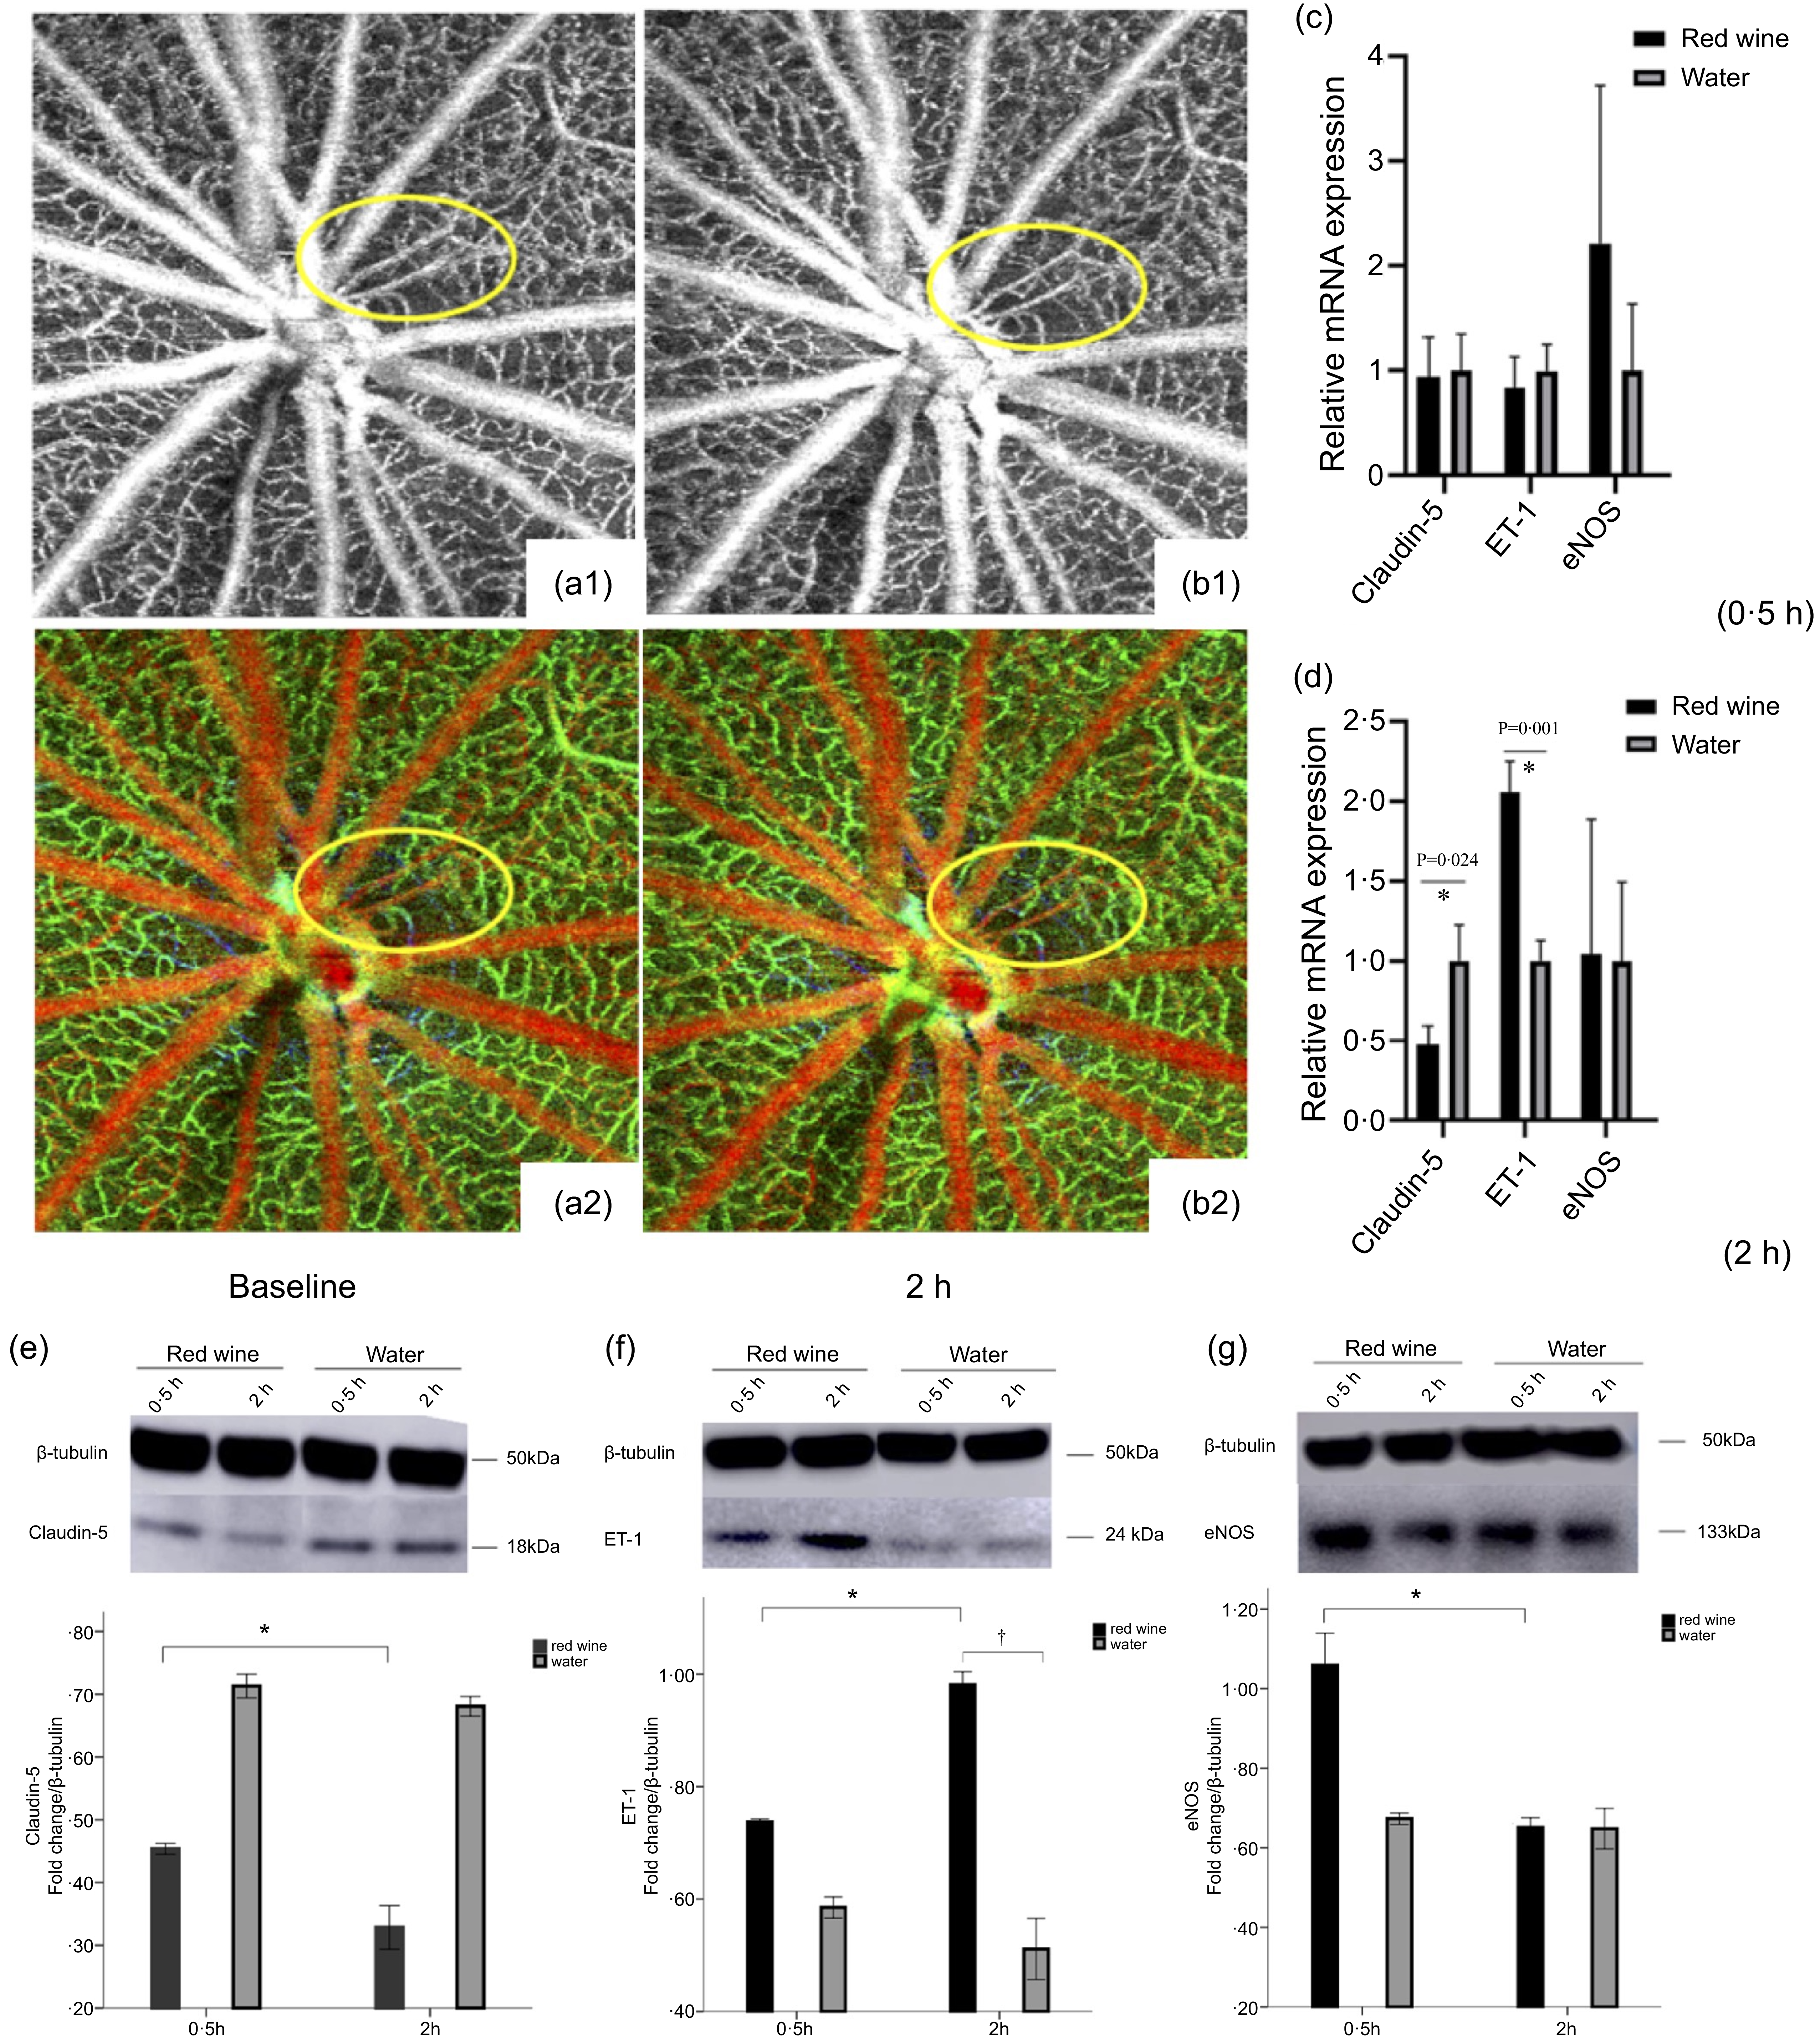
The two study groups, each included forty male Brown Norway rats, showed no significant differences in age or weight. The VDI and VAD values measured with SD-OCTA were highly reproducible with test–retest correlation coefficients of 0·95–0·97 (n 12). The results of the VDI and VAD statistical analysis are shown in Table 5 and Figure 4(a)–(b). There were significant effects of time on VDI and VAD values in the fundus blood vessels (F = 11·361, P < 0·001 and F = 3·257, P < 0·05, respectively). Moreover, significant interactions between group and time were found for VDI and VAD (F = 15·765, P < 0·001 and F = 7·699, P = 0·001, respectively); both VDI and VAD values decreased with time in the red wine group.
Rats’ retinal perfusion parameters before and after drinking red wine or water (Mean values and standard deviations)

Values are represented as the mean (sd) with n 20.
Repeated-measures ANOVA:Time effects (reference group: baseline), significance levels: ***P < 0·001.
Treatment effects (reference group: water intake), significance levels: ††† P < 0·001.
Retinal perfusion parameters of SD-OCTA images and relative mRNA expression and western blot results in an animal model. (a)–(b) 6 × 6 mm areas around the optic nerve head in Brown Norway rats before and after intragastric administration of red wine. (a1) and (a2) Baseline; (b1) and (b2) 2 h after red wine consumption. Yellow circles indicate a significant decrease in retinal perfusion from baseline levels to those 2 h after red wine consumption. (c) and (d) mRNA expression of claudin 5, ET-1 and eNOS at 0·5 h and 2 h after red wine and water consumption. Data are presented as mean (sd) with (n 3). *P < 0·05 red wine group 2 h v. 0·5 h; † P < 0·05 red wine v. water group. (e)–(g) Retinal tissue specific protein expression blots of claudin 5, ET-1 and eNOS along with β-tubulin. Data are presented as mean (sd) with (n 3). *P < 0·05 red wine group 2 h v. 0·5 h; † P < 0·05 red wine v. water group. SD-OCTA, spectral-domain optical coherence tomography angiography; ET-1, endothelin-1; eNOS, endothelial nitric oxide synthase.

Retinal reactive oxygen species generation
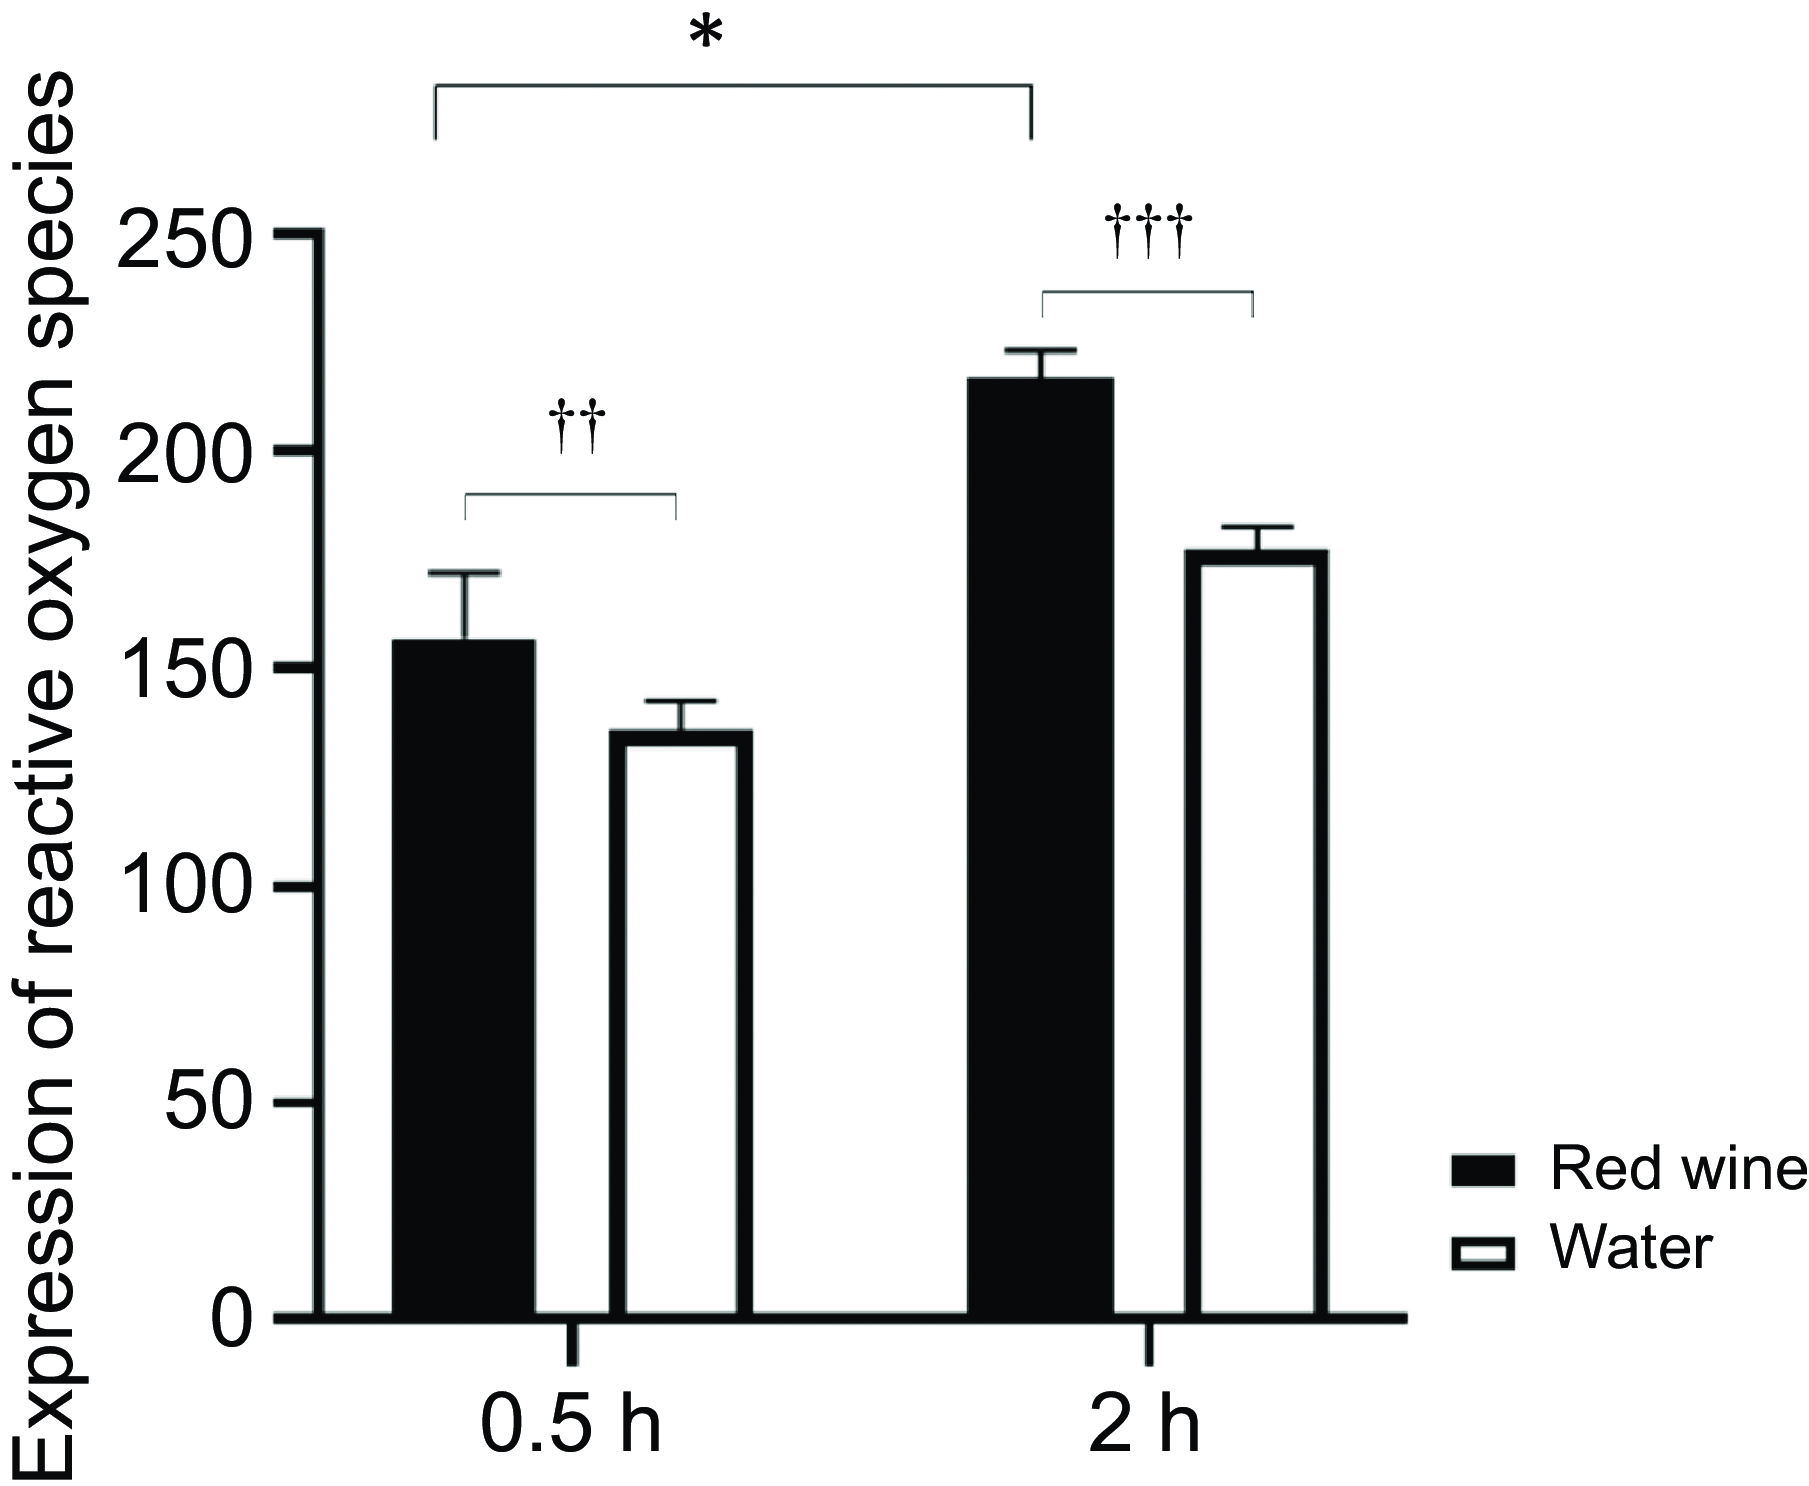
As shown in Figure 5, the ROS production in the retinas of rats was significantly higher at 0·5 h in the red wine group than that in the water group (156·83 (sd 15·25) v. 136·50 (sd 6·95), P < 0·01). Similarly, at 2 h, ROS generation in the red wine group was significantly higher than that in the water group (217·17 (sd 6·24) v. 177·17 (sd 5·35), P < 0·001).
Reactive oxygen species levels in the rats’ retina after intragastric administration of red wine or water. Data are presented as mean (sd) (n 3). *P < 0·05 red wine group 2 h v. 0·5 h; †† P < 0·01 and ††† P < 0·001 v. water group.

Retinal differentially expressed genes
A total of 145 differentially expressed genes were screened, including fifty-one up-regulated and ninety-four down-regulated genes (online Supplementary Figure S1A). Our study demonstrated a significant down-regulation in the retina of claudin-5 expression after red wine intake (P < 0·001). These results were further validated at the protein and mRNA levels through western blot and RT-PCR. Gene ontology annotation and KEGG pathway analysis revealed that tight junction and renin secretion processes were altered in rats following red wine intake.
Retinal quantitative real-time PCR and western blot analyses
Changes in claudin-5 expression were verified using qRT-PCR and western blots. In the red wine group, claudin-5 levels at 2 h were significantly downregulated compared with those at 0·5 h, which was observed at both the mRNA and protein levels (Figure 4(c)–(e)). At 2 h, no significant difference was found in the mRNA expression of eNOS between the water and red wine group; however, ET-1 expression was significantly higher in the red wine group than in the water group (P = 0·001; Figure 4(c)–(d)). At the protein level, eNOS was downregulated at 2 h in the red wine group compared with the water group (Figure 4(g)). Moreover, there was a higher expression of ET-1 compared with that in the water group (Figure 4(f)).
Discussion
In recent days, accumulating evidence has aroused a wide discussion about societal attitudes towards the consumption of alcoholic beverages. While red wine contains a mixture of compounds, such as tannins, resveratrol and other substances with proven benefits for the human cardiovascular system due to their anti-inflammatory, antioxidant and cytoprotective effects, ethanol is the major component of red wine besides water. Current clinical and epidemiological evidence have shown that the pro-oxidant effects of ethanol metabolites could counter the beneficial antioxidant effects of other red wine components(Reference Haseeb, Alexander and Baranchuk37). Although there is genetic and phenotypic heterogeneity in alcohol response, alcohol-induced endothelial damage generally occurs(Reference Mukamal, Conigrave and Mittleman38). Moreover, a recent meta-analysis suggested that the cardiovascular protective effect of moderate drinking could be due to selection bias(Reference Stockwell, Zhao and Panwar6). Therefore, there is currently insufficient evidence to support the recommendation of moderate alcohol consumption in abstinent patients.
The findings of our study suggest that acute red wine consumption caused abnormal changes in retinal function that preceded changes in vision in healthy young adults. The retinal microvasculature quickly changed from vasodilation to vasoconstriction, despite increased regional CBF, which was consistent with an increase in choroidal thickness and a decrease in the retinal thickness following red wine intake. The animal experiments also demonstrated a significant decrease in the VDI and VAD of the rat retina with increased ROS production following red wine consumption. The decreased eNOS levels and increased ET-1 levels observed in the retina provide novel insights into possible mechanisms of retinal vasoconstriction after acute red wine intake.
Experimental evidence on the acute effects of alcohol intake, especially red wine consumption, on the ocular microvasculature is sparse and contradicting. In an in vitro study, ethanol inhibits IL-1β-mediated vasorelaxation by suppressing the expression of inducible NOS. Two hours after acute red wine consumption, a non-significant reduction in the plasma levels of the vasoconstrictor 20-hydroxyeicosatrienoic acid and a significant decrease in BP were found, coinciding with the highest blood alcohol concentration(Reference Yuui, Kudo and Kasuda39). Similarly, our study found a significant decrease in BP and an increase in heart rate, which may be associated with NO release, sympathetic nervous system stimulation and noradrenaline increase(Reference Barden, Croft and Beilin40–Reference Spaak, Merlocco and Soleas42). Previous studies have reported that altered eating habits may lead to refractive errors and a deterioration of the visual discrimination capacity after oral alcohol intake(Reference Nowroozzadeh, Mirhosseini and Meshkibaf43,Reference Castro, Ortiz and Pozo44) . Our study also found a significant decrease in cylindrical and spherical equivalent degrees after moderate red wine consumption, although the BCVA remained constant. In addition, reduced amplitude density and extended reaction time were mainly observed in rings 4 and 5 of the mfERG, compared with the baseline values in the red wine group and the corresponding values in the water group. Changes in implicit time and response density in the mfERG are sensitive indicators of retinal dysfunction(Reference Shimada, Li and Bearse45). These results indicate that alcohol damages to the retina first occur in the periphery, and retinal function being impaired before vision and contrast sensitivity decline.
Compared with the direct oral or intravenous administration of ethanol used in other studies, our study using red wine intake more closely reflect daily dietary habits and normal physiological processes(Reference Luksch, Resch and Weigert11,Reference Dhasmana, Herbert and Patel13) . Meanwhile, no sex differences were observed in our participant studies, and male rats were selected for our animal experiments to avoid other confounding factors. The definition of moderate alcohol consumption differs according to the defining scientific society, region and sex (no > 196 g (14 drinks) per week for men and no > 98 g (seven drinks) per week for women, or 28 g (two drinks) per day for men or 14 g (one drink) per day for women, respectively)(Reference Chiva-Blanch, Arranz and Lamuela-Raventos2). However, some scholars have recommended a modification of existing policy guidelines with differential optimal consumption levels by age rather than by sex(Reference Thelle and Grønbæk46,Reference Kang, Lee and Roh47) . Moreover, previous studies have suggested that recommendations on the optimal levels of alcohol consumption also need to take into account the general rates of diseases and injuries in each population.
Previous studies have described the vasoactive ethanol effects on major retinal vessels, whereas effects on the microvasculature(Reference Luksch, Resch and Weigert11,Reference Kojima, Sugiyama and Kojima12,Reference Kiviniemi, Saraste and Lehtimäki48) , which is the most important source of flow resistance, are rarely discussed. Therefore, the mechanisms underlying acute effects on microvasculature after red wine intake remain unclear. Our study concentrated on changes in macular and choroidal microvascular circulation after ethanol intake and demonstrated retinal vasodilation on SD-OCTA. This acute effect after moderate red wine consumption occurred when the blood ethanol concentration was relatively low; however, as more ethanol was absorbed into the blood via digestion, the VDI parameters representing the retinal microvascular morphology and blood flow measured by SD-OCTA significantly decreased in both healthy young adults and animals. Our study also found a significant increase in the choroidal thickness measured by SS-OCT, representing increased choroidal blood flow(Reference Novais, Badaró and Allemann49), as well as a significantly increased retina–choroidal blood flow measured by MRI that subsequently decreased to baseline levels with increasing blood ethanol concentrations. Therefore, we hypothesised that macular vasoconstriction or vasodilation may be related to the blood ethanol concentration. Acute alcohol consumption, even in relatively moderate doses, may decrease vasorelaxation, thereby shifting the contraction–relaxation balance towards contraction(Reference Kudo, Yuui and Kasuda50).
Endothelium-dependent relaxation is mediated by the NO pathway. The vasodilator effect of alcohol is associated with a higher expression of eNOS(Reference Abou-Agag, Khoo and Binsack51). However, the alcohol effects on endothelial function itself are more complex. Previous studies in rats have found that moderate doses of alcohol increase the expression of eNOS in the aorta, and vascular relaxation may result from an increase in NO levels(Reference Abou-Agag, Khoo and Binsack51,Reference Kleinhenz, Sutliff and Polikandriotis52) . Conversely, acute alcohol treatment inhibits NO-mediated relaxation(Reference Kudo, Yuui and Kasuda50). Our study demonstrated an increase in oxidative stress and increased levels of ET-1 in the rat retina following the intake of a relatively moderate amount of red wine, thereby affecting vascular endothelial cells and causing microvascular contraction. Furthermore, our study demonstrated a significant down-regulation in the retina of claudin-5 expression, which is closely related to the blood–retinal barrier, after red wine intake, possibly indicating decreased endothelial permeability (Reference Kakogiannos, Ferrari and Giampietro53). While moderate alcohol consumption has been suggested to reduce the risk of cardiovascular events, its effects on retinal microcirculation could lead to unfavourable outcomes, even in an apparently healthy population.
Furthermore, similar to previous reports, our study confirmed that acute red wine intake increases brain perfusion (Reference Strang, Claus and Ramchandani8). Acute ethanol effects may be restricted by some protective mechanism(s) in the retinal microvasculature, such as fluid accumulation in the retina, abnormal exchange of waste and nutrients between the retina and choroid, and retinal hypoxia (Reference Reiner, Fitzgerald and Del Mar54).
The present study has several limitations. First, the small sample size may have biased the results regarding the association between acute red wine consumption and retinal and CBF. But this self-controlled study design not only saves sample size but also eliminates individual differences. Second, instead of using plain ethanol or grape juice, the current study used plain water as a control, which may not be an adequate control as red wine contains phenolic compounds. Further prospective, controlled, observational and animal studies are needed to elucidate whether acute retinal vasoconstriction after red wine consumption could lead to retinal ischaemia in susceptible individuals and to explore the underlying mechanisms.
Conclusion
This study found that the consumption of moderate amounts of red wine caused acute vasoconstriction in the retinal microvasculature that preceded vision changes in healthy young adults, despite increased regional CBF. Possible mechanisms revealed through an animal model include a significant increase in ROS production after red wine consumption, as well as decreased eNOS levels and increased ET-1 levels in the retina. With the widespread consumption of alcohol worldwide and the increasing prevalence of chronic diseases in people of young age, our study provides benchmark values for potential detrimental effects in people with drinking habits.
Supplementary material
For supplementary material/s referred to in this article, please visit https://doi.org/10.1017/S000711452510562X
Acknowledgements
The authors thank the staff and participants for their important contributions.
This work was supported with funding from the National Natural Science Foundation of China (no. 81700844), Shanghai Eye Disease Prevention and Treatment Center (no. 20JC01001 and 23LC01004), Shanghai Municipal Commission of Health and Family Planning (no. 20164Y0237), Shanghai Municipal Commission of Health (no. GWV10.1-XK7), Shanghai Engineering Research Center of Precise Diagnosis and Treatment of Eye Diseases (no. 19DZ2250100) and Health Industry of Shanghai Municipal Health Commission (no. 202240304).
Y. X. and X. F. Z.: conception and design of the study, interpretation of the results, revision and drafting the work; J. Z. and Y. Y. W.: investigation and software of the study, and data analysis; Z. D. C. and R. K. W.: validation and visualisation of the results; H. D. Z. and L. N. L.: conception and supervision of the study, and funding acquisition.
There are no conflicts of interest.