Introduction
The present study investigated the effect of hypobaric pressure exposure on cochlear frequency selectivity, assessed via psychophysical tuning curves, transiently evoked otoacoustic emissions (TEOAEs) and speech recognition scores, in subjects with monaural, fluctuating, low-frequency hearing loss and monaural Ménière's disease. Ménière's disease is closely related to increased inner-ear pressure due to increased fluid volume (i.e. endolymphatic hydrops)Reference Kimura, Vesterhauge, Katholm and Mikines1, Reference Xenellis, Linthicum, Webster and Lopez2 and is usually associated with fluctuating, low-frequency hearing loss. Studies on the effect of pressure on the cochlear physiology of subjects with Ménière's disease have created relative overpressure in the middle ear by placing subjects in a hypobaric pressure chamber, in order to impose a pressure gradient on the inner ear.Reference Konrádsson, Carlborg, Grenner and Tjernström3–Reference Tjernström, Casselbrant, Harris and Ivarsson6 These studies have aimed to assess possible effects on the inner ear regarding primary hearing thresholds, speech recognition scores and, in some cases, otoacoustic emissions (reflecting outer hair cell function). Hearing improvements have been observed in some subjects.Reference Konrádsson, Carlborg, Grenner and Tjernström3–Reference Tjernström and Pfaltz7 Improved speech recognition scores have been observed after pressure exposure,Reference Konrádsson, Carlborg, Grenner and Tjernström3, Reference Densert8 a finding also observed by the present authors during a pilot study. It is known that cochlear frequency selectivity affects speech recognition scores.Reference Stelmachowicz, Jesteadt, Gorga and Mott9
The increased inner-ear pressure present in endolymphatic hydrops is believed to mostly affect the passive mechanics of the apical partition of the inner-ear membranes, which increases the travelling wave velocity, and to shift the characteristic place of basilar membrane displacement towards the base of the cochlea.Reference Donaldson and Ruth10–Reference Serbetcioglu and Parker16 In Ménière's disease and other fluctuating, low-frequency hearing loss of cochlear origin, the relocation of travelling wave displacement might be manifested as off-frequency listening (i.e. low frequency tones are detected by high frequency hair cells).Reference Huss and Moore17–Reference Florentine and Houtsma20 Off-frequency listening may be observed via psychophysical tuning curves.
The aim of the present report was to study the effect of hypobaric pressure exposure on cochlear frequency selectivity, assessed by psychophysical tuning curves, TEOAEs and speech recognition scores in noise in subjects with Ménière's disease and monaural, fluctuating, low-frequency hearing loss.
Materials and methods
Subjects
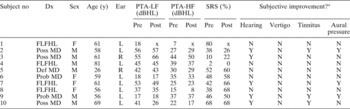
Ten subjects (four women and six men; mean age 59 years, standard deviation ±13) diagnosed with monaural, fluctuating, low-frequency hearing loss participated in the study. All subjects showed normal otological status in both ears and no previous history of middle-ear disease. Descriptive data are presented in Table I, including baseline, pre-exposure, low- and high-frequency pure tone hearing thresholds, given as pure tone averages (PTAs). (Lower frequency PTAs were measured at three frequencies in the range 0.125–0.5 kHz and high frequency PTAs at three frequencies in the range 1.0–4.0 kHz.) Subjects are presented in order of monotonically increasing exposure duration. Six of the subjects were diagnosed with Ménière's disease; this diagnosis was made in accordance with the guidelines of the American Academy of Otolaryngology–Head and Neck Surgery's committee on hearing and equilibrium guidelines.21 Four subjects who had never experienced vertigo were classified as having fluctuating, low-frequency hearing loss without vertigo, using the same criteria (vertigo excluded). The cochlear origin of the subjects' fluctuating, low-frequency hearing loss had been confirmed prior to inclusion by otomicroscopy, pure tone audiometry, speech audiometry, impedance audiometry and auditory brainstem response audiometry, and in some cases also by magnetic resonance imaging (MRI).
Patient data, before and after hypobaric pressure exposure

* Reported at follow up. No = number; Dx = diagnosis; y = years; Ear = affected ear; PTA-LF = low frequency pure tone average (0.125–0.5 kHz); PTA-HF = high frequency pure tone average (1.0–4.0 kHz); SRS = speech recognition scores in noise; pre = before hypobaric pressure exposure; post = after hypobaric pressure exposure; FLFHL = fluctuating, low-frequency hearing loss without vertigo; poss = possible; def = definitive; prob = probable; MD = Ménière's disease; F = female; M = male; L = left; R = right; N = no; Y = yes; x = missing data
All tests (tympanometry, speech recognition scores in noise, TEOAEs, Békésy audiometry and psychophysical tuning curves) were either conducted by or supervised by the first author, in a sound-proof booth at approximately 10 m above sea level and at prevailing (i.e. normal, ambient) atmospheric pressure. Tests were conducted before and after pressure exposure. Less than 15 minutes elapsed between conclusion of the pre-exposure test session and commencement of pressure exposure. Similarly, less than 15 minutes elapsed between conclusion of pressure exposure and initiation of the post-exposure test session. Written and oral instructions were given before each test. Written instructions were also given on a computer screen during the psychophysical tuning curve test. The subjects were also given the opportunity to ask questions about the tests and the procedures used. The total time duration for all tests and all pressure exposures was approximately 270 minutes.
Investigations were performed in accordance with the Helsinki Declaration, and the ethics committee of Lund University approved the study (LU 509-03).
Tympanometry, speech recognition scores and otoacoustic emissions
Before pressure exposure, subjects' normal otological status was verified and tympanometry conducted using either a GSI 33 middle-ear analyser or a GSI Tympstar middle-ear analyser (GSI, Madison, MI, United States) (0.226 kHz probe tone and pressure range −300 to 200 daPa).
Speech recognition scores in noise was assessed according to the method of Magnusson.Reference Magnusson22 Fifty phonemically balanced, monosyllabic words at the end of a carrier sentence were presented through TDH-39P earphones (Telephonics, Interacoustics, Assens, Denmark) using an Orbiter 922 audiometer (Madsen Electronics, GN Otomertrics, Taastrup, Denmark), calibrated in a 6 cc coupler according to the reference sound pressure levels stated in ISO 389-1.23 Wordlists were randomly assigned.
Transiently evoked otoacoustic emission measurements were performed using a default set-up in the non-linear mode, using either an ILO88 Otodynamics otoacoustic emission analyser (software version 5.60Y) or an ILOv6 Otodynamics otoacoustic emission analyser (stimulus level range 83–85 dB peak equivalent SPL) (Otodynamics Ltd., Hetfield, United Kingdom). The noise rejection level used was ≤51 dB peak equivalent SPL, and the noise input level ranged between 34 and 45 dB peak equivalent SPL.
Békésy audiometry
A personal computer with an external sound card (M-Audio Audiophile (24 bits, 48 kHz); M-Audio, Ohringen, Germany) and sound-shielded, circumaural, Sennheiser HDA 200 earphones (Sennheiser, Tullamore, Ireland) were used. Custom-built computer software (designed with Matlab 6.5 software) was used for generation and presentation of the stimuli, and also for recording of subjects' responses (for more details, please refer to Brännström and GrennerReference Brännström and Grenner24). Stimuli generation and equipment calibration was performed in accordance with ISO 389-8.25 The stimuli and the equipment arrangement were calibrated according to IEC 60318-126 and 60318-2,27 using a Brüel and Kjaer 2231 sound level meter with a 4134 microphone in a 4153 coupler (Brüel and Kjaer, Naerum, Denmark). The stimuli used were pulsed pure tones for the octave frequencies 0.125 to 8 kHz. The pure tones were gated on during 240 ms, including 20 ms rise and fall times with a 160 ms silent interval between presentations. Seventy-five presentations were used per frequency. The rate of the intensity change was 2.5 dB per second. The arithmetic mean of all reversals of the individual frequencies was used to calculate the hearing threshold at each frequency. A fast Fourier transform made on the acoustical output showed a total harmonic distortion for the complete system of less than 1 per cent.
Psychophysical tuning curves
The same equipment, equipment arrangement and calibration used for Békésy audiometry were used for recordings of psychophysical tuning curves. This method has also been previously described in detail elsewhere (see Brännström and GrennerReference Brännström and Grenner24, Reference Brännström and Grenner28). Psychophysical tuning curves were measured for the use of two 0.25 kHz probe tones presented at 10 dB sensation level (SL) during simultaneous narrowband noise presentation. These two probe tones were separated by 500 ms of silence and the length of each tone was 500 ms long, including 20 ms rise and fall times. The duration of the narrowband noises used was 3500 ms, including 20 ms rise and fall times. A single run consisted of the simultaneous presentation of narrowband noise and the two probe tones. Each run was followed by a 2400 ms silent interval before the next run. Seven narrowband noises were used, and the centre frequencies of the filters used to obtain these noises were 0.24, 0.43, 0.78, 0.92, 1.0, 1.08 and 1.23 times the probe tones (0.25 kHz).Reference Moore and Alcantara29 The width of the filters used was 20 per cent of the centre frequency of the filter or a maximum of 320 Hz .Reference Moore and Alcantara29 These stimuli were generated using Matlab 6.5 software. The slopes of each narrowband masker were verified by fast Fourier transform of the acoustic output and were found to be steeper than 28 dB/octave. A ‘6 dB up and 3 dB down’ procedure (two threshold passages) regulated the intensity of narrowband noise presentations. The subjects indicated by pressing a button if they detected both probe tones during the noise presentation.
Hypobaric pressure chamber
The hypobaric pressure chamber used was located in the ENT department of Malmö University Hospital, Sweden, at the same elevation as the test booth used for audiological tests. It had previously been used in research studies (e.g. Konrádsson et al.).Reference Konrádsson, Carlborg, Grenner and Tjernström3, Reference Konrádsson, Svensson, Carlborg and Grenner30 Subjects were placed in the hypobaric pressure chamber in an upright, seated position. Middle-ear pressure was monitored throughout pressure exposure by a probe (presenting a 0.226 kHz probe tone) placed in the outer ear canal of the affected ear.Reference Carlborg, Farmer and Carlborg31–Reference Carlborg, Konrádsson, Carlborg, Farmer and Densert33 Initially, subjects were instructed not to swallow, while the pressure in the chamber decreased relatively quickly (>10 daPa/second) until the middle-ear pressure exceeded the individual pressure opening level of the eustachian tube (this occurred in our subjects between 100 and >500 daPa). After this level was established, subsequent pressure exposures (during which subjects also were instructed not to swallow) were kept close to this level but slightly below, in order to avoid spontaneous opening of the eustachian tube. This level was maintained for five minutes (or until spontaneous eustachian tube opening). The pressure level was normalised again slowly (3–5 daPa/second), the subjects were instructed to swallow after the normalisation and the middle-ear pressure was measured again. If the subject's eustachian tube opened spontaneously, the level was normalised in the same manner. This procedure was repeated four to seven times, with a few minutes' rest at ambient pressure between hypobaric pressure exposures.
All subjects received an evaluation protocol approximately six weeks after their hypobaric pressure exposure. This evaluation assessed subjective changes in hearing, tinnitus, aural fullness and vertigo.
Statistical analysis
Spearman's rank correlation coefficient (ρ) was calculated to assess associations between each subject's tests. The paired-sample t-test was used to calculate significant differences, comparing assessment results before and after hypobaric pressure exposure. A p value of ≤0.05 was considered statistically significant.
Results and analysis
Tympanometry conducted after hypobaric pressure exposures showed middle-ear pressures to be within normal limits in the affected ear for all subjects (range −30 to 0 daPa).
Pure tone audiometric hearing thresholds
Low frequency PTA results improved after hypobaric pressure exposure in only one subject (subject seven) (two degrees of freedom, p < 0.05) and deteriorated in two subjects (subjects two and three) (two degrees of freedom, p < 0.05) (see Table I). No significant changes were seen in high frequency PTA results. Unfortunately, some data are missing for subject one, since this subject chose to leave the trial before their post-pressure PTA could be measured.
Speech recognition scores in noise
Following hypobaric pressure exposure, speech recognition scores in noise in the affected ear improved in six subjects (subjects three, five, six, seven, eight and nine), were unchanged in one (subject 10), and deteriorated in one (subject two) (see Table I). Subject four showed no speech recognition scores in noise either before (2 per cent) and after (0 per cent) exposure. Subject one's data for speech recognition score after pressure exposure are missing, for the same reason given above. On average, subjects' speech recognition scores in noise improved after hypobaric pressure exposure, but this difference was statistically significant only in the unaffected ear (before = 74 per cent, after = 67 per cent; eight degrees of freedom, p < 0.05) and not in the affected ear (before = 38 per cent, after = 48 per cent; eight degrees of freedom, p = 0.09).
Otoacoustic emissions
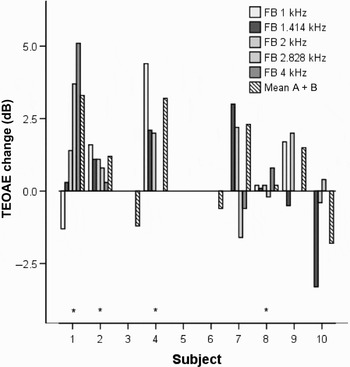
Individual TEOAE results for the affected ear are presented in Figure 1 as improvements in dB calculated from the emission strength (dB SPL). There are no data for subject five (after pressure exposure) due to database malfunction. Subjects three and six showed reproducible TEOAEs only for the whole tested frequency range (i.e. mean of buffers A and B) and not for single frequency bands. Significant improvements were seen for subjects one, two, eight (nine degrees of freedom, p < 0.01) and four (five degrees of freedom, p < 0.01).
Change in transient evoked otoacoustic emission (TEOAE) strength after hypobaric pressure exposure, at individual frequency bands (FBs) (one-third of an octave wide) and the full frequency range (taken as the mean of buffers A and B), for individual subjects. Asterisks denote statistically significant changes (p < 0.05).

Psychophysical tuning curves
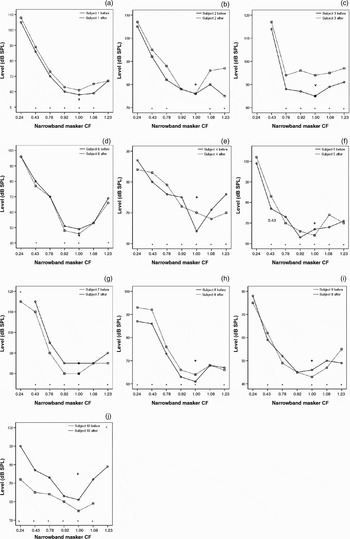
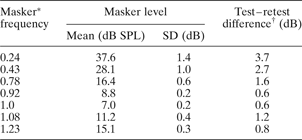
Results for individual psychophysical tuning curves, before and after hypobaric pressure exposure, are shown in Figure 2. Generally, poor frequency selectivity was observed among most subjects, both before and after hypobaric pressure exposure; Q10, a measure of frequency selectivity, could only be calculated in three cases before and in four cases after hypobaric pressure exposure. (This parameter was calculated by dividing the probe tone frequency by the bandwidth of the curve 10 dB above the tip of the tuning curve.)Reference van den Abeele, van de Heyning, Creten, Graff and Marquet34 Test–retest values for each narrowband masker condition were calculated from the mean results of all 10 subjects before and after exposure, according to the method of Arlinger et al. Reference Arlinger35 The test–retest values are presented in Table II, and significant deviations outside this interval are marked as asterisks in Figure 2.
Psychophysical tuning curves obtained in subjects' affected ear before (continuous line, circle plots) and after (broken line, square plots) hypobaric pressure exposure, using narrowband maskers with a centre frequency (CF) of 0.24, 0.43, 0.78, 0.92, 1.00, 1.08 and 1.23 times the 0.25 kHz probe tone. The level of the probe tone was 10 dB sensation level. Individual results for subjects one to 10 are shown as parts (a) to (j), respectively. * = Statistically significant changes (see Table II); += probe tone; V = probe tone if adjusted after exposure (only necessary in subjects 3 and 7); ^ = thresholds higher than measurable range (>120 dB SPL); SPL = sound pressure level

Psychophysical tuning curves test: significant test–retest differences for each narrowband masker

Data derived from average values for all 10 subjects, before and after hypobaric pressure exposure. *Values indicate multiplication factor applied to 0.25 kHz probe tone to derive narrowband masker centre frequency. †Standard deviation (SD) 1.4–1.96.
The individual results in Figure 2 may be classified according to their configurations. First, two subjects showed post-exposure psychophysical tuning curves that were altered in relative level but showed no change in shape (subjects one and six). Second, two subjects (two and nine) showed psychophysical tuning curves with an improved shape, i.e. higher levels at most narrowband maskers were seen, except at the frequency of the probe tone. Two subjects (five and seven) showed possibly improved psychophysical tuning curve shapes; the results for subject five suggested off-frequency listening before exposure and on-frequency listening after, but the similar change seen for subject seven was minimal. Third, two subjects showed psychophysical tuning curves with a deteriorated shape after exposure, i.e. increased masker levels at the frequency of the probe tone deleting a previous (non-dubious) tip of the tuning curve (subject three) or splitting it in two (subject four). Finally, two subjects (eight and 10) showed some change in the overall masker levels with possibly deteriorated psychophysical tuning curve shapes.
After equalising the sound pressure levels of the maskers of the individual subjects to the level of the probe tone (10 dB SL), the mean results for all subjects indicated a slight but significant improvement in psychophysical tuning curves after hypobaric pressure exposure (six degrees of freedom, p < 0.05). Improvement in this case means that increased intensities were noted at all masker frequencies except for the masker with the same centre frequency as the probe tone.
Subjective improvement
The recorded improvements were not associated with subjective improvement as reported in the follow-up questionnaire. Therefore, the measurement outcomes could not predict which subject would benefit subjectively from hypobaric pressure exposure.
Discussion
In the present report, the effects of hypobaric pressure exposure on hearing and frequency selectivity were studied in subjects with monaural, fluctuating, low-frequency hearing loss, such as that found in Ménière's disease. The results suggested only a small effect on hearing thresholds, if any. The results for individual subjects suggest variously improvement, no effect or deterioration in cochlear frequency selectivity, assessed as speech recognition scores in noise, TEOAEs and psychophysical tuning curves, before and after hypobaric pressure exposure. Subjects showing improvement in one test sometimes showed deterioration in another test.
Hypobaric pressure effects on hearing thresholds
Most subjects showed no change in PTA after hypobaric pressure exposure. Only one subject showed a significantly improved low frequency PTA, and two subjects showed significantly deteriorated low frequency PTAs (no significant changes were seen for high frequency PTAs). Pure tone average improvements have previously been reported (in about 50 per cent of subjects) after different types of pressure exposure (hypobaric pressure chamber or local application of overpressure in the ear canal) in subjects with Ménière's disease.Reference Konrádsson, Carlborg, Grenner and Tjernström3–Reference Kitahara, Kodama, Izukura and Ozawa5, Reference Densert8, Reference Larsen and Angelborg36 Konrádsson et al. Reference Konrádsson, Carlborg, Grenner and Tjernström3 also reported increasing PTA improvement with increasing maximum relative overpressure in the middle ear, obtained during pressure chamber exposure. No such association could be observed in the present study.
Notably, two subjects showed significantly deteriorated low frequency PTAs after hypobaric pressure exposure. Hypobaric pressure chamber exposure could cause both improvement and deterioration in endolymphatic hydrops, since reduction in inner-ear fluid volume may affect the mobility of the cochlear membranes differently, depending on whether a residual pressure gradient between the cochlear compartments is present or not. Long-standing distension of Reissner's membrane, causing decreased compliance, may be the cause of such a lasting rise in the pressure gradient.Reference Böhmer37 However, the matter is further complicated by the fact that distensions and ruptures of Reissner's membrane are known to occur (mostly apically) in endolymphatic hydrops.Reference Kimura, Vesterhauge, Katholm and Mikines1, Reference Xenellis, Linthicum, Webster and Lopez2, Reference Martini, Prosser and Luxon38 Furthermore, in the hydropic ear, the tectorial membrane may shrivel away and detach from the hair cells after such distension or rupture.Reference Schuknecht39, Reference Schuknecht, Igarashi and Pfaltz40 Both these latter histopathological events would greatly affect hearing sensitivity and frequency selectivity.
Hypobaric pressure effects on frequency selectivity
A small majority of the subjects showed improvements in speech recognition scores in noise after pressure exposure (subjects three, five, six, seven and nine). These improvements showed no association with any PTA improvements. This may suggest a possible influence of hypobaric pressure exposure on hearing which is unrelated to hearing thresholds. Changes in inner-ear pressure may affect the physiology of hearing, but this need not necessarily result in only hearing threshold improvements. Konrádsson et al. Reference Konrádsson, Carlborg, Grenner and Tjernström3 reported an inverse relationship between PTA and summating potential measured by electrocochleography in subjects with Ménière's disease after low pressure exposure in a hypobaric pressure chamber, suggesting the possibility of separate mechanisms contributing differently to hearing physiology. Although the observed differences in the present study were small, it could be suggested that these improved scores indicate the effect of improvements in the frequency selectivity of the inner ear. However, it could also be possible that we observed some kind of learning process resulting in higher scores after hypobaric pressure exposure, even though wordlists before and after exposure were randomly assigned.
• This study measured the effect of hypobaric pressure on the cochlear frequency selectivity of subjects with fluctuating, low-frequency hearing loss, such as occurs in Ménière's disease
• Frequency selectivity was assessed via psychophysical tuning curves, otoacoustic emissions and speech recognition scores in noise; these parameters improved in some subjects, deteriorated in others and showed no change in the remainder
• No associations were seen between test results; i.e. a subject showing an improvement in one test could show deterioration in another
• Test results could not predict which subjects benefited from hypobaric pressure exposure
• Study results indicated large individual differences; however, there was a clear effect of hypobaric pressure exposure on cochlear frequency selectivity in some subjects
In the present study, the outer hair cell function was assessed by TEOAE. The outer haircells probably improve the frequency selectivity of the cochlea by their active tuning of the basilar membrane.Reference Patuzzi, Dallos, Popper and Fay41 An increase in TEOAE strength after pressure exposure may thus indicate increased outer hair cell motility, possibly affecting frequency selectivity. After hypobaric pressure exposure, improvement in TEOAE strength was indeed seen in six subjects (one, two, four, seven, eight and nine). This improved motility may be explained by previous findings suggesting that pressure exposure probably creates a change in the hydrodynamic properties of the cochlea.Reference Densert8, Reference Ödkvist, Arlinger, Billermark, Densert, Lindholm and Wallqvist42, Reference Carlborg, Densert and Densert43 Increased fluid transportation probably decreases inner-ear pressure (and perhaps also results in a change in the ionic content of the endolymphatic fluid). One effect of reduced inner-ear fluid volume could be increased motility in the basilar membrane and its outer hair cells, seen in the present study as increased emission strength after exposure. Improved psychophysical tuning curves may possibly be explained in a similar manner. However, the present study found no association between improved psychophysical tuning curves and increased TEOAEs. Small but significant changes were observed in most subjects, but both improvements and deteriorations were seen. The two subjects with improved psychophysical tuning curve shapes (subjects two and nine) also showed TEOAE increases after exposure. However, the overall lack of congruence between TEOAE results and psychophysical tuning curve results is difficult to explain. Further research, possibly involving normal hearing subjects, is required to explore these findings.
Conclusions
The present study findings suggest that hypobaric pressure chamber exposure may result in improvement or deterioration in cochlear frequency selectivity, or neither, as measured by speech recognition scores in noise, TEOAEs and psychophysical tuning curves in subjects with monaural, fluctuating, low-frequency hearing loss, such as occurs in Ménière's disease. The observed effects were generally small and the results inconclusive. Since improvements in frequency selectivity were not accompanied by improvements in audiometric hearing thresholds, we suggest that pure tone audiography may be too insensitive a measure of inner-ear physiology when monitoring the effects of hypobaric pressure exposure.
Acknowledgements
Financial support for this research was received from the Hearing Foundation (The Swedish Association of Hard of Hearing People, Sweden), Lund University (grant ALF-05 governmental grant for clinical research), the Stinger Foundation for Audiological Research and the Swedish Society of Audiologists. The authors would like to thank Ann Reutherborg, who operated the hypobaric pressure chamber.