1 Introduction
A considerable amount of literature compares the relative cost efficiency of the public and private provision of publicly financed services, but most of these studies concern facilities and technical services. Classical studies generally concluded that private provision is more cost effective (Crain and Zardkoohi, Reference Crain and Zardkoohi1978; Bennett and Johnson, Reference Bennett and Johnson1979; Mueller, Reference Mueller2003: 373ff), but new research argues that private provision does not necessarily yield cost savings for all types of services. This suggests that more attention should be given to service characteristics and competition conditions (Boyne, Reference Boyne1998; Bel et al., Reference Bel, Fageda and Warnerd2009). In particular, few studies have been conducted regarding more advanced types of public core services. Therefore, we do not know for sure whether the cost efficiency of private and public provision differs for highly professional services in cases where providers have a high professional status and may be expected to substantially influence the level of expenditure. This paper not only compares expenditures for public and private provision of child dental care, but it also goes a step further and indirectly investigates the influence of professional and political actors on expenditures.
We study child dental care in Denmark for four reasons. First, private and public provisions coexist in the same setting. All Danish child dental care is publicly financed and organised by the municipalities, but some municipalities provide the services in public clinics with publicly employed dentists, whereas other municipalities purchase the services from private dental clinics. Second, dental care is a highly professionalised service, and the study thus contributes to close the above-mentioned gap in the literature concerning this service type. Third, we are able to put forward definite expectations concerning the spatial patterns in expenditures to be expected if professional and political actors influence the expenditures. Finally, social science on dental policy is rare, and it is a rather understudied area (some of the few studies are Grytten and Sørensen, Reference Grytten and Sørensen2000; Andersen and Blegvad, Reference Andersen and Blegvad2006; Chalkley et al., Reference Chalkley, Tilley, Young, Bonetti and Clarkson2010). Previous analyses have highlighted considerable variation between countries, across years and between municipalities in utilisation and expenditure, which will also be the subject of this paper (Andersen and Blegvad, Reference Andersen and Blegvad2006; Virtanen et al., Reference Virtanen, Berntsson, Lahelma, Kohler and Murtomaa2007; Kravitz and Treasure, Reference Kravitz and Treasure2009).
The theoretical framework is bounded rationality, meaning that we assume that the individuals intend to be rational but that their decisions rely on available procedures and solutions rather than on a comprehensive analysis (Simon, Reference Simon1945: 38ff; Jones, Reference Jones1999). Decision makers have limited capacity for handling a broad range of issues, and how they handle an issue depends on their knowledge regarding available solutions, which again depends on what type of information is present in their environment (Simon, Reference Simon1991: 125). Learning about techniques and processes by which to ‘improve’ policy is expected to occur in the decision makers’ networks (Bennett and Howlett, Reference Bennett and Howlett1992: 286), and many of these are spatially organised. We therefore expect geography to be important for the specific solutions that decision makers meet in their daily lives because they interact more with their neighbours than with decision makers from other parts of the country. The participating municipalities are expected to be more similar to each other than non-participating municipalities, particularly when decision makers meet in geographically delimited forums because decision makers exchange ideas and solutions in the forums.
In Denmark, private and public dentists belong to different professional organisations. In addition to meetings in the national organisations, private and public dentists also meet (separately) in local chapters of these professional organisations, which followed county borders at the time of investigation. At these meetings, we expect learning to occur, that is, processes by which networks learn from past experiences how better to achieve and implement their core beliefs (Bennett and Howlett, Reference Bennett and Howlett1992: 286). This implies that expenditures per child should be more similar for municipalities using public dentists within the same county and for municipalities using private dentists within the same county. In other words, if dentists determine the expenditure level, the combination of their identical ownership status and their being in the same county is expected to lead to similarities in expenditures. Learning can also occur for politicians, and we expect this learning to be especially pronounced for politicians sharing the same party affiliation. This leads us to expect similarities in expenditures between neighbouring municipalities with mayors sharing the same party affiliation. Finally, performance comparisons and welfare migration to neighbouring municipalities can also lead to spatial spillover between neighbouring municipalities, regardless of the ownership status of dentists and the party affiliation of the mayor. The core question is thus whether similarities in expenditures for child dental care are between (1) municipalities in the same county with a similar dental ownership status, (2) neighbouring municipalities with mayors sharing a party affiliation or (3) neighbouring municipalities regardless of party affiliation and dental ownership status.
The paper compares municipalities with privately and publicly produced dental care and it studies four types of spatial patterns in expenditure levels across municipalities. First, it investigates whether expenditures are more alike in geographically neighbouring municipalities. Second, it investigates whether the spatial clustering followed county borders and (third) whether this clustering only is present for municipalities with the same mode of production (public/private). This is relevant because private and public dentists have separate local chapters of their professional organisations. Fourth, we investigate whether spatial clustering especially influences child dental expenditure between municipalities with mayors who have the same party affiliation as the mayors from neighbouring municipalities.
The results point to differences in expenditure between municipalities with privately and publicly produced dental care, with public provision being the most costly. Furthermore, when compared with politicians, dentists seem to influence the expenditure level through spatial spillover effects, and spatial spillover effects are especially strong for neighbouring municipalities using private dental clinics. There is no evidence of specific spatial spillover effects between neighbouring municipalities with mayors sharing a party affiliation. The spatial spillover effects are generally weaker than expected, suggesting up to 17% spillover between municipalities. This involves, ceteris paribus, that an increase of 100 Danish kroner (DKK) in the expenditure of a municipality for child dental care increases the expenditure of its neighbours by up to 17 DKK.
The structure of the paper is as follows. First, we discuss the theoretical expectations concerning the institutions, actors and spatial mechanisms. Then, as a result of this discussion, we put forward four hypotheses. The description of the data used is followed by a discussion of the methodology and a presentation of the results. The paper concludes with a discussion of the main findings and their implications.
2 Institutions, actors and spatial mechanisms
Given that we assume bounded rationality, learning is expected to be important. The theory of bounded rationality asserts that decision makers are goal oriented and adaptive but that their rational adaptation is limited due to their cognitive and emotional architecture (Jones, Reference Jones1999: 297). More specifically, decision makers rely on available solutions rather than comprehensive analysis (Simon, Reference Simon1945: 38ff), and learning is about getting to know new solutions. In order to form specific expectations concerning how professional and political actors learn new solutions, this section discusses the relevant institutions governing Danish dental care. This is followed by a discussion of the most powerful actors in relation to child dental care: dentists and local politicians. Finally, we identify the expected implications of the theory in terms of spatial mechanisms.
In Denmark, the municipalities are responsible for delivering child dental care, which is free of charge for users. During the investigated period, the municipalities had a choice between two types of provision: employing dentists in public clinics or buying the services from private dental clinics. The mode of provision was stable until the municipal reform in 2007 (which occurred after our investigation). Very few municipalities shifted their modes of provision between 1980 and 2001. Neither the private nor public provision of dental care involved price competition between dental clinics in the period studied, as collective agreements specified both the salaries of the publicly employed dentists and the fees for particular services provided by the private dentists (Andersen and Blegvad, Reference Andersen and Blegvad2006). Since January 2004, beyond the study period of the present study, children have been able to opt out of public provision in municipalities with this mode of provision, but with a co-payment 35% of the costs (Kravitz and Treasure, Reference Kravitz and Treasure2009). Few have, however, used this opportunity and therefore it has not been a major competitive element. The Danish National Board of Health has regulated the provision with quite detailed rules for which dental services must be offered to children.
Public dentists received fixed monthly salaries and the private dentists received fees that combined fee-per-service and fee-per-capita. The budgetary power was in the hands of the municipal majority; these politicians could grant more or less money to dental care, thus affecting expenditures and the level of service. Information about both expenditures and service was available for politicians and citizens, and although the access was not easy, comparisons were regularly made.
Dentists are the most important group of providers because they have the right to instruct other dental workers. They are professionals (Freidson, Reference Freidson2001), and their specialised and theoretical knowledge combined with their professional status have made them potentially powerful players in the game of dental expenditure. However, for the period of this study, they were divided into public and private dentists, who, in the time frame of this study, were almost archenemies (Andersen, Reference Andersen2004). According to interviews with dentists from both sectors (Andersen, Reference Andersen2005), one of their main interests was to keep the services in their own sector (private/public) by delivering better and/or less expensive services than those under the other ownership form. Importantly, the major part of the interaction between dentists occurred among the groups of private and public dentists. They do, in other words, belong to different networks, and their learning is accordingly expected to differ (Bennett and Howlett, Reference Bennett and Howlett1992). A so-called dental consultant (a private dentist with this special assignment) coordinated different matters among private dentists in a specified area. In the investigated period (before the municipality reform in 2007), much of the interaction within the groups of private and public dentists followed county borders because their respective professional associations were comprised of county-based subunits.
Politicians in the municipalities are also important for dental expenditure, as they have budgetary control. Among other things, politicians are expected to try to increase their number of votes (Downs, Reference Downs1957; Strøm, Reference Strøm1990). It is therefore important to appear to be delivering high-quality, low-cost services – especially for incumbents. Politicians in one municipality may be affected by the expenditure levels of surrounding municipalities, as they believe that their ranking on benefit indicators affects their re-election chances. This is a kind of (yardstick) competition, where politicians within municipalities care about the actions of neighbouring municipalities because they think that voters choose whether or not to re-elect them using performance comparisons (e.g., expenditure levels; Case et al., Reference Case, Rosen and Hines1993; Besley and Case, Reference Besley and Case1995, Reference Besley and Case2000; Costa-Font and Pons-Novell, Reference Costa-Font and Pons-Novell2007). Along these lines, welfare migration may also lead to geographical spillover because of the strategic interactions among municipalities, where politicians compete to attract families with children through the level of service benefits provided in the municipality. This phenomenon will tend to increase expenditure level in one municipality when surrounding municipalities increase their expenditure levels (Brueckner, Reference Brueckner2000). These spatial spillover effects can theoretically be argued to have both positive and negative effects on the expenditure level in surrounding municipalities because service levels and tax levels factor into migration decisions. However, both types of competition imply that expenditures are more alike in geographically neighbouring municipalities than in geographically distant municipalities (as expressed in Hypothesis 1).
Hypothesis 1: Spatial clustering influences child dental expenditure between geographically neighbouring municipalities.
Hypothesis 1 does, however, disregard influences of dentists. Because variations in dentists’ learning (concerning how to deliver services efficiently) followed county borders (because the interaction between dentists followed county divisions in addition to the interaction in the national professional organisations of public and private dentists), expenditures are expected to be more alike within the same county (Hypothesis 2).
Hypothesis 2: Spatial clustering influences municipalities’ child dental expenditure within the same county.
However, the interaction between dentists was split between private and public dentists because of the existence of two professional organisations, one for private dentists and another for public dentists. As both were organised along county borders at the time of investigation, this implies that expenditures should be the same between municipalities within the same county, but only if the ownership form of dental care provision is similar, as expressed in Hypothesis 3.
Hypothesis 3: Spatial clustering influences expenditure for child dental care between municipalities within the same county with the same ownership form for dental care.
Learning can also occur among politicians, and in this context, it is relevant to differentiate between parties when discussing relevant networks. Assuming that politicians from the same party (but from different municipalities) interact more than politicians from different parties (from different municipalities), we expect learning to primarily occur in the interaction with other politicians from the same party; they meet regularly and share the same ideological ideas. On the basis of an assumption that mayors are the most important political players in the municipalities (Berg and Kjær, Reference Berg and Kjær2005), Hypothesis 4 expects the spatial clustering to relate to neighbouring municipalities with mayors sharing the same party affiliation.
Hypothesis 4: Spatial clustering influences child dental expenditure between municipalities with mayors who have the same party affiliation as the mayors from neighbouring municipalities.
How these hypotheses are tested is discussed in the next next sections. The first describes the data sources, whereas the second, methodology section, discusses the regression models more technically.
3 Data
The hypotheses are tested using data from 1996 to 2001. A total of 275 Danish municipalities existed in this period, but excluding municipalities missing data on one or more variables left 226 municipalities, forming a balanced panel data set. Of the investigated municipalities, 165 had publicly provided dental care, whereas the remaining 61 purchased child dental services from private clinics. Data on the dependent variable, that is, expenditure for dental care per child adjusted for inflation to 1996 prices, are collected using official expenditure statistics from Statistics Denmark adjusted for differences in accounting practices across municipalities as collected by direct inquires to all municipalities. Additional data were collected from The Key Figure Database at the Ministry of the Interior and Health and The Statistical Bank at Statistics Denmark.
Apart from the spatial variables (i.e. county and geographical distance), the primary explanatory variables are the ownership of the providers and the political environment in the municipality. The ownership of the providers is a dummy variable separating municipalities using private service provision and municipalities providing child dental care in publicly owned and managed clinics. To account for the economics of scale inherent in public clinics, an interaction term between the mode of provision and the number of users in the municipality is applied. The political affiliation of the mayor is used as a proxy for the political environment in the municipality, reflecting the preferences of the majority on financing, expenditure level and provision of dental care.
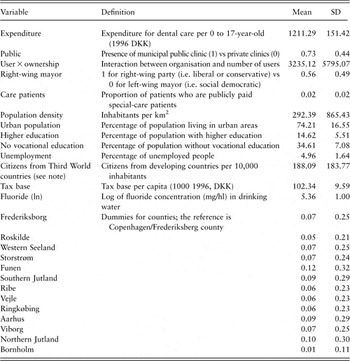
The remaining variables are confounding variables expected to influence expenditures together with a number of socio-demographic variables, including education, unemployment and the percentage of citizens from Third World Countries. These socio-demographic variables have proven in other studies to influence dental health, see for example, Christensen et al. (Reference Christensen, Twetman and Sundby2010). This insures that the spatial patterns are not due to common random shocks (Case et al., Reference Case, Rosen and Hines1993; Revelli, Reference Revelli2001, Reference Revelli2002). The concentration of fluoride in the municipality drinking water is included to adjust for the documented effect of fluoride concentration on dental health (Maupome et al., Reference Maupome, Gullion, Peters and Little2007). County dummy effects, beyond the specific spatial spillover effects investigated, are included to control for other unobserved factors influencing the expenditure levels (Table 1).
Description of data

DKK = Danish kroner.
Note: n = 226, T = 6, T×n = 1356. A few mayors from unpolitical lists were classified as right-wing or left-wing according to majority orientation. Third World countries are countries outside Europe, North America, Australia and New Zealand.
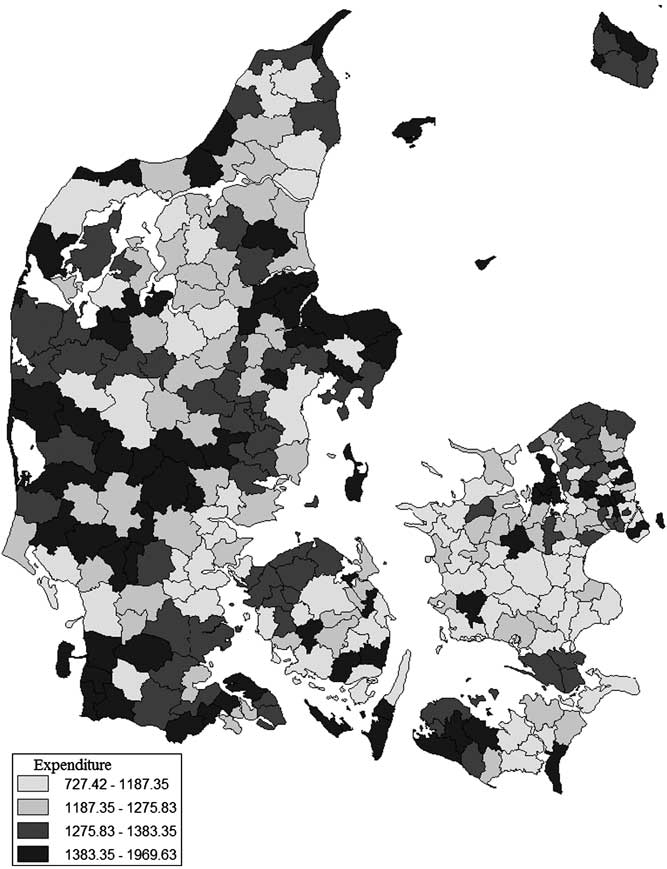
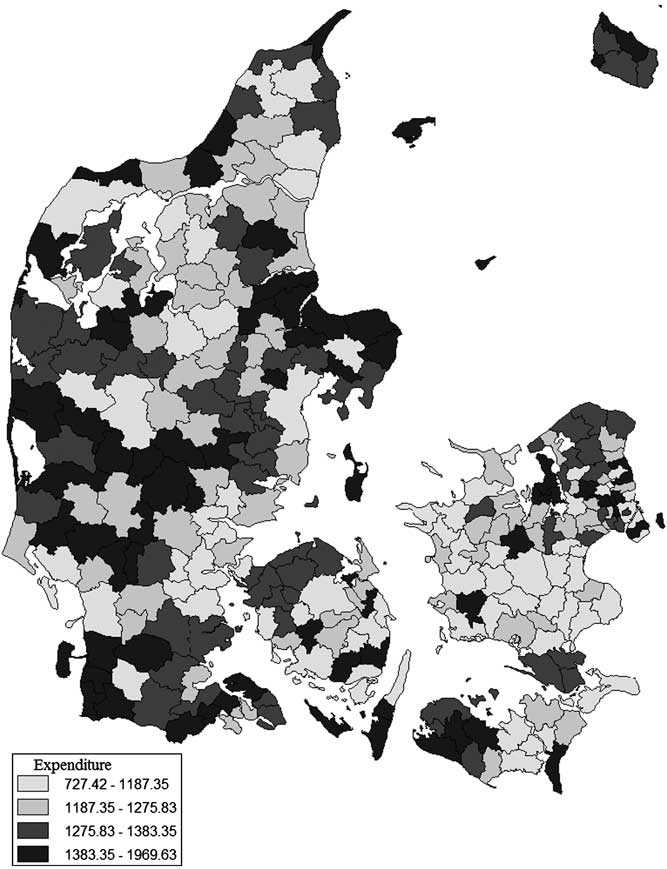
A more comprehensive description of the data can be found in Andersen and Blegvad (Reference Andersen and Blegvad2006). Figure 1 shows the spatial distribution of municipal child dental care expenditures per child.
Expenditure for dental care per 0 to 17-year-old (Danish kroner, average 1996–2001).
4 Methodology
The point of departure is a linear regression model that relates dental care expenditure per child in year t in municipality i linearly to the determinants. Initially assuming a cross-section of n = 226 municipalities observed for year t, this linear specification reads as

where Xt is an n × K-dimensional matrix of explanatory variables, yt is an n-dimensional vector of expenditure per child, β is a K-dimensional coefficient vector and υt is an n-dimensional vector error term. Applying pooled data for T = 6 years leads to six equations, one for each year. The residuals of the T equations are generally inter-correlated, and the variances for the cross-sections vary across years. Between any two years, the residual covariance reads as

The model defined by equations (1) and (2) is estimated efficiently by applying the seemingly unrelated regression (SUR) estimation (Anselin, Reference Anselin1988).
To initially make the concept of spatial spillover operational in a one-year model, a common approach in spatial econometrics is to specify an n × n matrix W such that wij equals the reciprocal of the distance between municipalities i and j. Then, the product Wyt defines a variable, which for each municipality holds the average of the expenditure for all other municipalities, weighted by the distance to these, such that close municipalities obtain relatively large weights. The endogenous spatial spillover is captured by a spatially autoregressive (SAR) specification of the form (Anselin, Reference Anselin1988):

where λ is a parameter specifying the degree of spillover, formally restricted to the interval between (−1) and (+1), but for most practical purposes is simply restricted to be non-negative. An alternative approach commonly applied is to jointly account for (observed as well as unobserved) endogenous and exogenous spatial spillover by applying the spatially autocorrelated (SAC) specification (Anselin, Reference Anselin1988):

Estimates of parameters accounting simultaneously for endogenous spatial spillover inter-correlation and heterogeneity are obtained using the following pseudo-maximum likelihood approach to obtain a SAR–SUR specification: First, we carried out a grid search of the relevant values of λ from −1 to +1. Conditioned on each λ, the SUR procedure was then performed using (I−λW)yt, instead of yt. Finally, the set of results that maximised the log-likelihood function (Anselin, Reference Anselin1988) was selected. For the case of a SAC–SUR, efficient estimation results may be obtained using a similar procedure (with the additional replacement of Xt with (I−λW)Xt).
To provide means for comparison of alternative models, some quantities are applied. One is a pseudo-R-square (R 2), calculated as the square of the correlation between y and its predicted values. This measure is readily calculated for the SUR and the SAC–SUR models, but is not defined for the SAR–SUR specification. A second device applied is the familiar Akaike Information Criterion. Finally, nested models are tested against each other using the likelihood ratio (LR) test, calculated as twice the difference between the values of the log likelihoods of the two models.
4.1 Specifying the weighting matrix to test the four hypotheses
Estimation of models testing the four hypotheses will be performed with different specifications of the weighting matrix W. For Hypothesis 1, the weighting matrix W takes the value dij (wij = dij) for any two municipalities i and j, where dij is the reciprocal distance between these municipalities. For Hypothesis 2, the geographical proximity is extended, and the weighting matrix W takes the value dij (wij = dij) if municipality i is located in the same county as municipality j and the value 0 otherwise.
For Hypothesis 3, as the spillover among providers is considered to be independent of distance and affected only by the location of providers being in the same county, the weighting matrix W takes the value 1 (wij = 1) if municipality i is located in the same county and has the same ownership of providers (public or private) as municipality j and the value 0 otherwise. Hypothesis 3 captures the average spatial spillover effect from both types of ownerships, and because the spatial spillover effect may differ between the two modes of ownership, Hypothesis 3 test the spatial spillover effects for private and public ownership, respectively. As an illustration, the weighting matrix W in Hypothesis 3a takes the value 1 (wij = 1) if municipality i is located in the same county as municipality j and employs the private ownership of providers, and the value 0 otherwise.
For Hypothesis 4, the weighting matrix W takes the value dij (wij = dij) if municipality i is located in the same county and has a mayor with the same party affiliation (left or right wing) as in municipality j and the value 0 otherwise. Similar to Hypothesis 3, Hypothesis 4 is split into two sub-hypotheses, where the spatial spillover effects are investigated for the left and the right wing, respectively, with the same type of specification of the weighting matrix.
5 Results
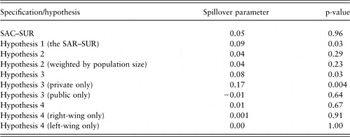
As basic models, the ordinary least squares (OLS) and SUR models were estimated (cf. Table 3 below). Because each of the hypotheses above regarding the nature of spillover effects gave rise to a new model, it was decided to present full results for these models where a significant spillover parameter was found. A summary of the spillover parameters and their significance is presented in Table 2.
Estimated spillover parameters from different specifications and hypotheses

SAC = spatially autocorrelated; SUR = seemingly unrelated regression; SAR = spatially autoregressive.
It can be observed that the SAC–SUR specification gave rise to an insignificant spillover parameter. Likewise, several hypotheses led to insignificant spillover parameters. Only Hypotheses 1 (the SAR–SUR), 3 and 3a (private only) turned out to have significant spillover.
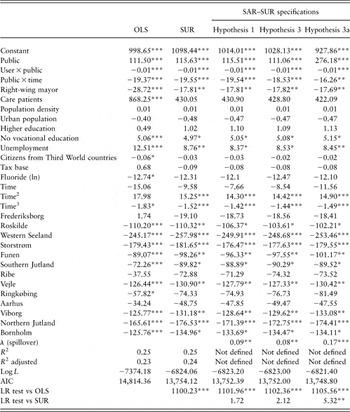
Table 3 presents results from the OLS and SUR specification for basic comparisons of the spatial specifications. Furthermore, spatial SAR–SUR specifications testing Hypotheses 1, 3 and 3a (private only) are reported. Across all specifications, municipalities with public clinics have higher expenditures compared with municipalities buying children dental care from private clinics (cf. public). However, the difference significantly decreases with time (cf. public × time). Municipalities with right-wing mayors have significantly lower expenditures (cf. right-wing mayor) and this effect holds for all specifications, but the magnitude of the effect decreases significantly when panel and spatial effects are accounted for.
Regression models for expenditure for dental care per 0 to 17 years old

SAR = spatially autoregressive; SUR = seemingly unrelated regression; OLS = ordinary least squares; LR = likelihood ratio; AIC = Akaike Information Criterion.
Notes: n = 226, T = 6, T×n = 1356. Significance indicated by *** (1%), ** (5%) and * (10%).
Time2 and Time3 are time raised to second and third degree respectively.
Most of the socio-demographic variables become insignificant when heterogeneity and spatial effects are accounted for. The share of citizens with no vocational education and the unemployment rate remain significant in all specifications.
The LR test of the model specifications show that the SUR is a significant improvement of model fit, whereas only with Hypothesis 3a does using the SAR–SUR specification improve model fit over the SUR specification.
6 Discussion and conclusions
This paper has conducted two investigations. It has compared expenditures of the public and private provision of a highly professional service (child dental care) and investigated the influence of professional and political actors on the expenditures by studying spatial patterns. The first main finding is that expenditures are higher in municipalities using public clinics than in municipalities that purchase services from private clinics. This finding indicates that ownership may have the same effect on professional welfare services as for highly technical services, but it should be noted that the difference decreases over time, emphasising the need to pay attention to service characteristics and the specific circumstances of the service provision.
The second main finding is that spatial clustering influences child dental care expenditures between municipalities within the same county for private dentists. We did, as mentioned, study four types of spatial patterns: (1) between geographically neighbouring municipalities, (2) between municipalities within the same county, (3) between municipalities within the same country and with the same mode of production (public/private) and (4) between municipalities with mayors who have the same party affiliation as the mayors from neighbouring municipalities. In addition to spatial clustering between geographically neighbouring municipalities, we also found the spatial pattern associated with the dental organisation to be statistically significant. This is compatible with the idea of policy diffusion through interaction between dentists. This indicates that the learning effect across municipalities associated with dentist learning is the predominant type of spatial spillover effect on the expenditure for child dental care services. In contrast, we found no spatial spillover effects across municipalities associated with politicians. Professionals, rather than politicians, therefore seem from our indirect test to be the central actors affecting this type of service.
The actor assumption used was bounded rationality, and it is worth discussing whether this assumption was fruitful or realistic. The fact that we found spatial clustering relating to both general geographical proximity and decision makers’ participation in a forum limited to county borders (for the private dentists) indicates that knowledge about available solutions depends on the information present in the decision makers’ environment. This result speaks in favour of the realism of the assumption, but the evidence is not unambiguous. We did not find indications of spatial effects relating to the political affiliation of the mayor. It is difficult to know whether this was due to professional dominance or because the politicians do not depend on information from this specification of their environment. Nevertheless, although spatial spillover was found to be less important in dental care than in similar studies of health service behaviour (Bech and Lauridsen, Reference Bech and Lauridsen2008, Reference Bech and Lauridsen2009), it has a noteworthy effect on expenditures. An average increase in dental expenditures in neighbouring municipalities of, say, 100 DKK is connected to an increase in a municipality's dental care expenditure of up to 17 DKK. These significant spillover effects, combined with the fact that the specific effects can be meaningfully linked to the learning processes of central actors, indicate that it can be fruitful to assume bounded rationality. In this paper, this approach has enabled us to indirectly investigate the influence of professional and political actors on expenditure by studying the spatial patterns.
Analysing the influence of professional and political actors in relation to expenditures by looking at the spatial patterns has, to our knowledge, not previously been carried out in the literature, and a central contribution of the paper therefore relates to the methodology. The SUR adjustment for panel effects in the form of heterogeneity and temporal dependency across years represents substantial improvements of model fit when analysing the determinants for municipal child dental care expenditures, and leads to substantial changes regarding interpretation. The simple OLS approach ignores this aspect and thus leads to a serious overestimation of the effects of several important determinants. These potential spatial interactions could explain patterns of expenditure and at the extreme variables that are unrelated apart from being independently spatially clustered may in such cases appear to be significantly related. A central methodological contribution of the paper is the illustration of the importance of adjusting for spatial patterns and the potential to use the spatial patterns to shed light on substantial issues such as the power relations between different actors. It is not surprising that the model fitting improves substantially when adjusting for dependency across years. Indeed, one would expect the policy of one year (as measured by municipal child dental care expenditures), to be largely incremental to the previous years’ policy. Neither is it surprising that, when adjusting for this incremental nature of the utilisation policy, the effects of several determinants are reduced or disappear completely.
The three most important implications of the paper relate to methodology and the choice of ownership form. First, the paper strongly implies that analyses of local expenditures ought to take the spatial mechanisms seriously, and more specifically, use statistical tools such as SUR adjustments. Second, spatial mechanisms are more than just something to control for. By exploring spatial patterns of expenditure across jurisdictions, new substantial insights are obtained. This leads to the third implication. For highly professional services, the decision to shift to private provision should ideally also depend on the learning network of the relevant private professionals. If expenditures are high in this (typically geographically delimited) network, this paper suggests that private provision in the relevant municipality will also be high due to spillover effects.