1. Introduction
In 2020, cancer incidence reached over 1.6 million new cases and mortalities topped 602 thousand (CDC, 2023). The contribution to this disease burden from environmental and occupational exposure to toxic substances is increasingly the target of government regulation. For example, in 2016, the Frank R. Lautenberg Chemical Safety for the 21st Century Act amended the Toxic Substances Control Act (TSCA). Among other updates to TSCA, the new law created a mandatory requirement that the U.S. Environmental Protection Agency (EPA) conduct risk-based chemical assessments of existing chemicals to determine whether they pose an unreasonable risk and take regulatory action upon a positive finding. Recent regulations proposed under authority of TSCA include restrictions on consumer and occupational use of chemicals including formaldehyde, methylene chloride, asbestos, trichloroethylene, and perchloroethylene, which collectively have been linked to development of cancers, including liver, lung, kidney, laryngeal and nasopharyngeal, ovarian, testis, brain, mesothelioma, and Non-Hodgkin lymphoma.Footnote 1 Numerous other proposed and finalized EPA regulations have targeted environmental exposures to carcinogenic substances including per- and polyfluoroalkyl substances (PFAS) in drinking water, ethylene oxide in airborne pollution and pesticides, and air toxics in the transportation sector.
Regulatory agencies must evaluate the costs and benefits of significant regulations and their regulatory alternatives, as required by Executive Order 12866. A general approach to estimating the benefits of a regulation that reduces carcinogen exposure may involve determining the size and characteristics of the exposed population, characterizing exposure patterns among the exposed individuals, developing a dose–response relationship, assigning a value to the benefit of avoided cancer risk, and appropriately discounting this value from the time when the avoided risk is realized back to the present time of avoided exposure.
The valuation of avoided cancer risk in particular has been the subject of much study in the health and environmental economics fields. Standard practice among regulatory agencies is to apply the value of a statistical life (VSL) to avoided mortality risks. However, there has been discussion among economists regarding the specific case of valuing cancer risk, such as whether there is a cancer premium for a VSL derived from labor market studies (e.g. Alberini & Scasny, Reference Alberini and Scasny2010; Science Advisory Board (SAB), 2017; SAB, 2011; Viscusi et al., Reference Viscusi, Huber and Bell2014), whether risk reduction valuations vary for different cancer types and attributes (e.g. Alberini & Scasny, Reference Alberini and Scasny2018; Alberini et al., Reference Alberini, Rheinberger and Ščasný2023; Cameron & DeShazo, Reference Cameron and DeShazo2013; Hammitt & Liu, Reference Hammitt and Liu2004), how to appropriately value cancer morbidity (e.g. Cameron, Reference Cameron2014; SAB, 2024), and whether valuations are dependent on latency period (e.g. Hammitt & Liu, Reference Hammitt and Liu2004; McDonald et al., Reference McDonald, Chilton, Chilton, Jones-Lee and Metcalf2016; Rowell, Reference Rowell2010; SAB, 2001; Van Houtven et al., Reference Van Houtven, Sullivan and Dockins2008).
The primary focus of this paper is how to reasonably account for the lag between when exposure to a toxin is reduced and when benefits are realized due to avoided cancer incidence and avoided mortality at some future point in time. This question is relevant because the benefit of avoided morbidity and/or mortality does not occur instantly once exposure is reduced. As Revesz (Reference Revesz1999) notes, ideally researchers could determine society’s willingness-to-pay (WTP) to avoid a latent carcinogenic harm, but given analytical challenges in obtaining such a value, economists instead typically estimate the value of a future mortality risk reduction in relation to the value of a mortality risk reduction today. It is standard practice among regulatory agencies to discount future health benefits. The White House Office of Management and Budget (OMB) Circular A-4 guidance (OMB, 2023a), OMB’s Circular A-94 Guidance (OMB, 2023b), EPA’s Guidelines for Preparing Economic Analyses (EPA, 2014), and the U.S. Department of Health and Human Services (HHS) Guidelines for Regulatory Impact Analysis (HHS, 2016) all state that future health benefits should be discounted.
The timing between avoided exposures and reduced cancer risks is generally defined as either latency or cessation lag, depending on the nature of the avoided exposure (EPA, 2014; HHS, 2016). Latency is defined as the period of time between exposure to a carcinogen and a resulting increased risk for disease. Cessation lag is defined as a lag between the reduction of an existing exposure and the resulting reduction in risk for disease.
These two time periods are not necessarily the same. As recommended by EPA’s SAB (2001), cessation lag is the relevant time period when considering populations with existing exposures before a policy to reduce exposures takes effect. Alternatively, latency would be the relevant time period for populations who would never be exposed if the policy being considered goes into effect. Because both types of populations may benefit from a policy that reduces exposures, the ideal approach would be to account for both the latency and the cessation lag by modeling the timing between the cumulative exposures experienced and the avoided risks for adverse health effects under different scenarios. However, in most cases, such detailed information is not available.
In order for benefits estimates to be comparable to costs in a benefit–cost analysis, the estimated values for avoiding cancer risks should be discounted back to the time when costs for avoiding the risks would be incurred. This is generally the time when exposures would have otherwise occurred and increased cancer risks. Thus, a critical step in such an analysis is to determine how much time elapses between these avoided exposures and the avoided cancer diagnoses. In addition, fatal cancer risks should be discounted from the time of death to the time at exposure. Thus, the analysis should also estimate how much time elapses between cancer diagnoses and any resulting deaths.
The primary purpose of this paper is to construct a standardized approach that accounts for the timing between the reduction in carcinogen exposure following implementation of a new policy, the subsequent reduction in cancer risk, and any resulting fatalities. Ideally the estimates for latency and cessation lag would come from well-designed high-quality studies. However, the available data and literature on this topic are very limited, with no information at all for many cancer sites and carcinogens. Thus, our goal was to design an approach for accounting for this timing between exposure and cancer risk reduction when sufficient data are not available in the literature. Our approach has been used in several EPA economic analyses (see EPA, 2013, 2016, 2017, 2019 and Abt Associates, 2022) and is also the primary method used to estimate the lag between exposure and diagnosis for non-fatal lung cancer in EPA’s (2023) BenMAP model, which was recently reviewed in the SAB (2024) Review of BenMAP and Benefits Methods.Footnote 2
Our approach establishes distributions for the lag between exposure and diagnosis by cancer site, sex, and age at exposure based on age-, sex-, and site-specific cancer incidence distributions starting a minimum number of years after the exposure reduction (see Section 2.4 for a discussion of the minimum lag periods we selected). These age-, sex-, and site-specific cancer incidence distributions reflect cancer diagnoses from all causes. We apply this approach to sex–age distributions for 21 different U.S. populations. This allows our approach to be used to estimate monetized values for achieving small reductions in the risks for many common specific types of cancer in benefit–cost analyses of regulatory and non-regulatory policies that reduce carcinogen exposures in different U.S. populations (e.g. the manufacturing sector, the general population). In Appendix A, we compare the results using our approach with the limited literature on latency between exposure and cancer incidence to evaluate whether our approach is reasonably consistent with empirical estimates of cancer latency and cessation lag.
Our estimates for the value of reduced cancer risk are provided in our supplementary spreadsheets.Footnote 3 We provide values for 108 different cancer sites, 21 different populations, and any number of desired discount rates. Furthermore, our estimates for the value of a cancer risk reduction have two separate components: (a) reducing the risk of dying from the cancer and (b) reducing the risk of being diagnosed with cancer without dying from it. Hereafter, we refer to the first outcome as fatal and the second as non-fatal. While we provide default estimates for the WTP to avoid non-fatal and fatal cancer risks based on a review of the literature, recommending specific WTP values for each cancer site and population is beyond the scope of this paper. Thus, we provide our results separately for fatal and non-fatal risks, so that results using different WTP values can be easily calculated.
2. Approach for estimating monetized value of avoiding cancer risks
Our approach for estimating monetized values of avoiding cancer risks is summarized as follows:
-
1. Select undiscounted values for avoiding fatal and non-fatal cancer risks
-
2. Weight and discount the undiscounted values from Step 1 back to the time of avoided exposure (the time to which we discount the future risk reduction values for the purpose of this analysis) as follows:
-
a. Estimate the timing between exposure and diagnosis
-
b. Estimate the probability that the cancer is either fatal or non-fatal
-
c. In the case of fatal cancer, estimate the timing between diagnosis and death
-
d. Discount values back to time at exposure
-
We describe these steps in more detail in the sections that follow.
2.1. Cancer sites considered
Our analysis utilizes data from the National Cancer Institute (NCI)’s Surveillance, Epidemiology, and End Results (SEER) Program and is based on data retrieved from NCI’s SEER*Stat software,Footnote 4 including all sites in SEER*Stat’s Site Recode ICD-O-3/WHO 2008 variable (many of the most common cancer sites). We also include five selected sites from SEER*Stat’s “Primary Site” variable and two custom sites selected because they are cancer risks expected to be addressed by upcoming U.S. EPA risk management actions under the TSCA.
2.2. Populations considered
The time between exposure and diagnosis depends on the sex and age of the exposed individuals. In turn, the age at diagnosis affects the probability that the cancer is fatal and the timing between diagnosis and death. Incorporating these variations in timing and probabilities results in estimated values for reducing cancer risks specific to the age and sex makeup of the population affected.Footnote 5 We estimate results for several different populations of individuals that might be considered in a benefits analysis. Since many reductions in exposures will be from reduced occupational exposures, we calculate separate estimates for each of the 14 major occupational codes in the U.S. Bureau of Labor Statistics’ Current Population Survey (U.S. Census Bureau, 2014–2023). In addition to these 14 industry-specific populations, we also included estimates for all employed individuals combined, the entire population, the entire adult population, and four child populations (individuals under the age of 18, under the age of 2, ages 2–15, and ages 16–17).
2.3. Undiscounted values used in the analysis
Our estimates for the value of reduced cancer risk provided in supplementary spreadsheets populate default values for the WTP to avoid fatal and non-fatal cancer risks based on EPA’s recommended VSL and our review of the literature on the value of non-fatal cancer risk (see Appendix C). The estimated value for a case of fatal cancer is the value of mortality risk (VMR). The VMR represents the value of reducing the risk of premature death by 1/1,000,000, also referred to as a micro-risk reduction. We use a default VMR of $13.71 (2023$), which is estimated using EPA’s (2014) recommended VSL of $4.8 million in 1990 dollars, adjusted for income growth and inflation.Footnote 6 EPA’s recommended value is consistent with other VSL estimates (e.g. HHS, 2021; U.S. Department of Transportation (DOT), 2024; Viscusi, Reference Viscusi2018).
Our default undiscounted values for a case of non-fatal cancer are based on a literature review on the WTP for avoiding non-fatal cancer risk (Appendix C). Like the VMR estimate, the non-fatal risk values are adjusted for income growth and inflation. The non-fatal risk values may differ by the cancer end point of interest, reflecting differences in treatment costs, pain and suffering associated with treatment, productivity losses during treatment, and any other adverse consequences related to contraction of a non-fatal case of cancer.
While we provide default values in our supplemental spreadsheets, we recognize that these are not a comprehensive set of values that will be appropriate for all analyses (see discussion in Appendix C). Therefore, we disaggregate our results by the fatal and non-fatal components so that an analyst may input different undiscounted values as desired.
2.4. Estimate the timing between exposure and diagnosis
Data from high-quality studies specifically examining the timing between a reduction in carcinogen exposure and reduced cancer risk would be the preferred source to estimate the timing between exposure and diagnosis. If information is available about the mechanism by which cancer occurs, it is possible to use models of cancer formation to estimate the length of cessation lags (e.g. see Appendix 2.1 of SAB, 2001). However, one shortcoming of using cancer formation models to estimate latency or cessation lag is that they only include the time between malignant conversion and clinical manifestation or detection. Cancer formation models do not account for the induction period, the time between exposure and malignant conversion, which Hicks et al. (Reference Hicks, Kaye, Azoulay, Bruun Kristensen, Habel and Pottegård2023) notes can be many years.
We conducted a literature review on cancer latency and cessation lag to assess the scope of existing literature on the lag between exposure and cancer risk, which we include in Appendix A. Our review revealed several limitations of the existing literature, including small sample sizes, limited number of recent studies, limited cancer sites and exposure sources considered, lack of detailed statistics provided by the relevant studies, and limited detail on exposure concentrations, cancer severity, and ages of individuals at exposure. Many of these limitations reflect the fact that most of the papers we identified were not designed for the purpose of estimating latency and cessation lag. In light of these limitations, we conclude that the existing literature is not robust enough to justify estimating cessation lags and latencies directly from the literature.
To estimate the timing of avoided cancer for a hypothetical person, we instead assume that the timing of cancer diagnosis would follow the distribution of cancer incidence between the age at a minimum number of years after exposure and either the individual’s life expectancy age (Bell & Miller, Reference Bell and Miller2015) or age 89, whichever is smaller.Footnote 7 We use the NCI’s SEER cancer incidence data (SEER, 2024), which includes the number of cancer diagnoses by cancer site for 5 year age brackets that range from age 0 to 84 years, and also includes a bracket for 85 years and older. Our approach does not differentiate between latency and cessation lag, so they are assumed to have the same timing.
While the available information on minimum latency is very limited (Howard, Reference Howard2015; Hicks et al., Reference Hicks, Kaye, Azoulay, Bruun Kristensen, Habel and Pottegård2023; SAB, 2024), the minimum latency period is generally thought to be several years (Hicks et al., Reference Hicks, Kaye, Azoulay, Bruun Kristensen, Habel and Pottegård2023). Therefore, we selected minimum lag periods between exposure and diagnosis based on estimates of minimum latencies from the CDC’s World Trade Center Health Program (Howard, Reference Howard2015). By rounding Howard’s (Reference Howard2015) estimates up to the nearest year, we selected minimum lags of 1 year for childhood cancers, lymphoproliferative cancers, and hematopoietic cancers (including all types of leukemia and lymphoma), 3 years for thyroid cancer, 11 years for mesothelioma, and 4 years for all other cancers.Footnote 8
Table 1 presents an example of how this calculation is performed for individuals who are age 46 at the time they experience a change in exposure that reduces their risk for cancer (assuming a 4-year minimum lag between exposure and diagnosis). In this example, conditional on avoiding a case of cancer because of an exposure reduction that occurred at age 46, there is a 11.9% chance that the avoided cancer would have occurred between ages 50 and 54, a 15.1% chance that it would have occurred between ages 55 and 59, a 17.3% chance it would have occurred between ages 60 and 64, and so forth. Note that although the table presents these percentages for the age brackets for which the incidences were available, we use annual incidence rates estimated by assuming the incidence rates were uniformly distributed within the age brackets for which they were reported. In the Table 1 example, the mean lag between exposure and diagnosis would be 21 years, corresponding to an average age of 67 at the time of diagnosis for an individual with reduced exposure at age 46.
Distribution of timing of avoided cancer risk: Example for a reduction in exposure experienced at age 46 with a 4-year minimum lag between exposure and diagnosis

a Calculated as Column (2) divided by 83.8%, where 83.8% is the percentage of cancer incidence that occurs at ages 50 or older (the sum of the grey shaded cells).
2.5. Estimate the probability that the cancer is either fatal or non-fatal
The value of reducing risk for a given cancer type is estimated as a weighted average of the value of reducing both fatal and non-fatal risks for that cancer. This analysis uses age and sex-specific 20-year model-based relative survival rates to apportion the cancer risk into fatal and non-fatal risk. The 20-year relative survival rate was modeled to predict survival rates for subgroups with incomplete survival data. The log-logistic distribution was chosen because it provided the best fit across all cancer sites compared to other distributions available in NCI’s CanSurv software (Gamel et al., Reference Gamel, Weller, Wesley and Feuer2000; Cansurv, 2017; SEER, 2024). For example, since the 20-year survival rate for liver cancer in males aged 45–64 is 9%, our approach assumes that 91% of the reductions in liver cancer risk for males aged 45–64 are reductions in mortality risk and therefore are valued as reductions in the risk for fatal cancer (Gamel et al., Reference Gamel, Weller, Wesley and Feuer2000; Cansurv, 2017; SEER, 2024).
2.6. Estimate the timing between diagnosis and death for fatal cancer
In order to account for the elapsed time between diagnosis and death when assigning the values for mortality risk, the analysis estimates the percentage of deaths due to cancer in each year using the relative survival method, which uses the following steps: (1) calculate the cumulative mortality rate (1-cumulative survival rate) in each year; (2) for each year, subtract the previous year’s cumulative rate to calculate the per-year mortality rate; and (3) divide the per-year mortality rate for each year by the total 20-year mortality rate to estimate the percentage of deaths that occur in each year (see Table 2).
Example showing how timing between diagnosis and death is estimated

a The mortality rates are specific to (a) the cancer site, (b) the sex of the individual, and (c) the age category for the individual (0–14, 15–44, 45–64, and 65+).
2.7. Discount the values back to time at exposure
Risks for dying from cancer are discounted from the time of death to the time of exposure. Risks for non-fatal cancer are discounted from the time of diagnosis to the time of exposure.
Exposure duration -adjusted estimate for the excess number of cancer cases. When the duration of the change in exposure due to a policy change is different from the exposure duration assumed in the risk assessment that quantifies how cancer risk relates to exposure, an adjustment to account for the differences in the exposure duration may be needed. The specific output typically provided in risk assessments that are often used to quantify the relationship between exposure and cancer risk is the inhalation unit risk. Footnote 9 The interpretation of the inhalation unit risk relates an upper bound risk to a daily exposure for a lifetime (EPA, 2024). Economic analyses use what we will define as the excess cancer risk, which is a central cancer risk estimate that relates a central risk estimate to a daily exposure for a lifetime. The excess cancer risk estimates may be provided directly in the risk assessment, but sometimes they must be calculated from additional estimates provided in the risk evaluation. Thus, the typical estimate that relates cancer risk to exposure that is available for an economic analysis relates risk to exposure over an entire lifetime. However, a new policy may affect only a shorter duration of exposure, and simply calculating how average exposure over a lifetime will change may not be sufficient to account for how this shorter exposure duration and the life stage when it occurs might affect risk.Footnote 10 As noted in EPA (2013), “For example, consider someone who is 50 years old in the year of the analysis and has not yet gotten the cancer. Should the entire excess lifetime risk (the unit risk) be applied to this individual for the remaining expected years of his life? Or should a modified excess risk, conditional on his not having gotten the cancer in his first 49 years, be applied? Because the unit risk provides no information about how excess risk is distributed over the course of a lifetime, there is no clear answer.”
Our exposure duration-adjusted estimate applies an adjustment to the excess lifetime risk for cancer to account for the shorter exposure durations being considered and the life stage at which the changes in exposure occur. The exposure duration adjustment factor is calculated as the percentage of incidence of cancer that occurs within the age range for which excess cancer risks are estimated. For example, if 83.8% of cancer cases occur in individuals aged 50 or older, the exposure duration adjustment factor for an individual experiencing a 1-year change in exposure at age 46 is 83.8% (see Table 1, where 83.8% is the sum of the grey-shaded cells).Footnote 11
While estimating the excess lifetime risk is outside the scope of this paper, the exposure duration adjustment factor affects the value of the risk reductions because it affects the estimated distribution of cancer diagnoses by age. In turn, this affects the percentages of cancer cases that are fatal and the amount of time between avoided exposures and avoided cancer diagnoses and deaths. Note that if excess cancer risk estimates reflect shorter duration exposures, which are possible but not typical, the exposure duration adjustment factor would be unnecessary.
Weighted average value of a micro -risk reduction for each population and cancer site. Equation 1 shows how the weighted average value of a micro-risk reduction is calculated for each cancer site. The estimates are all calculated with and without the exposure duration adjustment factor described above (the exposure duration adjustment factor is set to 1 to exclude the adjustment).
 $$ \frac{\sum \limits_{j=i+1}^{89}\sum \limits_i^{85}{e}_i\times {g}_{i,s}\times {l}_{i,s}\times {d}_{i,s,j}\times \left(\left(\left(1-{f}_{s,j}\right)\times \frac{VNR}{{\left(1+r\right)}^{\left(j-i\right)}}\right)+{f}_{s,j}\times \sum \limits_{k=1}^{20}{m}_{i,s,j,k}\times \frac{VMR}{{\left(1+r\right)}^{\left(j+k-i\right)}}\right)}{\sum \limits_{j=i+1}^{89}\sum \limits_i^{85}{e}_i\times {g}_{i,s}\times {l}_{i,s}\times {d}_{i,s,j}} $$
Where:
ei = percentage of exposures that occur at age i.
gi,s = percentage of exposures at age i that are experienced by individuals of gender s.
li,s = exposure duration adjustment factor for individuals of gender s exposed at age i (this factor is set to 1 for estimates that exclude the adjustment).
di,s,j = percentage of diagnoses at age j among individuals of gender s exposed at age i.
mi,s,j,k = Percentage of deaths that occur k years after diagnosis among individuals who die from cancer of gender s exposed at age i and diagnosed at age j.
fs,j = Percentage of cancer cases that are fatal among individuals of gender s that are diagnosed at age j.
VMR = Value of mortality micro-risk reduction.
r = Discount rate.
VNR = Value of nonfatal cancer micro-risk risk reduction.
3. Discussion
Our calculations were modeled using SAS 9.4, and the results are included in supplementary spreadsheets.Footnote 12, Footnote 13 The spreadsheets allow users of the data to select: (a) the cancer site, (b) the affected population, (c) our estimated lags based using all-cause incidence (with or without an exposure duration adjustment factor) or a fixed lag period between 1 and 47 years, (d) our default WTP values or any chosen WTP value, and (e) the discount rate.
While the focus of this paper is not on the specific undiscounted WTP values used to value cancer morbidity and mortality, these are obviously important pieces to any benefits analysis of reduced cancer risk. When selecting an appropriate WTP value to use, analysts will need to consider whether and how to address valuations of morbidity versus mortality, the effect of increasing incomes over time on future WTP values, application of a cancer premium to standard VSL estimates, and the effect of latency on risk preference.
The main contribution of our proposed approach is to provide a method for accounting for the lag between exposure and diagnosis when there are little or no data available that informs an assumption for what this timing is likely to be. Our approach also accounts for the timing between diagnosis and death, estimated using SEER survival data.
However, there are remaining data gaps that we believe lead to future improvements of this approach. As we noted in our review of cancer latency and cessation lag, we did not identify any studies with empirical data on cessation lags. While an ideal approach to valuing cancer benefits resulting from a policy that reduces exposures would account for both latency and cessation lag, for the time being latency appears to be the best measure available, regardless of the actual timing of exposures in relation to the policy. Even with regards to data on cancer latency, there are only sparse data available to validate our approach, which is compounded by the wide range in typical lags depending on cancer type. For the one cancer type with more robust latency data – mesothelioma – the estimate for the average cancer lag derived from our proposed approach departed from the empirical data. While we concluded that our approach produced lag estimates that were reasonably similar to the empirical data for the remaining cancer types, it is possible that with more robust latency data we could further calibrate our approach. It is also possible that cancer lag varies by additional factors, such as length of exposure, exposure pathway, and type of exposure. We were not able to account for these factors due to lack of data, but this could be an area for further exploration.
Acknowledgements
We thank Lynne Blake-Hedges for her support, guidance, and input that made it possible for us to produce this paper. We also thank Charles Griffiths, William Silagi, and Ellen Post for the many thoughtful discussions during the initial development of this approach, Chris Dockins and Lauren Brown for their helpful comments, and Sarah Chadwick and Nicole Casados for providing valuable research support. Although the research in this paper has been funded wholly or in part by the United States Environmental Protection Agency contracts #EP-W-16-009 and #68HERH22A0018/68HERH23F0085, it has not been subject to the Agency’s review and therefore does not necessarily reflect the views of the Agency and no official endorsement should be inferred.
Competing interest
The authors declare none.
Appendix A: Literature review on cancer latency and cessation lag
We conducted a literature review to identify studies that provide information about either the latency between exposure and cancer incidence or mortality or the cessation lag between reduction of exposure and reduced risk. Our goal for the literature review was to assess the scope of existing literature on the lag between exposure and cancer risk and whether these existing data would be a preferable alternative to our approach to estimating cancer lags as presented in this paper. A second goal was to evaluate whether our approach for estimating cancer lag as presented in this paper was consistent with the available literature on latency and cessation lag. We note that the purpose of this review is to provide a general understanding of the scope of existing literature on cancer lags, rather than to provide a rigorous systematic review on the topic. The approach to estimating values of avoided cancer risks presented in this paper does not rely on the results of this literature review; as such, we determined that a full systematic review falls outside the scope of our research goals. Given this less rigorous approach, our review should not be interpreted as fully comprehensive nor as an indication of the quality of the identified studies.
To reiterate, we use the term “latency” in this paper to refer to the time period between exposure and cancer diagnosis or mortality. We use “cessation lag” to refer to the time period between reduction of exposure and reduced cancer risk. And we use “lag” as a general term to refer to either latency or cessation lag. Understanding these cancer lags is necessary to properly discount the benefits of avoiding cancer risks back to the time of avoided exposure.
A.1. Search protocol and methodology
We searched PubMed and Science Direct databases for our literature review. We structured our search of these databases to include at least one of each timing term, exposure term, and cancer term (Table A1). We searched titles, abstracts, key words, and full texts for our terms and compiled the resulting articles using the EndNote reference manager software. We restricted our results to peer-reviewed journal articles, but otherwise did not place any other search restrictions. This search was conducted in January 2020 (Abt Associates 2022) and June 2024.
Cancer latency literature review search terms

We identified a final set of relevant articles in two stages:
-
1. Title and abstract screening. Titles and abstracts were evaluated and either excluded or flagged for full text screening.
-
2. Full text screening. The full text of the article was evaluated and either excluded or included in the final set of relevant articles. For each relevant study, we recorded the following information: (a) country; (b) sample size; (c) median age of study participants; (d) mean, minimum, maximum, and standard deviation latency; (e) exposure source; (f) exposure duration; (g) type of timing (i.e. cessation lag or latency); (h) definition of timing (e.g. from first exposure to diagnosis); and (i) health end point.
Cancer latency literature review exclusion criteria

A.2. Review of literature measuring latency and cessation lag
We identified 1,823 articles based on our search protocol described in the previous section. Among these, we flagged 566 for full text screening, resulting in 84 relevant articles (Figure A1).
Overview of literature screening and review – Cancer lag.

Table A3 presents the number of relevant articles, by cancer site. Tables A4 and A5 summarize the lag estimates for each cancer site shown in Table A5, with the following exceptions. The studies for adenocarcinoma and low-grade fibromyxoid sarcoma are not included because they are not one of the 108 cancer sites we estimate values for in this paper (Section 2.1 describes how the 108 sites were selected). The studies for “all cancers,” “gonad (testis/ovary),” “leukemia and non-Hodgkins lymphoma (combined),” and one “multiple” study are not summarized because they aggregate estimates over multiple cancer sites. Finally, due to the larger number of studies identified for mesothelioma, we discuss those studies separately in Appendix B.
Number of relevant studies, by cancer site

Summary of cancer lag literature (time between exposure and diagnosis)

Summary of cancer lag literature (time between exposure and death)

Tables A4 and A5 present the sample size, mean/median age of study participants, mean exposure duration, minimum lag, maximum lag, mean/median lag, and standard deviation for each relevant study for lags defined as the time between exposure and diagnosis and the time between exposure and death, respectively. Because the study sample for the majority of relevant studies is the employed population, for simplicity the last columns of the tables present latency estimates for the employed population as estimated using our approach presented in Section 2 of this paper. Lag estimates for all 21 populations evaluated in this paper are included in the supplemental spreadsheets.
While mean lags differ from our estimates for some cancer sites, we are limited in our ability to draw any strong conclusions about the accuracy of our approach for these sites given limited sample sizes. However, from a broad comparison of the mean lags reported by the studies and the lags estimated using our methodology described in this paper, we believe our approach for estimating cancer lag produces estimates that are reasonably consistent with those identified in the literature search (see Figure A2).
Comparison of literature latency estimates with the estimated means based on incidence.

As previously discussed, one goal for this literature review is to assess the scope of existing literature on the lag between exposure and cancer risk, and whether the use of these existing data would be a preferable alternative to our approach presented in this paper. Our review reveals several limitations of the existing literature, leading us to conclude that the scope of existing literature is limited and that the data from the literature are not robust enough for us to consider it as a preferable alternative to our approach. First, all identified relevant studies define lags in terms of the latency between exposure and cancer diagnosis, demonstrating that data on cessation lag are not prevalent in the literature and cannot be used to determine the extent to which values for cessation lag and latency differ. Second, due to the age of many studies, the small sample size of relevant studies, and the small sample sizes of the studies themselves, it is possible that the lag estimates identified through the literature search are not representative of those for populations that would be affected by current regulatory policies in the United States. For example, to maintain a broad scope, we did not limit studies by geography. It is possible that healthcare systems, socioeconomic factors, and sociocultural behaviors in other countries both differ from those in the United States and have an impact on cancer lags. Similarly, the small number of studies and limited statistics provided by each study do not allow for robust analysis of how lags may vary by exposure source, exposure concentration, cancer severity, or age of the individual at exposure. We also note that studies measured exposures over many years and varied in how they defined the start of exposure (e.g. using a midpoint vs start of an exposure range to calculate lag). Because regulatory analyses typically estimate benefits corresponding to annual reductions in exposure, using lag values from the literature for this purpose would introduce uncertainty due to the likely need to assume that mean lags from multiple years of exposure are equal to the lag for a single given year of exposure. In addition, the relevant studies largely do not employ rigorous methods to establish causality between the exposure source and subsequent cancer diagnosis, adding to uncertainty regarding the accuracy and precision of the lag estimates. In light of these numerous limitations, we conclude that the existing literature is not robust enough to justify estimating cessation lags and latencies directly from the literature.
Appendix B: Meta-analysis of mesothelioma latency
We identified 34 relevant studies related to latency between exposure and diagnosis of mesothelioma.Footnote 14 Given the larger sample size of studies for this cancer site, we performed a meta-analysis to estimate a pooled mean latency and a pooled standard deviation across all the studies. The goal of this meta-analysis is to provide a more robust comparison of cancer latency estimates developed in this paper and the latency estimates in the literature.
We use a random-effects meta-analysis model to estimate the pooled mean latency of the mesothelioma studies. Under this model, the pooled mean latency is estimated as the weighted average latency of the relevant studies, where the weights are estimated as the inverse of the within-study and between-study variances.Footnote 15 By using inverse variance weights, studies with larger sample sizes and studies with more precise latency estimates (i.e. smaller standard deviations) will receive greater weights. We also estimate a pooled standard deviation across studies as the weighted average standard deviation of the individual studies, with weights equal to the degrees of freedom (N−1) for each study. These methods require the following underlying assumptions about the population of relevant cancer latency studies: (a) Mean latencies reported by each study vary from each other due to both within-study variance (i.e. sampling error) and between-study variance (i.e. differences in true mean latencies across study populations), (b) There is a common population variance underlying the studies, (c) Studies are independent of each other.
Table B1 presents the pooled mean latency and pooled standard deviation across the mesothelioma studies. Note that because variances are required to estimate the weights for each study, we exclude studies that do not report a standard deviation. We further exclude Bianchi et al. (Reference Bianchi, Bianchi and Bucconi2011) and the subgroups for peritoneum (males and females) and pleura (females) end points from the Marinaccio et al. (Reference Marinaccio, Binazzi, Cauzillo, Cavone, De Zotti, Ferrante, Gennaro, Gorini, Menegozzo, Mensi, Merler, Mirabelli, Montanaro, Musti, Pannelli, Romanelli, Scarselli and Tumino2007) study because these estimates are sampled from the same population as other estimates (i.e. Bianchi et al. (Reference Bianchi, Brollo, Ramani, Bianchi and Giarelli2004); pleura (males) subgroup from Marinaccio et al. (Reference Marinaccio, Binazzi, Cauzillo, Cavone, De Zotti, Ferrante, Gennaro, Gorini, Menegozzo, Mensi, Merler, Mirabelli, Montanaro, Musti, Pannelli, Romanelli, Scarselli and Tumino2007)). We selected these estimates to exclude because they correspond to the smallest sample sizes. The meta-analysis therefore consists of a final sample of 19 studies. All excluded studies are shaded grey in Table B1 to indicate that they are not included in the pooled meta-analysis estimates.
Meta-analysis of mesothelioma latency

As shown in Table B1 and Figure B1, the pooled mean latency for mesothelioma cases is 43 years, with a pooled standard deviation of 11.3 years. In comparison, we estimate a mean latency of 29 yearsFootnote 16 using the methodology described in the main body of this paper.
Mean latency and 95% confidence intervals of relevant studies.

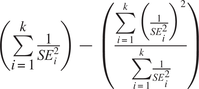
To evaluate the 19 studies for potential publication bias, we created a funnel plot in which we plot the mean latency and the standard error of each study included in the meta-analysis. Publication bias may be present if, for example, studies with larger sample sizes, larger effect sizes, and/or significant results are more likely to be published. The plot is a qualitative assessment of potential bias in the relevant studies. As shown in Figure B2, the larger studies with lower standard errors are symmetrically distributed about the pooled mean latency. We should expect this result where no publication bias is present. In the absence of publication bias, we should also expect the smaller studies with higher standard errors to be symmetrically distributed about the pooled estimate, albeit with more variance about the mean. Any asymmetry in the studies is potential evidence of publication bias. This asymmetry would most likely be present among the smaller studies; for example, if smaller studies systematically show larger effect sizes.
Figure B2 appears to be generally symmetrical, indicating that there is no publication bias. While one could potentially interpret Figure B2 as showing studies with larger standard errors skewing toward shorter latencies, we are cautious to interpret this as evidence of publication bias for two reasons. First, only a small number of studies are included in the meta-analysis; thus, any potential trend shown in Figure B2 may be a result of sampling error rather than systematic bias. Second, in most cases, the latencies reported by the studies were not the primary research objective. Latencies were often provided as descriptive statistics and based on observational records rather than a modeled effect size. Because concerns about publication bias often center around systematically larger effect sizes, we think the likelihood is low that studies included in this meta-analysis would exhibit publication bias.
Given the difference between the meta-analysis pooled mean latency estimate for mesothelioma cases (43 years) and the mean estimate using the current methodology described in the main body of this paper (29 years), the values for the mesothelioma end point we provide in our supplemental spreadsheets do not use the approach described in the main body of this paper. Instead, we use an adjusted triangular distribution with a minimum of 11 years, a maximum of 70 years (or the number of years until age 89, the max age of diagnosis in our analysis), and a mode of 43 years, which is the estimated mean latency from the meta analysis described in this appendix. The probabilities for the set of values above and below the mode are adjusted so that the average lag equals the mode of 43 years.
Funnel plot of mean latency by standard error.

Appendix C: Literature review on WTP for avoiding non-fatal cancer risk
In this appendix, we discuss findings from a literature review on the value that individuals place on avoiding non-fatal cancer risks (see Abt Associates 2022 for a previous version of this literature review). The complete valuation of a non-fatal cancer case measures the WTP to avoid an occurrence of cancer that will be survived. WTP is a comprehensive measure of the total value that a person would place on avoiding a cancer diagnosis. It accounts for the desire to avoid treatment costs; the value of avoiding the pain and suffering associated with treatment of cancer, such as chemotherapy, radiation, and surgery to treat cancer; productivity losses during treatment; the premium for risk aversion; and any other adverse consequences related to contraction of a non-fatal case of cancer.
While there is an extensive literature on the value individuals place on changes in mortality risks (i.e. VSL) (e.g. Robinson & Hammitt, Reference Robinson and Hammitt2016; EPA, 2010), studies measuring the WTP to avoid non-fatal cancer morbidity risks are less common. Based on advice from EPA’s SAB (2001), recent EPA economic analyses (see EPA, 2013, 2016, 2017, 2019) have used WTP estimates to avoid curable lymphoma (Magat et al., Reference Magat, Viscusi and Huber1996) and chronic bronchitis (Viscusi et al., Reference Viscusi, Magat and Huber1991) as substitutes for the value of avoiding non-fatal cancers that originate at other sites. For example, EPA’s 2005 analysis for the Final Stage 2 Disinfectants and Disinfection Byproducts Rule used bronchitis and lymphoma to estimate the value of avoiding a non-fatal case of bladder cancer (EPA, 2005). Given the breadth of cancer sites included in our estimates, the goal of this literature review is to assess potential WTP values that may be applicable to our valuation of avoiding non-fatal cancer risk.
WTP literature review search terms

C.1 Search protocol and methodology
We searched four databases for our literature review: EconLit, Environment Complete, JSTOR, and Science Direct. Given our goal of estimating the WTP to avoid cancer risk, we structured our database search terms to include at least one valuation term and at least one health end point term (Table C1). Although cancer end points are the primary interest, we included broader health end point terms (e.g. “disease”) to capture adverse non-cancer health outcomes that may still provide useful benefit-transfer estimates. We searched titles, abstracts, key words, and full texts for our terms. We restricted our results to peer-reviewed journal articles, but otherwise did not place any other search restrictions. This search was conducted in January and February 2020.
We used the terms presented in Table C1 to search each of the four databases and compiled the resulting articles using the EndNote reference manager software. After removing duplicate articles, we identified a final set of relevant articles in three stages:
-
1. Title and abstract screening. Titles and abstracts are evaluated and either excluded or flagged for full text screening. The criteria used for screening are described in Table C2. The presence of any one criterion was sufficient for exclusion of that study.
-
2. Full text screening. The full text of the article is evaluated and either excluded or flagged for detailed full text review. The criteria used for screening are described in Table C2. The presence of any one criterion was sufficient for exclusion of that study.
-
3. Detailed full text review. Articles are assessed for quality and for applicability to our cancer benefit estimates. We assessed study quality by evaluating factors, such as sample size, sampling methods, and valuation methods. For each study, we recorded the following information: (a) publish date, (b) study date, (c) country, (d) study population (e.g. children, specific industry, geography), (e) sample size, (f) health end point, (g) valuation method, and (h) valuation estimate.
WTP literature review exclusion criteria

C.2 Review of literature measuring the WTP for avoiding cancer risk
Querying the four databases with the search terms in Table C1 returned a total of 1,620 articles. Among these, we flagged 82 for a full text screening and 20 of those for a detailed full text reviewFootnote 17 (Figure C1).
Overview of literature screening and review – WTP.

During the full text review, we evaluated studies for their quality and their applicability to our goal of identifying WTP estimates for avoiding cancer risk in the U.S. population. We assessed study quality by evaluating factors such as sample size, sampling methods, and valuation methods. For example, we excluded studies with a sample size <50 and studies that were unlikely to be representative of the general U.S. population. Table C3 presents the studies we determined to be irrelevant during full-text review based on this quality assessment and relevance to the populations potentially affected by a TSCA action.
Full text review – Irrelevant articles.

Table C4 summarizes the final six studies we believe are most applicable to our monetized estimates of avoiding cancer risks. Generally, the studies deemed relevant to our review are conducted in the United States. We prioritize domestic analyses because we expect that WTP estimates will be dependent on factors such as cultural context, healthcare systems, and incomes and relative purchasing power. Several studies have investigated the reliability of international benefit transfers and have found that WTP estimates can differ considerably across countries for comparable non-market goods (e.g. Lindhjem & Navrud, Reference Lindhjem and Navrud2008; Ready et al., Reference Ready, Navrud, Day, Dubourg, Machado, Mourato, Spanninks and Vázquez Rodriquez2004; Zhai, Reference Zhai2011).
Full text review – Relevant articles

While it would useful to be able to characterize the validity of benefit transfer between WTP values for cancer and non-cancer health outcomes, the three studies we found examining this showed mixed evidence on the validity of such transfers (Hammitt & Haninger, Reference Hammitt and Haninger2010; Hammitt & Liu, Reference Hammitt and Liu2004; Magat et al., Reference Magat, Viscusi and Huber1996). However, we expect that the WTP to avoid a non-fatal cancer will be dependent on the characteristics of each adverse health outcome. Given the wide range of symptoms, prognoses, treatments, and latency periods for different types of cancers, a benefit transfer involving a non-cancer adverse health outcome may in some cases be more appropriate than a benefit transfer involving a cancer end point with differing characteristics. For this reason, we may still include non-cancer adverse health outcomes in our relevant studies.
In the sections below, we provide an additional discussion of each preferred study. Studies reflect a mix of private and public valuations, and the WTP values estimated by each study reflect overall utility loss associated with cancer risk. Estimated values were adjusted for income growth and inflation using EPA’s (2014) recommended method for the adjustment and an income growth elasticity of 0.45, which is the central estimate recommended for severe illness in used in EPA’s BenMAP model (EPA, 2021).
C.2.1 Bosworth et al. (Reference Bosworth, Cameron and DeShazo2009)
Bosworth et al. (Reference Bosworth, Cameron and DeShazo2009) used a discrete choice experiment to estimate WTP values to avoid illness from leukemia, colon/bladder cancer, lung cancer, and a non-site specific cancer. In their stated preference survey instrument, Bosworth et al. elicited public WTP values by describing a proposed public policy that will reduce community-level risk of both illness and death for these diseases by improving air pollution, drinking water contamination, and the levels of pesticides in foods. Survey participants were presented with a series of policy scenario pairs and asked to choose between the two offered policies, where the private cost of the policy, the number of avoided illnesses and the number of avoided deaths were varied.
We derived WTP per statistical illness avoided from Bosworth et al.’s estimates at the following sites, where the number of deaths are held constant. Note that Bosworth et al. estimated the median annual WTP per illness avoided in a population of 50,000 over 10 years. We estimate the WTP per statistical case avoided by multiplying their WTP estimates by 500,000 (50,000 × 10). Below, we present the WTP per statistical case avoided as derived from Bosworth et al. (Reference Bosworth, Cameron and DeShazo2009), as well as our adjusted estimates reporting in 2023$ per 1 in 1,000,000 risk reduction.
-
• Non-site specific cancer:
-
• $245,000 (2003$) per avoided statistical illness, or
-
• $0.46 per 1/1,000,000 risk reduction (2023$)
-
-
• Leukemia in children:
-
• $280,000 (2003$) per avoided statistical illness, or
-
• $0.52 per 1/1,000,000 risk reduction (2023$)
-
-
• Leukemia, general:
-
• $770,000 (2003$) per avoided statistical illness, or
-
• $1.44 per 1/1,000,000 risk reduction (2023$)
-
-
• Colon/bladder cancer:
-
• $400,000 (2003$) per avoided statistical illness, or
-
• $0.75 per 1/1,000,000 risk reduction (2023$)
-
-
• Lung cancer:
-
• $845,000 (2003$) per avoided statistical illness, or
-
• $1.58 per 1/1,000,000 risk reduction (2023$)
-
Bosworth et al. elicited WTP estimates for community-level risks in that respondents are valuing reductions in risk to both themselves and to others in their community. Public WTP estimates may be appropriate when valuing a reduction in risks from a public good (e.g. municipal drinking water), but WTP estimates for public versus private risks can differ significantly (Zhang et al., Reference Zhang, Adamowicz, Dupont and Krupnick2013). For example, Bosworth et al. estimated that the WTP to avoid leukemia risks for children (private risk to respondent not a factor) to be less than half of that for the general population (private risk to respondent considered). However, Bosworth et al. measured the degree to which perceived personal benefits is associated with a respondent’s WTP and concluded that anticipated private benefits is a stronger predictor of WTP than altruistic considerations. Thus, we believe that the estimates from Bosworth et al. are a reasonable approximation for the WTP to avoid private cancer risks, with the exception of leukemia risks for children.
C.2.2 Gayer et al. (Reference Gayer, Hamilton and Viscusi2000)
Gayer et al. (Reference Gayer, Hamilton and Viscusi2000) used a hedonic pricing model to estimate the WTP of residents to avoid cancer risk from Superfund sites. The study estimates the value of avoiding a non-site-specific case of cancer based on the marginal effect of cancer risk on housing prices. Valuations therefore reflect the private cost to avoid an increased risk of cancer. Gayer et al. estimated a value of avoiding a statistical case of cancer of $4.6 million (1996$), or $10.79 per 1/1,000,000 risk reduction (2023$). Note that this valuation method does not distinguish between WTP to avoid cancer morbidity risks from the WTP to avoid cancer mortality risks. Because residents may account for risk of mortality from a cancer illness in their demand for housing near hazardous waste sites, this estimate likely overestimates the value of a non-fatal case of cancer.
C.2.3 Gerking et al. (Reference Gerking, Dickie and Veronesi2014)
Gerking et al. (Reference Gerking, Dickie and Veronesi2014) used contingent valuation data to estimate the WTP to avoid skin cancer and leukemia risks. The authors estimated cancer risks in three dimensions: probability of illness, probability of death conditional on illness, and probability of illness conditional on survival. We use the third dimension (probability of illness conditional on survival) for our estimates of WTP to avoid non-fatal cancer risk. Gerking et al. found that for skin cancer, the expected utility gain from being healthy as compared to contracting cancer is not statistically different from zero. The authors suggested that this result is plausible for minor illnesses where a reduction in utility would not occur. This result is consistent with Dickie and Gerking (Reference Dickie and Gerking1996), who estimated comparatively low WTP values to avoid a case of skin cancer. They, therefore, do not estimate the WTP for reductions in risk of skin cancer given that death does not occur.
For leukemia, Gerking et al. estimated a mean value of $9.62 per 1 in 10,000 reduction in risk of illness conditional on survival (2008$) or $0.15 per 1/1,000,000 risk reduction (2023$). This value is lower than estimates from the other studies discussed in this section. Gerking et al. (Reference Gerking, Dickie and Veronesi2012) discussed the factors that might explain this difference. Marginal WTP for a unit of risk reduction is expected to decrease as risk increases. The WTP estimates from this study are based on the private WTP to eliminate the perceived risk of leukemia morbidity and mortality of the study participants. This perceived risk is higher than risk of workplace fatalities, which is often used for VSL estimates such as the estimate described in Section 1 that is used to calculate the value of avoiding non-fatal cancer risk for studies using a risk–risk trade-off approach between risk of disease and death (i.e. Magat et al., Reference Magat, Viscusi and Huber1996; Sloan, Reference Sloan1998; Viscusi et al., Reference Viscusi, Magat and Huber1991). Furthermore, study participants overestimated the perceived risk of leukemia morbidity and mortality, which may result in underestimates of WTP.
C.2.4 Magat et al. (Reference Magat, Viscusi and Huber1996)
Magat et al. (Reference Magat, Viscusi and Huber1996) evaluated the risk–risk trade-off between curable lymphoma and death using a reference lottery metric. A reference lottery is a methodology that educates survey respondents of the health consequences of a particular disease (in this case curable lymphoma), and based on this information, presents them with choices related to health outcomes. The private choices in health outcomes made by the respondents can be further evaluated to derive quantitative measures of relative risk aversion. The Magat et al.’s study determined that the median risk–risk trade-off (relative risk aversion) for contracting a curable case of lymphoma without any risk of death was equivalent to 58.3% of the risk attributed to contracting a case of lymphoma with certain death (i.e. the average person would pay 58.3% of what they would pay to reduce the risk of certain death to achieve an equal risk reduction for contracting lymphoma and recovering). Based on the Magat et al.’s study results of the WTP for a micro-risk reduction for curable lymphoma as 58.3% of the VMR, this results in an estimate of $7.99 (58.3% × $13.71) for the WTP of a 1/1,000,000 risk reduction (2023$) for the morbidity component of curable lymphoma.
C.2.5 Sloan (Reference Sloan1998)
Sloan (Reference Sloan1998) used a risk–risk approach to evaluate the value of avoiding a case of multiple sclerosis (MS). Study participants were asked to assume they had MS and then decide whether they would undergo an operation that would either cure the disease completely or kill them instantly, with the probability of death varying between question iterations. The median probability of death where participants were indifferent between having MS and undergoing the operation was 0.45. Multiplying this probability by our VMR estimate results in a WTP for a 1/1,000,000 risk reduction for MS of $6.17 (2023$; 0.45 x $13.71).
C.2.6 Viscusi et al. (Reference Viscusi, Magat and Huber1991)
Viscusi et al. (Reference Viscusi, Magat and Huber1991) derived a WTP estimate through a contingent valuation survey that measured risk–risk trade-off. The study asked participants to compare the risk of chronic bronchitis with the risk of a fatal auto accident to produce a relative valuation. The study measured a risk-dollar trade-off by comparing the risk reduction for chronic bronchitis or an auto accident fatality against a cost-of-living increase to reduce risks. The result is a distribution of values representing the private WTP to avoid a case of chronic bronchitis with a median of $457,000 and a mean of $883,000 in 1990 dollars. Adjusting the median value results to 2023$ results in an estimate of $1,340,000 per-statistical case, or $1.34 per 1/1,000,000 risk reduction.
The WTP to avoid chronic bronchitis is not a perfect substitute for the WTP to avoid a case of cancer, though it appears to be a reasonable approximation for the purposes of benefit assessment. Non-fatal cancer is associated with more severe acute health effects than chronic bronchitis, often including major surgery and undergoing radiation or chemotherapy treatments, with attendant side effects. Chronic bronchitis may be associated with more obvious lingering implications, such as shortness of breath and more frequent chest infections. Both chronic bronchitis and non-fatal cancer can have implications for long-term quality of life, such as taking medication, visiting doctors regularly, and limiting recreational and job-related activities.
C.3 Summary and discussion
Table C5 summarizes the WTP values per 1 in 1,000,000 reduction in non-fatal cancer risk from the studies described above. Values per statistical case can be estimated by multiplying the value per risk reduction in the table by 1,000,000. The table includes a description of the adverse health end points that can be used for evaluating the applicability of a particular end point as a substitute for other types of cancers. We also suggest specific cancer sites where each WTP value may be most applicable. However, for each cancer site under evaluation, we recommend consideration of its disease profile (e.g. symptoms, treatment) in comparison to that of the health end points valued by each study to determine which studies are most applicable. Depending on the cancer sites, either specific values or a range of plausible WTP values could be used. In Table C5, we suggest potential upper and lower bounds for these ranges by indicating whether a WTP value could be used an “upper estimate” or “lower estimate.”
Summary of default WTP estimates to avoid non-fatal cancer risk (value per 1/1,000,000 reduction in cancer risk, 2023$)

As outlined in the National Science and Technology Council’s report Advancing the Frontiers of Benefit–Cost Analysis: Federal Priorities and Directions for Future Research (National Science and Technology Council, 2023), the valuation of non-fatal health effects is a research priority for federal agencies. The results of this literature review support the view that data gaps in the valuation of non-fatal health effects exist in the literature. We identified a limited number of relevant studies and associated health end points. This is a major limitation given that WTP for avoiding a non-fatal health risk is likely very specific to a given health end point and a range of associated impacts, such as symptoms, treatment, and outlook. We include our recommended values from this appendix in our supplemental spreadsheets for use by analysts in the absence of more robust data on the value of avoiding non-fatal health risks. However, we recognize that this review is not comprehensive nor applicable to all analyses. Thus, we designed our approach so that a policy analyst may easily substitute any value of avoided non-fatal health risks of their choice in lieu of our default values.