1. Introduction
How does the cognitive system represent the form of a word? In the psycholinguistics literature, linguistic form has traditionally been viewed as represented independently of word meaning. For example, in models of language production, meaning and phonology are typically represented as independent stages in the language production system (Garrett, Reference Garrett and Butterworth1980; Bock & Levelt, Reference Bock, Levelt and Gernsbacher1994). This theoretical position typically goes hand-in-hand with the assumption that lexical meaning is grounded in abstract symbolic representations (e.g., Chomsky, Reference Chomsky1957; Fodor, Reference Fodor2000; Pinker, Reference Pinker1994). This assumption predicts independence between meaning and form because it is not clear how a symbolic, amodal representation of meaning could influence the modal representations supporting articulation. However, recent evidence suggests that these assumptions may need to be reconsidered. A large body of work in the situated cognition literature suggests a systematic relationship between semantic representations and motor representations, primarily from language comprehension studies (see Fischer & Zwaan, Reference Fischer and Zwaan2008, for a review). Critically, if true, this work predicts that word meaning may influence how a word is articulated in language production. In this paper, we test this prediction and find that aspects of lexical meaning affect the prosody of words.
Situated cognition has been claimed to be a basic computational mechanism for predictive processing (Barsalou, Reference Barsalou2009). This theory proposes that motor-related aspects of perceptual experience are encoded in neural networks associated with motor activity, and then later simulated in those same networks. In the case of word meaning, this predicts that the activation of a word meaning should lead to the activation of motor representations related to that meaning. In language production, this suggests the possibility of a non-arbitrary relationship between a word’s meaning and acoustic properties of a word’s linguistic form. Specifically, words whose meanings are associated with articulation should activate motor representations related to articulation to a greater extent than words that are not associated with articulation. If true, words semantically related to articulation should be produced differently than words semantically unrelated to articulation, thus leading to a non-arbitrary relationship between linguistic productions and meaning.
While this prediction of situated cognition has not been tested in language production, evidence from a range of physical measures suggests that situated cognition is involved in language comprehension (see Fischer & Zwaan, Reference Fischer and Zwaan2008, for a review). For example, Glover and colleagues (2004) found effects of language comprehension on the size of participants’ grip aperture when moving a semantically unrelated object. Participants read a word denoting an object requiring a small (e.g., pencil) or large (e.g., baseball) grip aperture and then picked up a wooden block. Participants’ grip aperture on the block reflected the size of the object denoted by the previously read word, suggesting that the word meaning activated motor-related cognitive representations. Studies using saccadic eye-movements (Spivey & Geng, Reference Spivey and Geng2001) and fMRI measures (Hauk, Johnsrude, & Pulvermüller, Reference Hauk, Johnsrude and Pulvermüller2004) also provide converging evidence for situated language comprehension.
An important tenet of situated cognition is that lexical semantics activate only related motor representations. Bergen et al. (Reference Bergen, Lau, Narayan, Stojanovic and Wheeler2010) present particularly compelling evidence for the recruitment of modality specific motor systems in language comprehension. In a series of studies, participants were presented with a picture of a stick figure engaged in a motor activity. After the picture was presented, participants saw an action verb (e.g., kick) and were asked to indicate whether or not the verb matched the picture. They found that participants took longer to make a mismatch judgment when the mismatched word used similar effectors to the target than when it used different effectors. They argue that this effect arose from competition between the target and the word with matching effectors, creating interference in the motor system and slowing down responses.
While there is converging evidence for modality-specific activation of lexical semantics across a range measures and paradigms in language comprehension (Boulenger et al., Reference Boulenger, Roy, Paulignan, Deprez, Jeannerod and Nazir2006; Buccino et al., Reference Buccino, Riggio, Melli, Binkofski, Gallese and Rizzolatti2005; Pülvermuller et al., Reference Pülvermuller, Hauk, Nikulin and Ilmoniemi2005), work in language production has been limited. One prior study in language production examined the relationship between lexical semantics and prosody with respect to two words: up and down (Shintel, Nusbaum, & Okrent, Reference Shintel, Nusbaum and Okrent2006). They found that utterances of up tended to be produced with greater pitch, relative to utterances of down. This result provides some preliminary evidence for situated cognition in language production, and suggests an additional case of a non-arbitrary mapping between linguistic form and meaning. However, no previous work has tested a more general prediction of situated cognition: lexical semantics should activate modality-specific representations and this activation should influence the acoustic-phonetic properties of words in production.
The present set of experiments was designed to test this prediction. We explored whether words semantically related to articulation are produced differently than words semantically unrelated to articulation. In three experiments, participants completed a production task in which we manipulated the semantic content of their productions. In Experiment 1, we examined words with meanings involving either a high (e.g., yelling) or low (e.g., chatting) amount of articulatory effort. If word meanings activate related modal representations, high-effort articulation words like yelling should be more forcefully articulated than low-effort vocal words like chatting. To explore the specificity of this activation, we also tested words that were semantically unrelated to articulation (e.g., kicking). Words semantically unrelated to articulation should not activate articulatory motor representations as a result of their semantics and should therefore be produced less prominently than words that are semantically related to articulation. Critically, this should be true even if the amount of effort associated with the meaning of the articulation word is less than the effort associated with the non-articulation word (e.g., whisper vs. kicking).
In the present experiments, we assume that the acoustic properties of the produced word, like intensity, fundamental frequency (F0), and duration, index the forcefulness of production. Work on the acoustic-phonetic structure of prosody suggests that these particular acoustic factors correlate with acoustic prominence (see Wagner & Watson, Reference Wagner and Watson2010, for a review). Thus, we predict that words with meanings associated with greater articulatory effort will be produced with greater intensity, higher F0, and longer duration than words with meanings associated with less articulatory effort.
2. Experiment 1
2.1. method
2.1.1. Participants
In this and the subsequent experiments, the participants were native speakers of English at the University of Illinois at Urbana-Champaign who participated for course credit or cash compensation ($8). Sixty-three individuals participated in Experiment 1. We also recruited ninety-seven participants from Amazon Mechanical Turk for a preliminary norming study. All participants gave informed consent prior to beginning the study.
2.1.2. Materials and procedure
Participants were presented with a pictureFootnote 1 followed by a word on a computer monitor. The participant’s task was to produce the target word. Twelve of the target words denoted vocal meanings (e.g., yelling) and twelve of the target words denoted meanings associated with motor activity involving feet (e.g., kicking). Half of the vocal words denoted high-effort meanings (e.g., yelling) and the other half denoted low-effort meanings (e.g., chatting). The target words are included in ‘Appendix A’. Forty-eight fillers were also included that denoted meanings unrelated to vocal or foot motor activity (e.g., photographing, juggling, etc.).
In each trial, a picture was displayed for 3 seconds (see footnote 1) followed by a new screen displaying the target word. The target word was displayed for 2 seconds and then a message in the corner of the screen appeared (‘speak’) prompting participants to begin speaking. After producing the word, participants clicked the mouse to view the next picture–word pair. Participants were recorded with a headset microphone. In this and the subsequent experiments, the target words were labeled using Praat speech analysis software (Boersma & Weenink, Reference Boersma and Weenink2005). Each word was analyzed for mean intensity, mean duration, and F0 excursion over the word.
We also conducted a preliminary study to norm the semantics of the target words. For each target word, we asked participants to rate how much effort was associated with the word’s meaning (i.e., “How much physical effort does it take to do the following action?”). Responses were given on a 7-pt Likert scale. In addition, we normed the vocal words for loudness (i.e., “How loud is the following action?”). Question type was manipulated between-subjects. Items from Experiment 2 were also included. The effort norms were collected to serve as controls in our statistical analyses. The loudness norms allowed us to ensure that (i) general arousal was not driving the result and (ii) the words that we selected for the vocal conditions were normed for loudness.
2.2. results
The data were analyzed using a linear mixed effects regression model (see ‘Appendix B’ for ANOVA analyses). Measures of intensity, F0, and duration were analyzed as a function of semantics (foot vs. vocal). Participant gender, spoken frequency, and number of syllables were also included as fixed effects. In this and the subsequent study, spoken frequency was estimated using the SUBTLEX-us corpus (Brysbaert & New, Reference Brysbaert and New2009). Semantics and gender were coded using mean-centered contrast coding. In all three experiments, models were fit using the lmer function in the lme4 package of the R software package (Baayen, Reference Baayen2008; R Development Core Team, 2010). Model comparisons were conducted using Akaike information criterion.
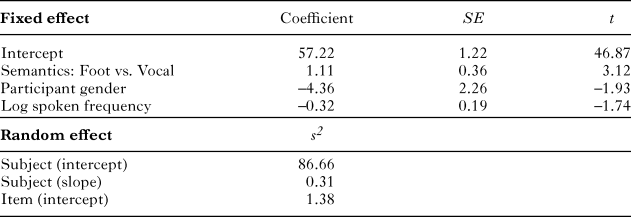
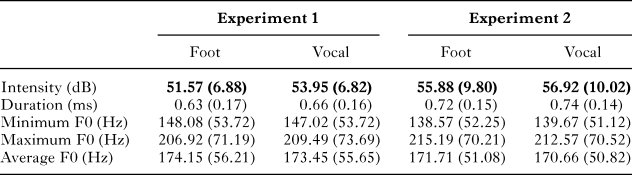
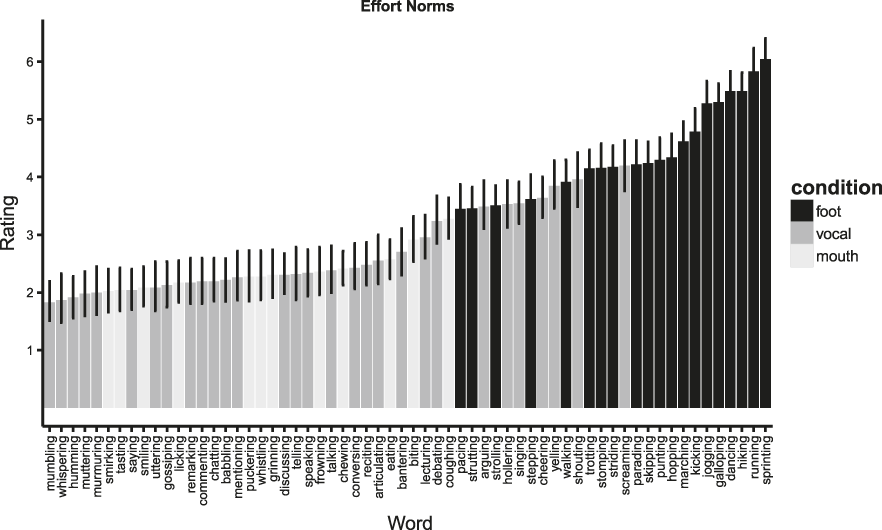
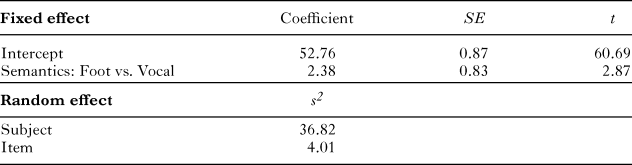
The analysis revealed reliable effects of semantics on average intensity. Vocal words (M = 53.95 dB) were produced with greater intensity than foot words (M = 51.57 dB). The best model fit included only semantics as a fixed effect, with random subject and item intercepts. Table 1 displays parameter estimates for the model. This pattern of results does not change when participant gender, spoken frequency, and number of syllables are included in the model, or when by-subject random slopes were included in the random effect structure. Effects of semantics on minimum F0, mean F0, maximum F0, and duration were not reliable (see ‘Appendix C’ for means for all acoustic measures). The results from the norming study revealed a different pattern: foot words were rated as more effortful than vocal words (t(46) = 12.44, p < .0001; see ‘Appendix D’ for all item means). In addition, the effect of semantic condition on intensity remained reliable when effort rating was included as a fixed effect.
Fixed effect estimates (top) and random effect estimates (bottom) for multi-level model of intensity in Experiment 1
To further explore the effect of semantics on intensity, we subdivided the vocal words into low- and high-effort meanings. High-effort vocal words were rated as both more effortful (t(46) = 11.21, p < .0001) and louder than low-effort vocal words (t(48) = 35.22, p < .0001).
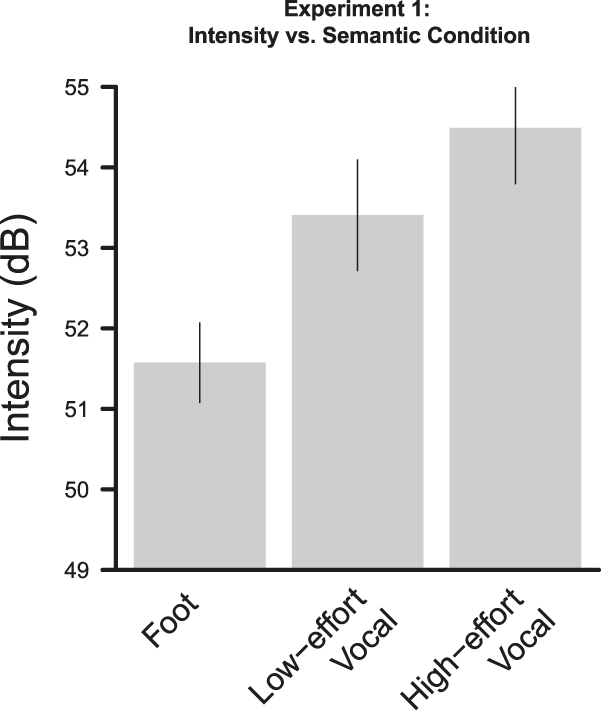
The mean intensities for foot, low-effort vocal, and high-effort vocal words are displayed in Figure 1. Foot words (M = 51.57 dB) were produced with lower intensity than low-effort vocal words (M = 53.41 dB; t = 1.87, ß = 0.93, S.E. = 0.50), though this difference was only marginally significant. Low-effort vocal words were produced with lower intensity than high-effort vocal words (M = 54.49 dB; t = 2.06, ß = 0.65, S.E. = 0.32).
Mean intensity in Experiment 1 as a function of semantics. Error bars represent 95% confidence intervals.

2.3. discussion
The effect of condition on intensity in Experiment 1 suggests that the amount of semantic effort associated with the meaning of the word influenced articulation. As predicted by a motor theory of lexical meanings, words semantically related to articulation were produced with greater intensity than words semantically unrelated to articulation. Furthermore, there was a graded pattern of intensity that depended on how involved articulatory motor representations were in the activity denoted by the word’s meaning: word meanings denoting foot motor activities are not related to articulation, and were therefore produced less prominently than low-effort vocal words. Low-effort vocal words were in turn produced less prominently than high-effort vocal words whose meanings are associated with relatively more involvement of articulatory motor representations. Critically, this effect held even when controlling for semantic effort. This suggests that the difference in intensity is due to motor-specific activation of meaning representations, rather than general arousal.
One potential concern with this interpretation of the data is that the variability in stimuli across conditions might be the underlying cause of the effect. Because it is not possible to manipulate vocal effort without using different lexical items, the two conditions use two completely different sets of words. Thus, it is possible that the effect on intensity is due to something other than differences in semantic effort-level across conditions, such as differences in the phonetic properties of the words. We attempted to statistically control for word differences by including variables known to differ across words (spoken frequency and number of syllables) in the model but idiosyncratic differences between words may still remain. We return to this issue in Experiment 3.
A second concern is the possibility of Type 1 error, given the number of acoustic variables measured. To address these concerns, we conducted a replication of Experiment 1 in Experiment 2. Experiment 2 also included a new class of items: words that denoted activities involving the mouth, but not involving vocalization (e.g., chewing). This class of words allowed us to test the level of specificity of the motor representations activated by the semantics of the words. If a word’s semantics activate motor representations specific to the activity denoted by the verb, then words involving vocalization should be produced more prominently than mouth words not involving vocalization. If, however, the semantics of a word activates motor representation associated with general activity of a particular effector, then there should be no difference between mouth words that do and do not involve vocalization.
3. Experiment 2
3.1. method
3.1.1. Participants
Sixty-seven individuals participated in Experiment 2.
3.1.2. Materials and procedure
The procedure was identical to Experiment 1, except the picture manipulation was eliminated and more items were included. The expanded stimulus set included sixteen additional low-effort vocal words (21 total), three additional high-effort vocal words (9 total), and eight additional foot words (20 total). We also included twelve items that denoted activities involving the mouth, but that did not involve vocalization (e.g., chewing). These new items are listed in ‘Appendix E’. Thirty-nine filler items were also included denoting meanings unrelated to mouth or foot motor activity (e.g., photographing, juggling, etc.).
3.2. results
The data were analyzed using a linear mixed effects regression model. Measures of F0, duration, and intensity were analyzed as a function of semantics (foot vs. vocal). Participant gender, spoken frequency, and number of syllables were also included as fixed effects. Semantics and gender were coded using mean-centered contrast coding.
Replicating Experiment 2, we found that vocal words (M = 56.92 dB) were produced with greater intensity than words related to foot activity (M = 55.88 dB). The best model fit included semantics, participant gender, and spoken frequency as fixed effects. The random effect structure included both random slopes and intercepts by subject and random intercepts by item. Table 2 displays parameter estimates for the model. The overall pattern did not change when number of syllables was included in the model as a fixed effect. As in Experiment 1, effects of semantics on minimum, mean, and maximum F0, and duration were not reliable. The norming data replicated the norms from Experiment 1: foot words were rated as more effortful than vocal words (t(46) = 13.22, p < .0001). In addition, vocal words were found to be rated as more effortful than mouth words (t(46) = 3.80, p < .001). As in Experiment 1, high-effort vocal words were rated as both more effortful (t(46) = 10.46, p < .0001) and louder than low-effort vocal words (t(48) = 31.79, p < .0001). The effect of semantics on intensity remained reliable even when controlling for semantic effort.
Fixed effect estimates (top) and random effect estimates (bottom) for multi-level model of intensity in Experiment 2, comparing foot and vocal words
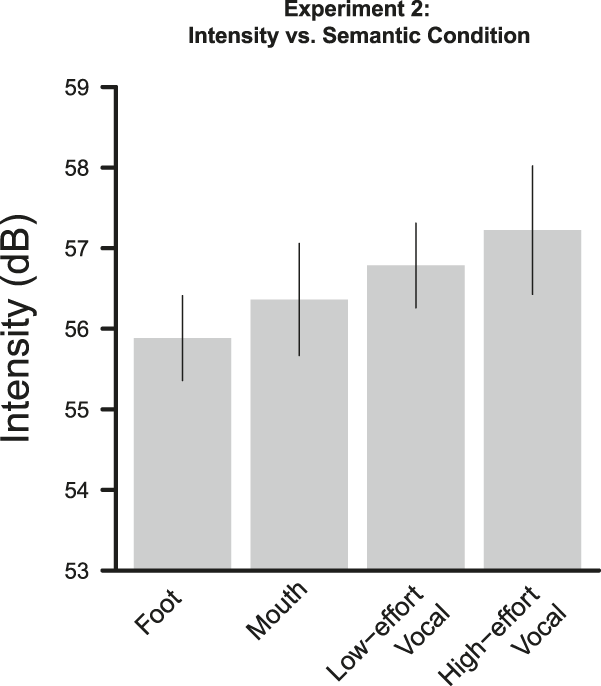
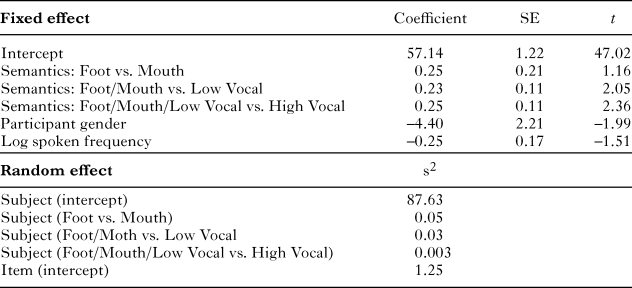
To explore the graded pattern of intensity observed in Experiment 1, we compared the mean intensities for all four word classes: foot, mouth, low-effort vocal, and high-effort vocal. Mean intensities for each word class are shown in Figure 2. Semantic levels were coded using Helmert contrast codes. The best model fit included semantics, participant gender, and spoken frequency as fixed effects. The random effect structure included both random slopes and intercepts by subject and random intercepts by item. Table 3 displays parameter estimates for the model. The difference between foot words (M = 55.88 dB) and mouth words (M = 56.36 dB) was not reliable (t = 1.16, ß = 0.25, S.E. = 0.21). Low-effort vocal words reliably differed from mouth and foot words (M = 56.79 dB; t = 2.05, ß = 0.23, S.E. = 0.11). High-vocal words (M = 57.22 dB) reliably differed from the other semantic levels (t = 2.36, ß = 0.25, S.E. = 0.11).
Mean intensity in Experiment 2 as a function of semantics. Error bars represent 95% confidence intervals.
Fixed effect estimates (top) and random effect estimates (bottom) for multi-level model of intensity in Experiment 2, comparing foot, mouth, low vocal, and high vocal words
3.3. discussion
The effect of condition on intensity replicates the pattern of results seen in Experiment 1. These data suggest that fine-grained semantics of verbs are reflected in fine-grained activations of the motor system. Even though the words in the ‘mouth’ condition are associated with the same effector as the ‘vocal’ conditions, production of these words did not increase the intensity with which they were produced compared to the ‘foot’ controls, presumably because they are not linked to articulation.
While Experiments 1 and 2 both point to an effect of semantics on articulation, it remains possible that idiosyncratic properties of the particular phonetic structures of the words are responsible for the difference in intensity between the two conditions. Experiment 3 addressed this concern using a novel production task. Prior work suggests that word onset time and duration are influenced by the planning of a lexical item that occurs later on in the sentence (e.g,. Lee, Brown-Schmidt, & Watson, Reference Lee, Brown-Schmidt and Watson2013). In Experiment 3, we reasoned that the semantics of a verb might also influence the articulatory system prior to the actual production of the verb, possibly when the word is first being planned. If true, then effects of semantics on intensity should be observable on the words prior to the production of the target verb, when the verb is embedded in a sentence. Such a finding would suggest that acoustic differences related to semantics found in Experiments 1 and 2 are not due to the particular phonetic structure of the target word.
To test this prediction, we adopted the paradigm used in Lee et al. (Reference Lee, Brown-Schmidt and Watson2013). We presented participants with a picture and asked them to describe it using the frame “Click on the person that’s [verb-ing]”. Critically, we manipulated the activities depicted in the pictures such that some showed a person doing an activity involving vocalizing (e.g., giving a speech), and others showed a person doing an activity involving the feet (e.g., kicking a soccer ball). If the semantics of a word activates the motor system prior to the critical word, then the preamble to the critical verb should be produced with greater intensity for vocalization pictures, as compared to foot pictures. This pattern of results would make it unlikely that differences in intensity as a function of semantic condition were the result of idiosyncratic acoustic properties of the target verbs.
4. Experiment 3
4.1. method
4.1.1. Participants
Sixty-four individuals participated in Experiment 3.
4.1.2. Materials and procedure
Participants sat in front of a computer monitor wearing a headset microphone. The instructions informed them that they were going to view pairs of pictures and their task was to say a sentence that would tell a future participant to click on one of the pictures in a different experiment. They were instructed to describe the pictures using the phrase “Click on the person that’s …”. Participants completed three practice trials before beginning the experimental trials.
A trial consisted of two images displayed on the left and right side of the screen. After 2 seconds, a red box appeared behind one of the pictures indicating the target picture to be described. After producing a description, participants clicked the mouse to advance to the next picture pair.
There were eighty experimental trials, thirty critical and fifty filler. Half of the critical trials showed a target picture depicting a person doing an activity that involved vocalization (e.g., giving a speech), and the other half showed a target picture depicting a person doing an activity involving the feet (e.g., kicking a soccer ball; see ‘Appendix F’ for sample stimuli). In the critical trials, the distractor pictures were unrelated to vocal or foot activities. In the filler trials, ten of the distractor pictures involved vocal activities and another ten involved foot activities. This was done so that the activity depicted in the pictures could not be used to predict the target. Order of trials and target side were both randomized.
Six critical regions of each utterance were analyzed: (i) region prior to utterance onset (ii) “click on”, (iii) head noun (e.g., “the person”), (iv) complementizer (e.g., “that’s”), (v) verb (e.g., “talking”), (vi) utterances after the target verb (e.g., “on the phone”). We analyzed each region for mean duration, mean intensity, and F0 excursion.
4.1.3. Results
1,755 of the 1,920 (64 participants × 30 critical trials) picture descriptions were analyzed. Descriptions were excluded in cases where the participant did not describe the intended action (e.g., “click on the person that’s handing out newspapers”; N(vocal) = 102, N(foot) = 51) or did not use any verb at all (e.g., “click on the athlete”; N(vocal) = 2, N(foot) = 10). Utterances were not excluded if the complementizer region was absent. They were also not excluded if speakers used a head noun other than “the person” (e.g., “the girl”).
The data were analyzed using a linear mixed effects regression model. Measures of intensity, F0, and duration were analyzed as a function of semantics for each critical region (vocal vs. foot picture). Participant gender was included as a fixed effect. The random effect structure included random slopes and intercepts by participant and random intercepts by target item. Condition and gender were coded using mean-centered contrast coding.
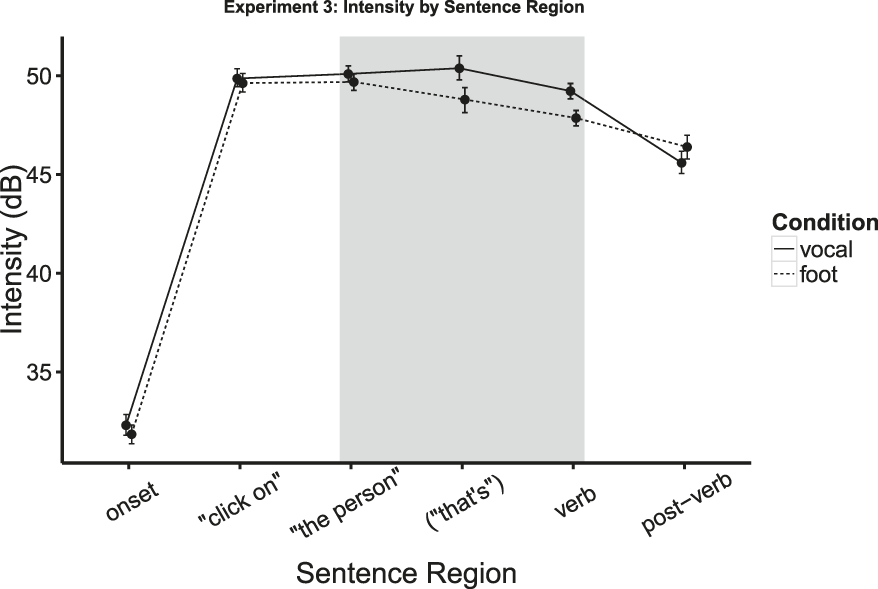
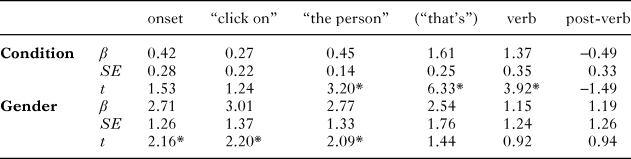
Vocal pictures were described with greater intensity than foot pictures in the two regions preceding the critical verb (“the person” and “that’s”). There was also a reliable difference in intensity in the verb region, replicating the effects seen in Experiments 1 and 2. As in the previous experiments, no effects were observed on the other measures. Figure 3 shows the intensity in each region. The parameter estimates and final model designs for intensity are summarized in Table 4.
Mean intensity in Experiment 3 as a function of activity depicted in the target picture. Error bars represent bootstrapped 95% confidence intervals. Regions are shaded where there is a significant difference between conditions.
Parameter estimates for intensity for each critical region in Experiment 3. The models also included by-participant and by-item random intercepts, and by-participant random slopes. Statistical significance is indicated by asterisks.
4.2. discussion
Experiments 1 and 2 suggest that semantics influences the articulation of words, but these experiments leave open the possibility that this effect is due only to the idiosyncratic phonetic structures of the words. Experiment 3 provides evidence against this interpretation. In Experiment 3, we find an effect of semantics on intensity prior to the onset of the target word. As early as three words prior to the target word, sentences with a vocal target word are produced with greater intensity, relative to sentences with a foot target word. This suggests that the effect observed in Experiments 1 and 2 is not only the result of possible differences in phonetic structure between vocal and foot words. In Experiment 3, we also replicate the effect from Experiments 1 and 2 on the target verb: vocal words are produced with greater intensity than foot words. Finally, this experiment provides a novel paradigm for exploring questions related to language production. We found that a word later on in the speech stream had an effect on acoustics earlier on in the sentence. In future work, this effect could be leveraged to explore processes involved in planning in language production.
5. Conclusion
The present studies suggest that the lexical semantics of a word influences the acoustic-phonetic properties of how that word is produced: words linked to high vocal activity are produced with greater intensity than words linked to low vocal activity. These low vocal activity words, in turn, were produced with greater intensity than activity words not associated with articulation. Taken together, these three experiments point to a link between modality specific motor representations and lexical semantics.
This result is consistent with work on situated cognition. Our work is the first to test a general prediction of the relationship between meaning and motor representations in language production. Previous work in language production has demonstrated an effect of situated cognition for isolated words (Shintel et al., Reference Shintel, Nusbaum and Okrent2006), but no study has demonstrated an effect for a broad and open class of words. Given that the effect size is relatively small across these studies, it is unlikely that this effect plays a functional role in communication. Nonetheless, this effect provides a fruitful domain in which to explore the representations underlying lexical semantics.
In particular, our work provides a direct test of the specificity of motor activation from word meaning. Situated cognition makes the critical prediction that the activation of motor representations should be modality specific (the meaning ‘kick’ should not activate motor representations also associated with the meaning ‘yell’). The prior evidence corroborating this prediction is mixed. Although it is typically agreed that some aspects of the motor-perceptual system play a role in representing the semantics of action words, there is less agreement as to whether representations of verbs engage modality-specific cortical areas or higher level, multi-modal brain regions. Many studies that have found a relationship between the motor system and meaning have found effects in premotor cortex rather than M1 (Bedny & Caramazza, Reference Bedny and Caramazza2011). For example, Postle et al. (Reference Postle, McMahon, Ashton, Meredith and De Zubicaray2008) find that while watching actions elicited somatotopic activation of premotor cortex, listening to action words linked to different effectors did not. Instead, responses to action verbs elicited more broadly distributed activation, suggesting that verb meaning is not simulated in brain regions in ways that are equivalent to actually seeing or performing the motor action. These findings from cognitive neuroscience are in contrast with the body of behavioral work in language comprehension that suggest a relationship between modality specific motor representations and the semantics of action words (e.g., Bergen et al., Reference Bergen, Lau, Narayan, Stojanovic and Wheeler2010).
The present set of studies may shed light on this issue. Our results suggest that the activation of motor representations related to word meaning is highly specific. Perhaps an important difference between the present study and previous studies is that the current work uses production to investigate this question rather than comprehension. Although researchers have proposed that some of the mechanisms underlying production and comprehension are shared (Chang, Dell, & Bock, Reference Chang, Dell and Bock2006; Pickering & Garrod, Reference Pickering and Garrod2013), a critical difference between the two is that production necessarily engages motor representations linked to articulation. This link might make relationships between meaning and motor systems that are obscured in language comprehension more apparent in language production.
The present work also presents a novel paradigm for investigating the scope of language production. In the language production literature, there is a great deal of debate surrounding the scope over which linguistic structure is planned (e.g., Brown-Schmidt & Konopka, Reference Brown-Schmidt and Konopka2008; Garrett, Reference Garrett and Bower1975; Griffin, Reference Griffin2001; Smith & Wheeldon, Reference Smith and Wheeldon1999), and there are relatively few methods that are sensitive to representations that are engaged in real-time language production. The data from Experiment 3 suggest that manipulating lexical semantics could serve as a useful tool for querying how scope of planning varies across differing linguistic and contextual contexts. A wider scope of planning might reveal itself by earlier increases in intensity for vocal words as compared to non-vocal words, while a narrower scope of planning would be linked to relatively late differences in intensity. More broadly, these data suggest that the way in which a word is articulated can provide clues to researchers about the underlying processes that are engaged in producing future linguistic material.
In conclusion, we have presented data from three experiments that inform our understanding of the representations of words in the language production system. These results suggest that lexical semantics activate related motor representations. In addition, we present a novel method, utterance production, which can provide insights into the representations that underlie lexical semantics and the scope of language production planning.
APPENDIX A
Stimuli for Experiment 1
Vocalization words (‘L’ denotes low-effort and ‘H’ denotes high-effort)
1. chatting (L)
2. discussing (L)
3. gossiping (L)
4. mumbling (L)
5. talking (L)
6. whispering (L)
7. cheering (H)
8. hollering (H)
9. screaming (H)
10. shouting (H)
11. singing (H)
12. yelling (H)
Foot words
1. dancing
2. hopping
3. jogging
4. kicking
5. marching
6. punting
7. running
8. skipping
9. sprinting
10. stepping
11. stomping
12. walking
APPENDIX B
Analyses with ANOVAs and t-tests
Experiment 1
Using a paired t-test, vocal words were produced with greater intensity than foot words (t(62) = 17.17, p < .0001).
Using a repeated-measure ANOVA, there was a reliable difference between foot words, low-effort vocal words, and high-effort vocal words (F(2,124) = 122.6, p < .0001). Paired t-tests revealed a reliable difference between foot and low-effort vocal words (t(62) = 10.07, p < .0001), and low-effort vocal and high-effort vocal words (t(62) = 4.87, p < .0001).
Experiment 2
Using a paired t-test, vocal words were produced with greater intensity than foot words (t(66) = 9.98, p < .0001).
Using a repeated-measure ANOVA, there was a reliable difference between foot words, mouth words, low-effort vocal words, and high-effort vocal words (F(3,198) = 51.57, p < .0001). Paired t-tests revealed a reliable difference between foot and mouth words (t(66) = 4.21, p < .0001), mouth and low-effort vocal words (t(66) = 3.58, p < .001), and low-effort vocal and high-effort vocal words (t(66) = 4.53, p < .0001).
Experiment 3
Using paired t-tests, the two regions prior to the verb (“the person” and “that’s”) were produced with greater intensity for vocal sentences as compared to foot sentences (t(63) = 3.38, p < .01; t(45) = 5.47, p < .0001). The verb was also produced with greater intensity for vocal sentences as compared to foot sentences (t(63) = 6.15, p < .0001).
APPENDIX C
Means for all acoustic measures for Experiments 1 and 2. Standard deviations are given in parentheses. Reliable differences are bolded
APPENDIX D
Mean effort rating for all critical items in Experiments 1 and 2. Shading indicates semantic condition. Error bars represent 95% confidence intervals.
APPENDIX E
New items included in Experiment 2 (stimuli include critical items from Experiment 1, with the addition of the items below)
Vocalization words (‘L’ denotes low-effort and ‘H’ denotes high-effort)
1. articulating (L)
2. babbling (L)
3. bantering (L)
4. commenting (L)
5. conversing (L)
6. humming (L)
7. mentioning (L)
8. murmuring (L)
9. muttering (L)
10. reciting (L)
11. remarking (L)
12. saying (L)
13. speaking (L)
14. telling (L)
15. uttering (L)
16. arguing (H)
17. debating (H)
18. lecturing (H)
Foot words
1. galloping
2. hiking
3. pacing
4. parading
5. striding
6. strolling
7. strutting
8. trotting
Mouth words
1. biting
2. chewing
3. coughing
4. eating
5. frowning
6. grinning
7. licking
8. puckering
9. smiling
10. smirking
11. tasting
12. whistling
APPENDIX F
Sample picture stimuli used in Experiment 3 in the vocal (left) and foot conditions (right)