INTRODUCTION
Right cerebral hemisphere damage (RHD) due to stroke or trauma frequently results in impairments across a variety of cognitive and communicative skills (Blake, Reference Blake2018). One deficit associated with RHD is aprosodia (Heilman, Bowers, Valenstein, & Watson, Reference Heilman, Bowers, Valenstein and Watson1986; Ross, Reference Ross1981; Weintraub, Mesulam, & Kramer, Reference Weintraub, Mesulam and Kramer1981). Aprosodia refers to deficits in producing and/or understanding the linguistic suprasegmentals or prosodic cues. These cues are produced manipulations of acoustic timing, pitch, and amplitude, which contextualize the message of a spoken utterance within the speaker’s intention and mental state (Lehiste, Reference Lehiste1970; Wells, Reference Wells2006). A classical and enduring observation is that aprosodia that impacts the comprehension and production of emotional content (e.g., sounding happy) appears to uniquely implicate right hemisphere (RH) involvement subsequent to an acquired brain injury (Durfee, Sheppard, Blake, & Hillis, submitted; Heilman, Bowers, Speedie, & Coslett, Reference Heilman, Bowers, Speedie and Coslett1984; Ross, Reference Ross1981, Reference Ross1997, Reference Ross2000; Ross & Monnot, Reference Ross and Monnot2008; Schlanger & Jenkyns, Reference Schlanger and Jenkyns1976; Sheppard et al., Reference Sheppard, Keator, Breining, Wright, Saxena, Tippett and Hillis2020). Incidence estimates of aprosodia subsequent to RHD vary widely from 20% (Blake, Duffy, Myers, & Tompkins, Reference Blake, Duffy, Myers and Tompkins2002) to over 70% (Ferré & Joanette, Reference Ferré and Joanette2016; Sheppard et al., Reference Sheppard, Keator, Breining, Wright, Saxena, Tippett and Hillis2020). This variation can partially be explained by testing at different stroke recovery stages (i.e., acute vs. chronic), as the majority of studies have examined only individuals in the chronic phase.
Speakers of English modulate timing, pitch, and amplitude during a speech to convey three prosodic domains of information to listeners (Peppé, Reference Peppé2009). One domain is grammatical, with functions such as segmenting compound nouns, phrases, clauses and sentences, and distinguishing word forms (e.g., “an OBject” vs. “I obJECT”) and speech acts (e.g., imperatives vs. interrogatives). The second domain is pragmatic, which is used to increase salience or prominence and draw a listener’s attention to a particular word or portion of the message, such as providing clarification while engaged in conversational repair or emphasizing new or contrastive content within an utterance. Pragmatic prosody also includes using or processing cues for turn-taking in conversation. The third domain is affective or emotional, used to convey emotion or attitude, whether regarding the content of the message or incidental to it. In the RH literature (e.g., Brådvik et al., Reference Brådvik, Dravins, Holtås, Rosen, Ryding and Ingvar1991; Walker, Daigle, & Buzzard, Reference Walker, Daigle and Buzzard2002; Walker, Pelletier, & Reif, Reference Walker, Pelletier and Reif2004), the former two domains are typically combined into a single category called “linguistic prosody,” and the latter is identified as “emotional prosody.” Further, these domains may be used in concert. For example, one might angrily [emotional] ask a question [grammatical] with emphasis on a particular word [pragmatic] (e.g., “Why didn’t YOU take the trash out?”).
Even among healthy adults, producing unambiguous prosodic cues and appraising prosodic information when listening are performed imperfectly, which may result in subtle or substantial breakdowns of communication (Orbelo, Testa, & Ross, Reference Orbelo, Testa and Ross2003; Ross, Shayya, & Rousseau, Reference Ross, Shayya and Rousseau2013). For example, a speaker may use sarcasm that is not identified as such by the listener, or a listener’s own bias could lead to an appraisal of a speaker as sad when the intonation being used instead reflects being tired. However, those without brain damage are able to utilize more readily a broader array of cognitive and linguistic skills to detect breakdowns and engage in conversational repair through adaptation to the listener, clarification, and restatement. In contrast, aprosodia in RHD exists within the broader constellation of additional potential cognitive and communication deficits that negatively affect many of the same skills, which are needed to detect, adapt, and repair in conversation. For instance, attention, memory, and executive functioning deficits may impact up to 65% of individuals with RHD, and visual perception and construction deficits occur even more frequently (Blake et al., Reference Blake, Duffy, Myers and Tompkins2002). Additionally, among individuals with RHD, an estimated 26% will show basic expressive and receptive language deficits and nearly 70% will demonstrate speech production deficits (dysarthria) (Blake et al., Reference Blake, Duffy, Myers and Tompkins2002; Hillis Trupe & Hillis, Reference Hillis Trupe and Hillis1985). Importantly, deficits either in the appropriate production or in the understanding of these prosodic layers of spoken language result in considerable difficulties navigating spoken interactions linguistically and socially in real time, negatively impacting activity participation and relationships (Baldo, Kacinik, Moncrief, Beghin, & Dronkers, Reference Baldo, Kacinik, Moncrief, Beghin and Dronkers2016; Blonder, Pettigrew, & Kryscio, Reference Blonder, Pettigrew and Kryscio2012; Hewetson, Cornwell, & Shum, Reference Hewetson, Cornwell and Shum2018).
Given the diversity of circumstances and often simultaneously co-occurring layers of meaning in which prosodic cues are used, not to mention the minute granularity with which acoustic features are shifted by their production, it is no surprise that prior studies have generated a mottled landscape of contrasting methods and inconsistent findings with regard to the extent and nature of aprosodia that individuals with RHD experience (e.g., Weed & Fusaroli, Reference Weed and Fusaroli2020). What has appeared fairly clear is that deficits in linguistic and emotional prosody are dissociable, leading to a fundamental bifurcation in the prosody literature in which these categories of prosody are often examined independently.
The general consensus is that RHD has the potential to impact either comprehension or expression of emotional prosody, and sometimes both (Blake, Reference Blake2018; Tompkins, Klepousniotou, & Gibbs Scott, Reference Tompkins, Klepousniotou and Gibbs Scott2012). Whether or not linguistic prosody is similarly affected is not clear. Clinically, it is important to understand the incidence and presentation of aprosodia given the substantial social implications (e.g., decreased social participation across occupational, interpersonal, and independent living domains; Hewetson et al., Reference Hewetson, Cornwell and Shum2018), especially if the prevalence of communication impairment in RHD is as high as suggested from recent work (50–90% of patients; Ferré & Joanette, Reference Ferré and Joanette2016; Sheppard et al., Reference Sheppard, Keator, Breining, Wright, Saxena, Tippett and Hillis2020). This study details findings from a systematic review for the past 50 years of investigations into aprosodia after RHD, critically examining research comparing the prosodic abilities of individuals with RHD to those with no brain damage (NBD). The specific aims of our systematic review were as follows:
-
1. To identify which aspects of prosody are negatively affected (in accuracy or response time) subsequent to RHD. Aspects of prosody examined included receptive and expressive linguistic prosody (grammatical and pragmatic) and receptive and expressive emotional prosody. When possible, meta-analysis methods were used to identify significant differences between those with RHD versus NBD.
-
2. To evaluate the methodological quality of the studies that compared the prosodic abilities of individuals with RHD versus NBD and relatedly, we examine whether the methodological quality is associated with the significance of RHD/NBD group contrasts. Study quality was quantified based on ratings from a study quality rubric and on a sample/contrast ratio (i.e., participant sample size divided by the number of group contrasts/comparisons within a given study). The goal of this aim is to provide further context for the interpretation of significant differences and effect size estimates within the literature examined.
METHODS
The systematic review and meta-analysis utilized to address these aims were conducted as part of a larger effort by members of the Right Hemisphere Disorders Writing Group (RHDWG), which is a part of the Evidence-Based Clinical Research Committee of the Academy of Neurological Communication Disorders and Sciences. The current focus on the presence and characteristics of prosodic deficits is one of the questions situated within a larger RHDWG project examining RHD, which also aims to investigate the contrast between prosodic characteristics associated with RHD and left hemisphere damage (LHD) and the relationship between lesion localization patterns and aprosodia subtypes (Durfee et al., Reference Durfee, Sheppard, Blake and Hillissubmitted). Some search and review stages were common to all aspects of the larger project, whereas others were specific to individual research questions. Procedures common to all investigations within the project are presented here in full (including supplementary information). For clarity in distinguishing between common and specific methods, article selection criteria and rationales specific to this analysis are described in the Database search section of the Results.
Database Search
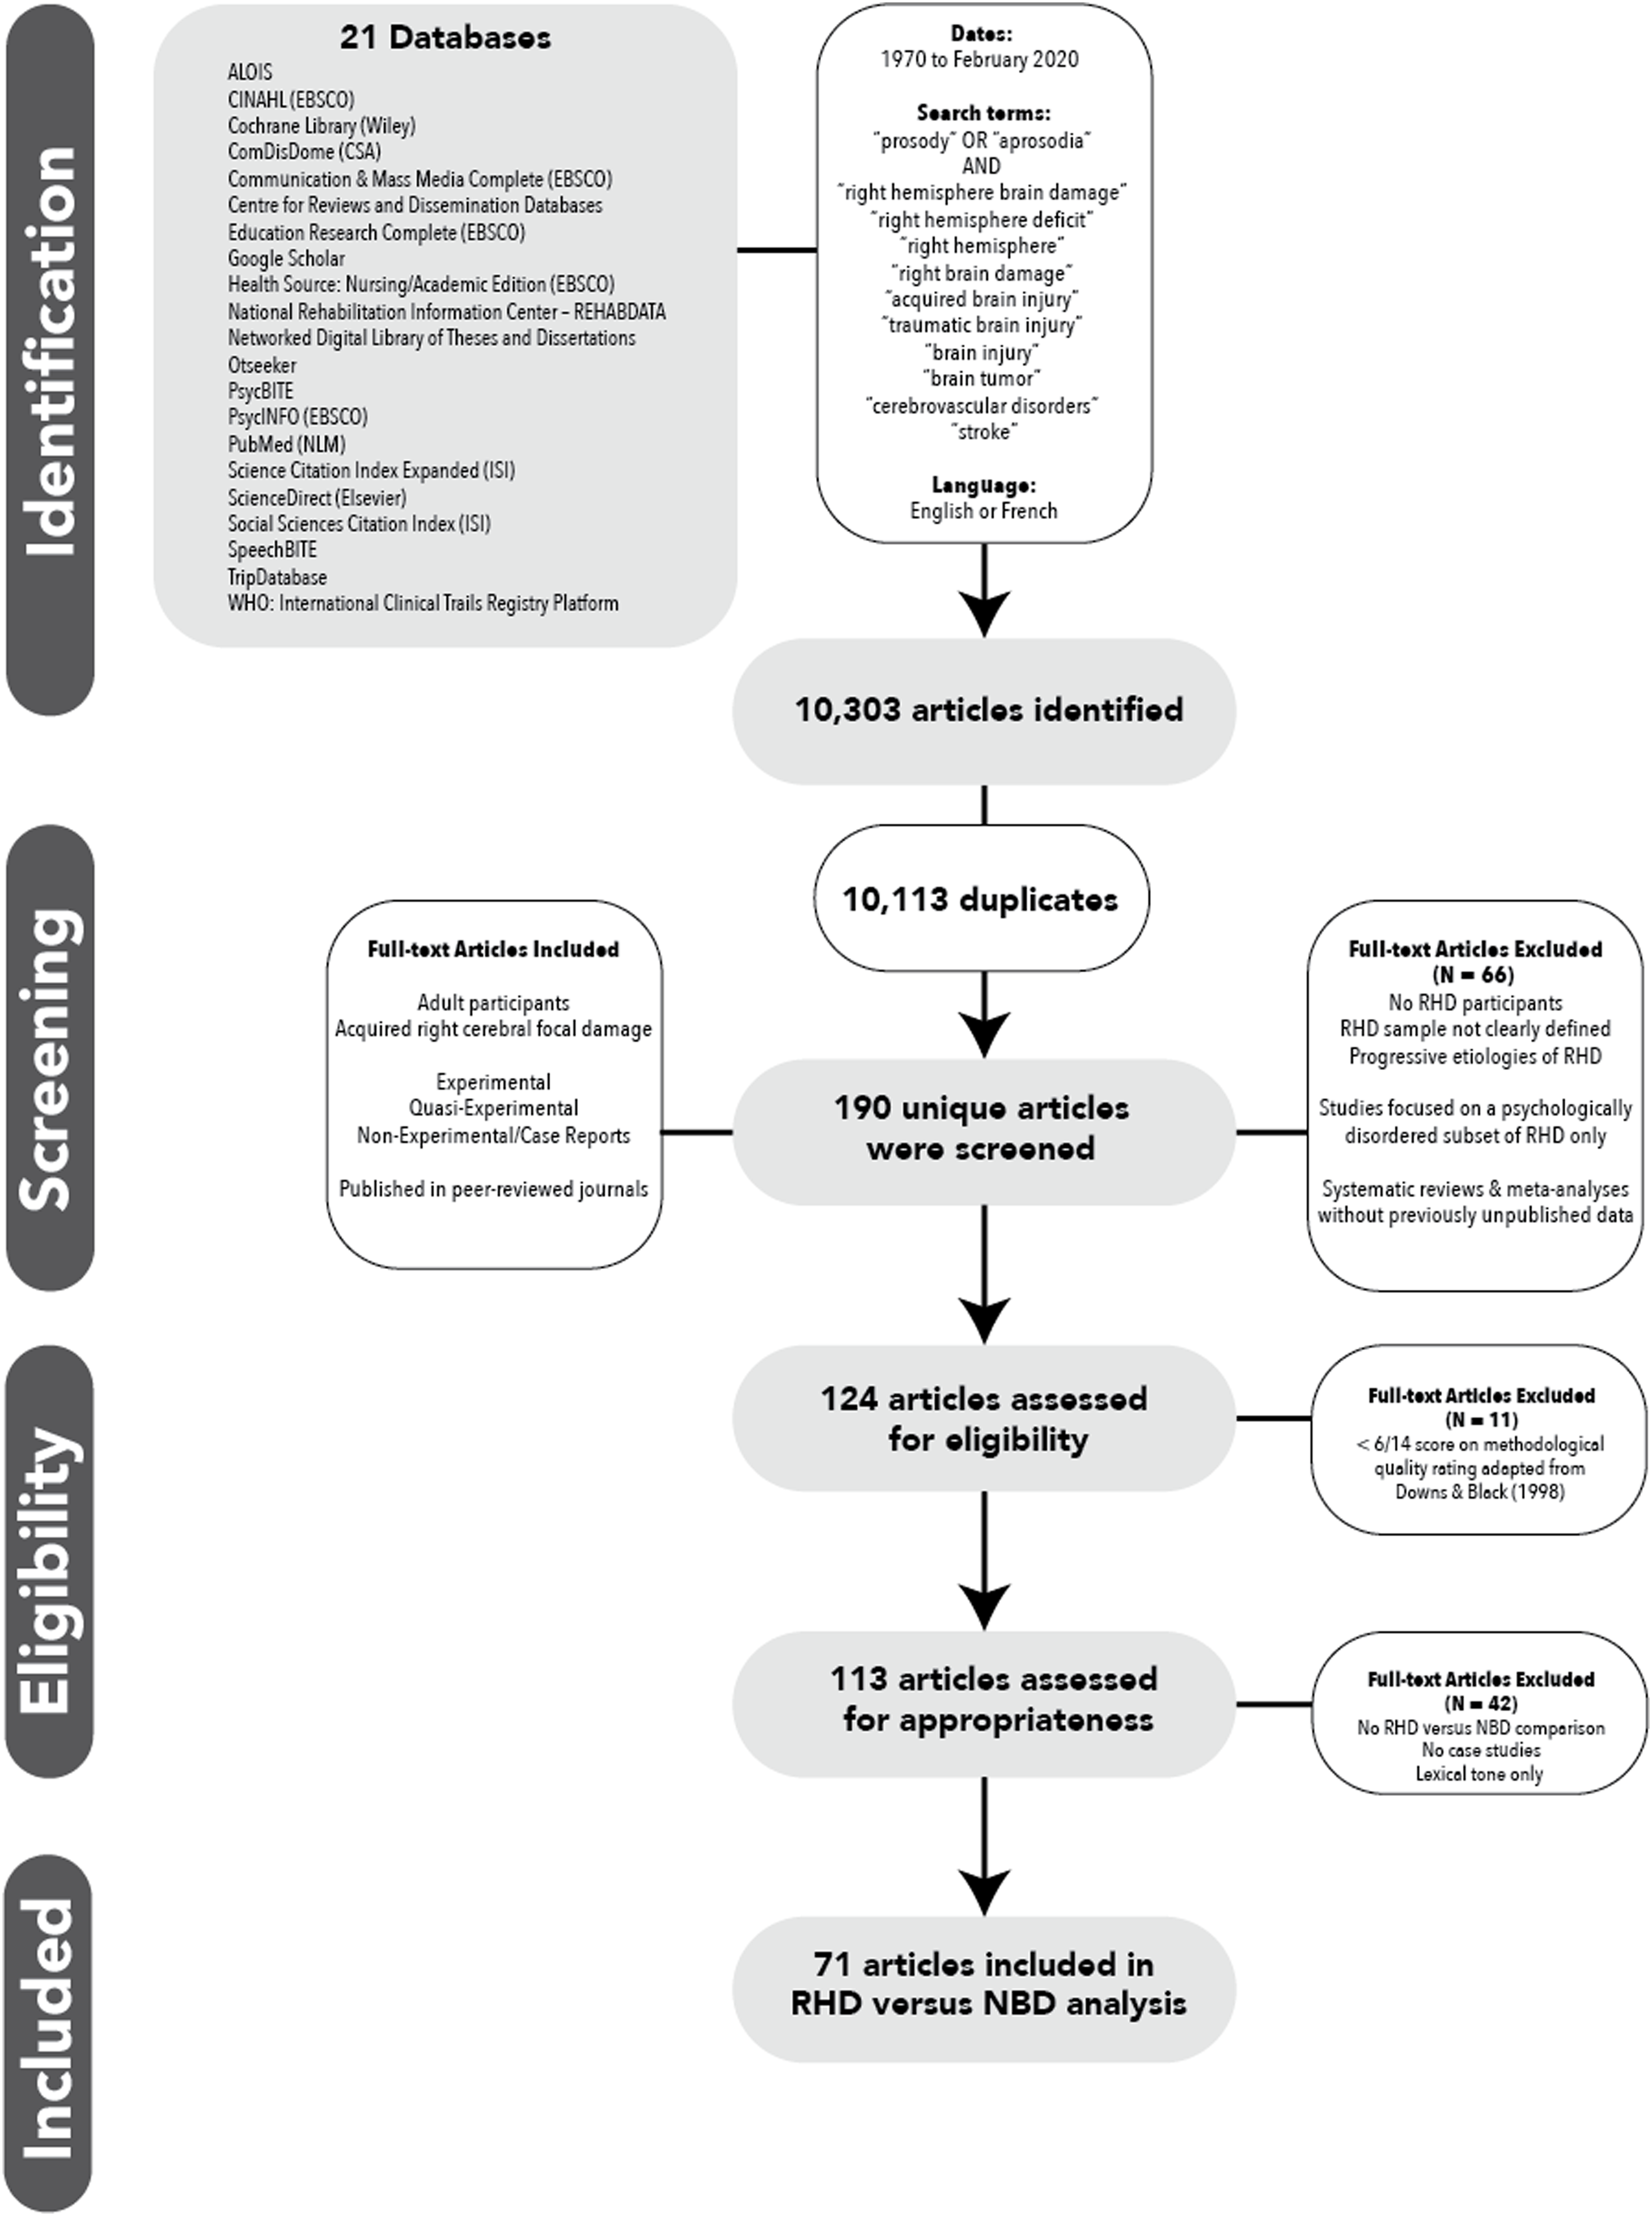
Twenty-one electronic databases were searched to identify articles from 1970 to February 2020 by entering keywords and subject headings including “prosody” OR “aprosodia” AND “right hemisphere brain damage” OR “right hemisphere deficit” OR “right hemisphere” OR “right brain damage” OR “acquired brain injury” OR “traumatic brain injury” OR “brain injury” OR “brain tumor” OR “cerebrovascular disorders” OR “stroke” (Figure 1). These databases and search terms were selected by members of the RHDWG.
Preferred Reporting Items for Systematic Reviews and Meta-Analyses (PRISMA) flow diagram.
Inclusion Criteria
Population-based inclusion criteria were as follows: (a) studies had to include adults (age 18 or over) who, based on reported lesion location, had acquired focal brain damage to the RH in cortical and/or subcortical parts of the brain; (b) damage could be due to stroke, tumor, or surgery (e.g., AVM repair) that resulted in relatively focal RH damage; and (c) in studies with mixed patient groups (e.g., RHD, cerebellar, LHD), information on the RHD participants was provided quantitatively and separately. There was no requirement for study participants to have a clinical diagnosis of aprosodia or evidence of other cognitive or communication deficits.
Publication-type inclusion criteria addressed publications from 1970 to present (including articles in press), written in or available in English or French, full study (no abstracts) published in a peer-reviewed journal, and had to include original data that addressed one or more of the larger project’s questions. Research design could be experimental, quasi-experimental, or nonexperimental (e.g., case study).
Exclusion Criteria
Articles were excluded if they included only animal models, did not include a clearly identified sample with RHD, included participants with progressive etiologies that may or may not affect cognition, or exclusively examined individuals with psychological disorders. Studies that did not include prosody as the primary topic of interest were excluded, as were studies that examined mixed samplings of disorders or lesion locations unless findings specific to RHD participants could be separated. Systematic reviews and meta-analyses that did not provide new (previously unpublished) data also were excluded.
Article Screening
Multiple rounds of reviews were conducted to determine (a) appropriateness for the broad topic of prosody and RHD; (b) methodological quality; and (c) compatibility with the specific aims of the current systematic review (i.e., aprosodia presence/characteristics). Research assistants screened article titles and abstracts as the first-pass application of inclusion and exclusion criteria. Articles that passed screening were disseminated to the RHDWG members and their research teams to review the full articles for inclusion and exclusion criteria and to extract basic information about each article and centralize it for further review.
The 124 articles that passed the first 2 coarse selection filters (i.e., first-pass application of the criteria and full-text review) then were assessed for quality of methodology. Two RHDWG members and their research teams independently judged the methodological quality of each of these articles, using a rubric adapted from Downs and Black (1998) that included 14 items related to participant description, dependent and independent variables, and research methods (see Supplement A). Overall summed ratings had a maximum of 22 points and were further qualitatively divided as follows: 0–7 weak, 8–15 moderate, 20–22 strong. No a priori minimum score was set due to uncertainty of the general quality of studies published in this area.
After all scores were obtained, studies for which overall ratings by the two judging parties differed by more than two points were reconciled by a third rater who examined the two ratings and provided a third rating (not independent); the outlying rating among the three was dismissed. This was necessary for 12 (10%) of the 124 papers reviewed. The ratings resulting from this multistage process had inter-rater reliability of 93.5% absolute agreement based on a two-way mixed intra-class correlation using an alpha model. The two ratings were then averaged to produce the quality score reported in Tables 1 and 2. An a posteriori decision was made to exclude studies if their total quality rating score was weak. This resulted in the exclusion of 11 publications (9% of the 124 that received ratings).
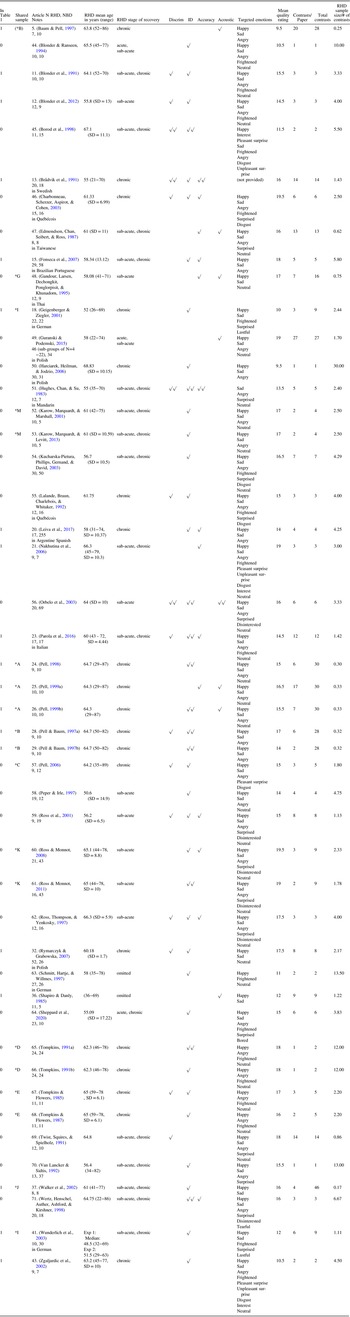
Summary of linguistic prosody findings

Cells with √ if the authors reported at least one significant finding among contrasts between RHD and NBD participants in that domain, and √√ if there were only non-significant findings among contrasts. Blank cell indicates that the authors did not examine that contrast. Contrasts per paper refer to the number of contrasts to which participants were subjected within a certain manuscript. In consideration of the high number of papers that reported on the same sample across manuscripts, a second column, Total Contrasts, was calculated to estimate the number of contrasts a given sample was subjected to across all manuscripts where the same sample was used. For Shared sample column, RHD shared sample = * and RHD suspected shared sample = (*).
Summary of emotional prosody findings

Cells with √ if the authors reported at least one significant finding among contrasts in that domain, and √√ if there were only non-significant findings among contrasts. Contrasts per paper refer to the number of contrasts to which participants were subjected within a certain manuscript. In consideration of the high number of papers that reported on the same sample across manuscripts, a second column, Total Contrasts, was calculated to estimate the number of contrasts a given sample was subjected to across all manuscripts where the same sample was used. For Shared sample column, RHD shared sample = * and RHD suspected shared sample = (*).
Planned Analyses
To provide a comprehensive examination of the literature, the planned analyses were as follows. First, all included publications were subject to description and an inventory of the group comparisons (“contrasts”) described by the authors (Tables 1 and 2). Second, sample effect sizes were calculated using R (Lüdecke, Reference Lüdecke2018). Hedge’s g was selected as the effect size measure in appreciation of the typical sample size used within the RHD literature. Part of the family of effect sizes based on standardized mean differences (Rosenthal, Cooper, & Hedges, Reference Rosenthal, Cooper and Hedges1994), Hedge’s g corrects for bias in population effect size estimates by relying on a sample size-weighted pooled standard deviation. This is a particularly relevant correction to Cohen’s d when the population effect size estimate would be grossly overestimated due to small constituent sample sizes (n < 20; Cumming, Reference Cumming2013; Hedges & Olkin, Reference Hedges and Olkin2014). Where range was reported in lieu of standard deviation for dependent outcome variables, the standard deviation was estimated as one-quarter of the range for effect size calculations.
During the process of screening for eligibility, two significant concerns arose that influenced the interpretation of findings. First, it was observed that few studies statistically controlled for repeated measures or multiple comparisons. That is, many articles reported on an array of prosodic domains and tasks within the same patients, including both linguistic and emotional manipulations (sometimes simultaneously). Whereas, some of these articles reported exact p-values (which would have allowed for thresholds of significance to be reconsidered), many did not. Second, multiple research groups reported on the same or overlapping small samples of RHD participants across publications. As not all of a given research groups’ works were considered for our analyses and not all research groups explicitly acknowledged this practice, estimating the full extent of this behavior in the literature as a whole was not possible. Nevertheless, we have both estimated the incidence of reuse of participants in the literature, and we analyzed and noted when samples were reused in whole or part across papers within the scope of our review (Tables 1 and 2, “Shared Sample”). A minimum of 32/76 (42%) of the articles shared RHD samples either in part or whole; in the remaining articles, it was not possible to determine the presence or extent of overlapping participants. Although the true scope of these problems (i.e., failure to statistically control for multiple comparisons; reuse of participants across publications) is unknowable, what we could observe of these two behaviors was so pervasive that simply excluding articles that were “tainted” by these two concerns would have essentially rendered meta-analysis impossible.
Repeated measures and overlapping samples result in nonindependent effect sizes (Cheung, Reference Cheung2019), which render it difficult to quantify study-wide alpha and the degree to which Type II error is inflated within a given article and result in an underestimation of variance when calculating the average effect (López-López, Van den Noortgate, Tanner-Smith, Wilson, & Lipsey, Reference López-López, Van den Noortgate, Tanner-Smith, Wilson and Lipsey2017). However, as so little is known about prosodic changes in RHD and correlations between outcome variables were not reported in any article included in our review, we were unable to account for these concerns statistically in the calculation of the grand mean by using multivariate meta-analysis. Thus, instead, we have endeavored to provide a transparent description of these factors when they arose.
Tables 1 and 2 endeavor to provide the best available accounting of the scale of inflated study-wide alpha and include (a) total number of prosody contrasts within a given article (“Contrasts/Paper”Footnote 1 ); (b) total contrasts to which a given sample was subjected across articles within the meta-analysisFootnote 2 where those same participants appear (“Total Contrasts”); and (c) the proportion of RHD sample size to contrasts (“Sample/Contrasts”). If the authors reported more contrasts than participants with RHD, “Sample/Contrasts” was < 1 (24% of articles with a range of 0.17–0.88, predominantly stemming from only three research groups). When a sample was reused across publications (either explicitly stated or easily discerned), the RHD sampling was identified by a unique letter in “Shared Sample”, to allow readers to trace the use of a given sample across publications.
When calculating within-domain effect size estimates (linguistic vs. emotional domains of prosody) for which a minimum of five contrasts was available for effect size calculations, estimates of effect size within the population were made based on a random effects model using the Hartung–Knapp–Sidik–Jonkman inverse variance method (i.e., Sidik–Jonkman estimator for τ 2; Q-profile method for the confidence interval of τ and τ 2; Hartung–Knapp adjustment for random effects model). Contrasts were divided into the categories at the level of structure and function: grammatical prosody at the word level, grammatical and pragmatic prosody at the phrase level, grammatical prosody to signal speech acts, and emotional prosody, and then identified by task design: comprehension (discrimination and identification) and production (accuracy and acoustic features). Notably, this method of meta-analysis assumes independent effect sizes, so it must be considered that these variance estimates likely are underestimates, which remains a limitation of the present meta-analysis. However, this strategy has precedence for circumstances in which contrasts are dependent, but not overlapping, with sufficient frequency within given studies/samples to calculate correlations, and correlations are unknown (Abramovitch, Anholt, Raveh-Gottfried, Hamo, & Abramowitz, Reference Abramovitch, Anholt, Raveh-Gottfried, Hamo and Abramowitz2018; Belleville, Fouquet, Hudon, Zomahoun, & Croteau, Reference Belleville, Fouquet, Hudon, Zomahoun and Croteau2017; Weissberger et al., Reference Weissberger, Strong, Stefanidis, Summers, Bondi and Stricker2017). Where fewer than 5 contrasts were available, results were only described.
Pursuant to our second specific aim, we examined whether ratings of study quality were correlated significantly with the reporting of significant findings at the level of single contrasts. This analysis was completed using point-biserial correlations, treating the reported α as a categorical threshold and both sample/contrast ratio and quality rating as continuous variables.
RESULTS
Database Search
The results of the systematic database search are reported in Figure 1, which is consistent with the PRISMA protocol (Liberati et al., Reference Liberati, Altman, Tetzlaff, Mulrow, Gøtzsche, Ioannidis and Moher2009). Of the 113 articles appraised as eligible and appropriate for inclusion for the project as a whole based on the inclusionary, exclusionary, and methodological quality criteria described above, additional criteria were applied based on the specific aims of the present systematic review and meta-analysis, in particular, namely to estimate population effect sizes for the contrast between RHD and NBD across prosodic domains and provide a fair appraisal of study quality. Forty two were excluded from the analysis following full-text review because there were no direct comparisons between RHD and NBD groups, only a single person with RHD was reported on compared to only a single control subject (n = 6; case studies were included if compared either to a control group or to normal performance on a standardized measure), or the focus was on tonal language processing as opposed to prosody in a nontonal language (n = 5), resulting in 71 articles undergoing data extraction. Forty-three articles addressed linguistic prosody (Table 1), 47 articles addressed emotional prosody (Table 2), and 19 articles addressed both.
RHD Participant Sample Characteristics
Participants with RHD had a mean age of 61 ± 5 years (Table 1). Not all papers provided sufficient information to calculate the mean age of controls. Of those that did (54/71 papers), 6 (articles 9, 18, 48, 54, 59, and 62) described markedly younger control groups than their RHD groups. Many papers provided a comparison of ages using analyses of variance including an RHD group and an LHD group together (i.e., not reporting a direct contrast of control participants’ and RHD participants’ ages). Given those limitations, a mean age of 58 ± 9 years was calculated among the controls. The overwhelming majority of studies (n = 57) reported on RHD participants in the chronic phase of recovery (3 or more months since the neurological injury, reported range: 3 months–15 years post-onset); 30 studies included participants in the subacute recovery phase (more than 1 week but under 3 months). Only three studies included any participants considered to be in the acute phase of recovery (i.e., within 7 days of stroke; articles 44, 49, and 64). Many studies reported on patients at a combination of phases of recovery (i.e., both subacute and chronic). Three studies did not report on the time post-onset of their participants (articles 19, 36, and 63). The vast majority of studies had small sample sizes (mean n = 12, SD = 6; median n = 9) with unreported or heterogeneous lesion etiology, size and number, and RH location.
Within the 70 articles examined for the present analysis, 41 (59%) provided participant-level data for a total of 363 individuals with RHD, representing approximately 35 unique samples from the population (some samples overlapped in whole or part). The amount of detail provided at the individual level varied widely across studies. Descriptions of lesion size and location, even in broad terms (e.g., “frontal”) or inferred from patterns of deficit in the absence of imaging, were provided for 75% of patients described.
Not including circumstances where participants were excluded on the basis of individual differences (e.g., handedness), of the 363 individuals with RHD described, 3 were identified as left-handed, age was reported for 87%, gender was reported for 74%, time post-onset was reported for 83%, education was reported for 41%, hemiparesis status was reported for 32%, and presence of left neglect was reported for 39%. These were by far the most commonly provided demographic and clinical characteristics. Diverse, short clinical descriptions (e.g., notes on affect, attention, memory, speech, dysphagia; scores on the Western Aphasia Battery or other standardized assessments of language and cognition) also were fairly common and provided for 43% of participants described. Any description of individual performance on the tasks used pursuant to the authors’ aims was uncommon across articles (31%). This was particularly concerning given the ubiquitous heterogeneity of lesion and clinical characteristics across individuals with RHD within a given sample.
Grand ρ Effect Estimate: Differences in Prosody in RHD
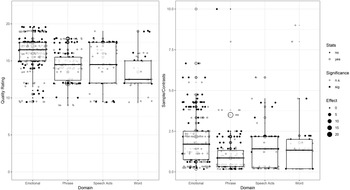
Figure 2 shows quality ratings and effect sizes for all included studies (n = 70). For readability and visualization, constituent forest plots are divided by the prosody domain. Linguistic prosody was divided into grammatical (word and phrase levels) and pragmatic domains based on the tasks employed. Across all domains of prosody, the effect estimate was g = 2.51 [95% CI (1.94, 3.09), t = 8.66, p < 0.0001; heterogeneity: I 2 = 91.1% 95% CI (90.0%; 92.2%), τ 2 = 11.18 (7.20; 13.96), p < 0.0001], based on 129 contrasts, indicating a significant random effects model. Overall, studies of higher quality (r pb = 0.18, p < 0.001, n = 459) and higher sample/contrast ratio (r pb = 0.25, p < 0.001, n = 459) were modestly more likely to report significant differences in contrasts between RHD and NBD participants. Although the magnitude of effect size calculated provides evidence of a deficit, interpretations of the observed magnitude must be tempered by the previously described, significant methodological concerns and qualitative limitations associated with the constituent data used to arrive at this value.
Quality ratings and proportion of sample size/contrasts (including effect sizes where available) for all included contrasts across prosody domain. Where available, effect sizes are represented in scale using unfilled points.

Linguistic Prosody
Word level
At the word level, prosodic stress is used to distinguish compound nouns from noun phrases (e.g., “hot dog” referring to either a sausage or a dog in the sun) and word class, as in discriminating English nouns from verb derivatives (e.g., REbel vs. reBEL). Thirteen articles examined word-level prosody (Figure 3): 3 examined discrimination tasks (articles 13, 35, 40; 4 contrasts), 6 examined identification tasks (articles 2, 3, 6, 13, 14, 37; 8 contrasts), 4 examined RHD speakers’ productions for accuracy, as determined by NBD raters or standardized stimulus sets (articles 9, 13, 14, 39; 5 contrasts), and 7 examined acoustic features of speakers’ productions (articles 2, 4, 9, 14, 22, 30, 39; 24 contrasts).
Quality ratings and proportion of sample size/contrasts (including effect sizes where available) for all word-level prosody contrasts. Where available, effect sizes are represented in scale using unfilled points.

Overall, only 32% of contrasts yielded a significant difference between RHD and NBD performance of word-level prosody. Only four articles provided sufficient information to calculate an effect size. As this was below our threshold to calculate a weighted mean effect size (population effect size estimate), we examined whether better designed studies tended to report significant contrasts. Studies of a higher quality (r pb = 0.47, p = 0.002, n = 41) were significantly positively correlated with significant contrasts. The relationship between significant contrasts reported and sample/contrast ratio was not statistically significant (r pb = -0.04, p = 0.80, n = 41).
Phrase level
At the phrase level, prosodic stress is used to signal clausal boundaries (e.g., listen to the choirboy vs. listen to the choir, boy), to signal turn-taking in conversation, and to emphasize new or contrasting information (“Leave the gun. TAKE the cannoli.”). Twenty-six articles examined phrase-level prosody (Figure 4): 5 examined discrimination tasks (articles 13, 32, 38, 40, 41; 18 contrasts), 10 examined identification tasks (articles 1, 3, 7, 13, 18, 19, 24, 27, 37, 41; 17 contrasts), 10 examined production accuracy (articles 7, 13, 16, 25, 27, 33, 34, 39, 40, 42; 19 contrasts), and 13 examined acoustic features of productions (articles 7–10, 16, 17, 22, 25, 26, 31, 33, 34, 39; 72 contrasts).
Quality ratings and proportion of sample size/contrasts (including effect sizes where available) for all phrase-level prosody contrasts. Where available, effect sizes are represented in scale using unfilled points.

Of the 126 contrasts addressing phrase-level prosody, 41 were significant (32.5%), a rate similar to that reported above for word-level prosody. Eighteen significant contrasts (10 addressing receptive prosody, 8 addressing expressive prosody) provided sufficient information to calculate Hedge’s g (Figure 5). Neither studies of a higher quality (r pb = 0.07, p = 0.42, n = 126) nor sample/contrast ratio (r pb = 0.16, p = 0.07, n = 126) were more likely to report significant results.
Forest plot for phrase-level prosody contrasts.

Speech acts
Speakers use prosodic features to indicate the illocutionary force of a given speech act, both in combination with canonical syntax and independently to create layers of intent and meaning. For example, in English, utterances intended to have interrogative force generally contain an upward pitch contour toward the end. This distinguishes requests for information in earnest (e.g., Speaker 1: “Make the cheque out to John C. Reilly.” Speaker 2: “What day is IT?”) from exclamations (e.g., Speaker 1: “Today is my turtle’s 100th birthday!” Speaker 2: “WHAT day is it!?”) and declarative statements (e.g., “Speaker 1: “What kinds of questions do you ask?” Speaker 2: “What DAY is it? What MONTH is it?”). Seventeen articles examined speech act prosody (Figure 6): 5 examined discrimination tasks (articles 11–13, 28, 32; 11 contrasts), 9 examined identification tasks (articles 13, 15, 20, 23, 26, 28, 32, 37, 43; 25 contrasts), 7 production accuracy (articles 13, 15, 20, 21, 23, 39, 40; 11 contrasts), and 4 examined the acoustic features of productions (articles 5, 25, 36, 39; 25 contrasts).
Quality ratings and proportion of sample size/contrasts (including effect sizes where available) for all speech act prosody contrasts. Where available, effect sizes are represented in scale using unfilled points.

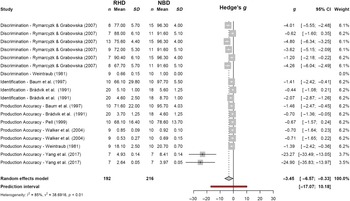
Of the 72 contrasts addressing speech act prosody, 39 were significant (54%). Twenty-seven significant contrasts (25 addressing receptive language, 2 addressing expressive language) provided sufficient information to calculate Hedge’s g (Figure 7). Studies of a higher quality (r pb = 0.39, p = 0.001, n = 72) and higher sample/contrast ratio (r pb = 0.40, p = 0.01, n = 72) were more likely to report significant results.
Forest plot for speech act prosody contrasts. In contrast marked with an asterisk, inverted performance (RHD > NBD) was both anticipated and observed due to the nature of the dependent variable (e.g., response time, latency, ordinal scales in which higher values denote increased severity).

Emotional Prosody
Forty-seven articles examined emotional prosody (Figure 8): 16 examined discrimination tasks (articles 11–13, 23, 28, 32, 45, 46, 51, 55–57, 59, 62, 67, 69; 41 contrasts), 38 examined identification tasks (articles 11–13, 15, 18, 20, 23, 24, 28, 29, 32, 37, 41, 43–46, 50–68, 70, 71; 77 contrasts), 14 production accuracy (articles 13, 15, 20, 21, 23, 25, 46–48, 51, 59, 60, 62, 71; 29 contrasts), and 8 examined the acoustic features of productions (articles 5, 25, 26, 36, 47–49, 56; 76 contrasts).
Quality ratings and proportion of sample size/contrasts (including effect sizes where available) for all emotional prosody contrasts. Where available, effect sizes are represented in scale using unfilled points.

Of the 225 contrasts addressing emotional prosody, 130 were significant (58%). Eighty significant contrasts provided sufficient information to calculate Hedge’s g: 65 addressing receptive language (24 discrimination tasks and 41 identification tasks; Figures 9 and 10, respectively) and 15 addressing expressive language (10 assessments of production accuracy and 5 assessments of production acoustics; Figure 11). Across task designs, the effect estimate for emotional prosody was g = 2.48 [95% CI (1.76, 3.20), t = 6.88, p < 0.0001; heterogeneity: I 2 = 91.9% 95% CI (90.6%, 93.1%), τ 2 = 9.93 (6.89, 14.30), p < 0.0001]. Studies of a higher quality were not more likely to report significant results (r pb = 0.07, p = 0.29, n = 225). However, higher sample/contrast ratio (r pb = 0.23, p < 0.001, n = 225) was positively correlated with significant results.
Forest plot for emotional prosody discrimination contrasts. In contrasts marked with an asterisk, inverted performance (RHD > NBD) was both anticipated and observed due to the nature of the dependent variable (e.g., response time, latency, ordinal scales in which higher values denote increased severity).

Forest plot for emotional prosody identification contrasts. In contrast marked with an asterisk, inverted performance (RHD > NBD) was both anticipated and observed due to the nature of the dependent variable (e.g., response time, latency, ordinal scales in which higher values denote increased severity).

Forest plot for emotional prosody production contrasts. In contrast marked with an asterisk, inverted performance (RHD > NBD) was both anticipated and observed due to the nature of the dependent variable (e.g., response time, latency, ordinal scales in which higher values denote increased severity).

GENERAL DISCUSSION
The overall purpose of this systematic review and meta-analysis was to identify the prosody deficits observed subsequent to RHD by examining the extant literature in which RHD and NBD groups were compared while performing prosodic tasks. We additionally examined the methodological quality of the studies, including whether our indicators of study quality were associated with the significance of RHD/NBD group comparisons or contrasts. The present work provides a number of foundational affirmations about the nature of prosodic deficits in RHD, both deficits and relative strengths, as well as highlights prosodic domains in need of additional empirical investigation.
The evidence for deficits affecting grammatical prosody at the word level following RHD is negligible, both due to relatively few studies examining this domain and minimal evidence of significant differences between RHD and NBD groups. This was true of both production and comprehension (identification and discrimination) tasks. While not the immediate focus of this investigation, anecdotally, the use of prosody to discriminate between compound nouns and noun phrases appears settled as a function relatively robust to RHD. The same cannot be said for noun-verb word-level prosodic differences. This remains as an area where further study is warranted.
Considering larger units of language, there was limited evidence uncovered by our analysis to support that RHD significantly impairs phrase-level prosody. Phrase-level prosodic manipulations are used to convey syntactic and clause boundaries as well as emphatic stress, literal versus idiomatic meaning, and the declination that signals turn-taking. Discrimination and identification were not significantly impaired among RHD participants in any of the studies with adequate data to analyze. In contrast, substantial impairments in the accuracy of production were found in a single article that examined differential production of phrases to convey idiomatic versus literal meanings (Yang, Sidtis, & Yang, Reference Yang, Sidtis and Yang2017). It remains likely that across studies, methodological differences may, at least in part, influence whether significant RHD/NBD group contrasts are found. For example, Yang et al. (Reference Yang, Sidtis and Yang2017) reported that seven Korean speakers with chronic RHD were judged by young healthy listeners as less accurately producing elicited idioms than healthy age-matched controls, based on both blinded identification and a 5-point goodness scale. In contrast, Brådvik et al. (Reference Brådvik, Dravins, Holtås, Rosen, Ryding and Ingvar1991) reported that 20 Swedish speakers with subacute to chronic RHD showed no difference in their production of clausal boundaries within a phrase when compared to healthy age-matched controls, based on closed correct-incorrect classifications by trained speech therapists. Though these differences raise important questions regarding the design of such studies, the ability to examine the effects of these methodological decisions systematically was beyond the scope of the present analyses.
Deficits in the discrimination and identification of prosodic indicators of speech acts were apparent, with significant differences in over half of the RHD/NBD group contrasts. Whereas, the vast majority of these significant contrasts were from a single article (Rymarczyk & Grabowska, Reference Rymarczyk and Grabowska2007), it was one of the largest studies in our systematic review and meta-analysis, with 52 participants divided into subgroups based on the location of lesion and sex. Accuracy in producing prosodic indicators of speech acts was minimally impaired among RHD participants in the two studies with analyzable data (Brådvik et al., Reference Brådvik, Dravins, Holtås, Rosen, Ryding and Ingvar1991; Fonseca, Fachel, Chaves, Liedtke, & Parente, Reference Fonseca, Fachel, Chaves, Liedtke and Parente2007).
Finally, and unsurprisingly, the current systematic review and meta-analysis results confirm consistent evidence for emotional prosody deficits in the RHD population (Blonder, Bowers, & Heilman, Reference Blonder, Bowers and Heilman1991; Heilman et al., Reference Heilman, Bowers, Speedie and Coslett1984). RHD participants performed significantly more poorly than NBD participants on emotional prosody discrimination and identification tasks; likewise, significant group contrasts were identified in emotional prosody production accuracy and in the manipulation of the acoustic properties which signal emotional prosody.
Further research is necessary to determine underlying mechanisms of aprosodia and whether these aid in explaining the tendency for RHD to affect emotional versus linguistic forms of prosody. Evidence from two disparate RHD literature sources suggests that perceptual, motoric, and cognitive factors are at play: Rosenbek and colleagues (Rosenbek et al., Reference Rosenbek, Crucian, Leon, Hieber, Rodriguez, Holiway and Gonzalez-rothi2004; Rosenbek, Rodriguez, Hieber, & Leon, Reference Rosenbek, Rodriguez, Hieber and Leon2006) reported improvements in emotional prosody production following either motoric-imitative or cognitive-affective treatments, and Wright and colleagues (Wright, Saxena, Sheppard, & Hillis, Reference Wright, Saxena, Sheppard and Hillis2018) identified selective impairments in cognitive, perceptual, and motoric components of emotional prosody production.
For some time now, researchers have strived to describe acoustically what is often observed in naïve listener ratings of RHD prosody with little convergence (e.g., Weed & Fusaroli, Reference Weed and Fusaroli2020). More naturalistic work that examines receptive and expressive properties of prosody in RHD (e.g., acoustic analysis of conversational discourse vs. word production during a structured repetition task) will be needed not only to better understand the underlying mechanisms associated with aprosodia, but also to address these more effectively in our RHD assessment and rehabilitation practices.
In the only recent prior meta-analysis of prosody subsequent to RHD, Weed and colleagues’ (Reference Weed and Fusaroli2020) focused on prosody production. In the 16 papers that met their inclusionary criteria, they found a small impairment in the use of fundamental frequency that was similar for RHD and LHD groups. Whereas, there was no impairment in the use of intensity cues subsequent to RHD, reduced use of pause duration (but not syllable durations) was identified. None of the acoustic variables examined differed for the production of linguistic versus emotional prosody. Although a comparable meta-analysis examining RHD in contrast to LHD using prosody literature data from the RHDWG is forthcoming, in our meta-analysis, which had different inclusionary criteria and additionally examined receptive prosody abilities subsequent to RHD, there were insufficient data on acoustic variables within the linguistic prosody domain (i.e., grammatical word-level, grammatical and pragmatic phrase-levels, and speech act prosody) to examine; only Edmondson et al. (Reference Edmondson, Chan, Seibert and Ross1987) had enough acoustic data to examine for emotional prosody production. Nonetheless like Weed and colleagues (Reference Weed and Fusaroli2020), the results of our analyses indicated that emotional prosody production was impaired by RHD.
Although findings varied among prosody domains, overall, both a higher quality rating and higher sample/contrast ratio were more likely to be associated with significant contrasts between RHD and NBD participants. It is difficult to say whether this constitutes an increased basis for confidence in significant findings or perhaps is a product of publication bias and the apparent “fruits” of p-hacking behavior. The more discouraging interpretations of these findings are further bolstered by the broader methodological concerns we previously identified, which limited our ability to fulfill the initial aims of this investigation.
Implications for Clinical Practice and Future Research
Clinically, the findings from this systematic review and meta-analysis suggest that assessment of aprosodia after RHD should focus on expressive and receptive emotional prosody and, in terms of linguistic prosody, aspects related to distinguishing speech acts. There does not appear to be a clinical need to assess linguistic prosody at the word or phrase level based on the lack of significant contrasts between RHD and NBD groups that our meta-analysis identified. Given that pragmatic prosody production was impaired among RHD participants only on the specific task of conveying nonliteral meanings of idiomatic phrases (Yang et al., Reference Yang, Sidtis and Yang2017), and there is evidence suggesting that the interpretation and use of idioms can be affected by RHD (Myers & Linebaugh, Reference Myers and Linebaugh1981; Papagno, Curti, Rizzo, Crippa, & Colombo, Reference Papagno, Curti, Rizzo, Crippa and Colombo2006; Sidtis & Yang, Reference Sidtis and Yang2017; Van Lancker Sidtis & Postman, Reference Van Lancker Sidtis and Postman2006), it is possible that this particular finding is not solely due to an impairment of prosodic manipulation, but could reflect a combination of deficits in nonliteral language processing and in the types of prosodic manipulation needed to differentiate intended meanings.
One key observation from this meta-analysis that cannot be overstated was the pervasive use of poor statistical practice including unbridled, study-wide α (i.e., failure to correct for multiple comparisons); inconsistent reporting of influential participant factors as ubiquitous as age, mechanism of RHD injury, and time post-onset; inconsistent reporting of results (e.g., reporting of findings as statistically significant without providing central tendency or variance estimates); and an overreliance on summary statistics over individual differences in small N studies. Whereas study power may be confined by practical considerations and access to participants with RHD, thorough descriptive reporting of participant samples and performances, for both RHD and NBD groups, costs authors nothing and greatly improves the ability to draw conclusions across studies to better understand the RHD population. At a minimum, we provide the following recommendations for reporting by future studies publishing within the topic of prosody subsequent to RHD:
-
Investigators should conduct power analyses during the process of design and recruit sufficient participants to examine the number of anticipated contrasts without inflating study-wide α. In lieu of unanticipated design changes, there should be transparent reporting of instances in which participants are included in multiple studies over time or instances in which a single time point study is broken up over multiple articles. As a general guideline, authors should not engage in investigations in which the number of contrasts a participant is subjected to is greater than the total number of participants in the sample (sample/contrast < 1), as was seen in almost 25% of the studies (i.e., 17/70 studies) reported on in the present systematic review and meta-analysis.
-
Sample reporting at the participant level should include at minimum age, handedness, gender, education, time post-onset, lesion type, and location within the RH. Sample reporting at the participant level also should include results of language and cognitive testing so patterns of symptom co-occurrence can be systematically examined. The reporting of relevant characteristics of the control group should mirror these recommendations (i.e., include age, handedness, gender, education, and results of testing).
-
Reporting of summary statistics should include both central tendencies and measures of variability (e.g., standard deviation or standard errors).
-
Performance reporting at the participant level should be provided. In cases where journal word limit restrictions prevent authors from including participant-level information, this information should be included in supplementary materials whenever possible.
The process of completing this meta-analysis made clear a number of areas of knowledge about prosody and RHD yet to be understood completely. Future work is needed to:
-
define more specifically both prosody and its various functions;
-
examine the processing demands of different types of prosody and the relationship they have to other cognitive capacities;
-
examine prosody in environmentally valid contexts, including those requiring determining intended meaning in real time; and
-
examine the impact of prosodic deficits on patient-reported outcomes, social and vocational changes after stroke, and other long-term outcomes.
The ability for researchers and clinicians to meet these challenges and to address the needs of our patients with RHD in the future will rely in no small part on the renewed commitment to examining this population within acquired communication science circles, the availability of financial resources, the removal of barriers to the recruitment of individuals with RHD, and the introduction of thoughtful new methods for quantitatively and qualitatively analyzing deficits. It is critical that we emphatically recognize that RHD does, in fact, cause deficits in communication that justify the delivery of speech-language pathology services, as these deficits have profound impacts on patients’ participation in relationships and overall quality of life (e.g., Barnes, Beeke, & Bloch, Reference Barnes, Beeke and Bloch2020; Hewetson et al., Reference Hewetson, Cornwell and Shum2018).
Limitations of the Current Study
One limitation of the current study, as with all large reviews, is the obscuring of some variables that occur when creating subgroups. For example, while we did separate out levels of linguistic prosody into grammatical word-level, phrase-level, and speech act prosody, this was at the expense of obscuring elicitation tasks (e.g., reading aloud vs. repetition) and dependent variables (accuracy vs. response time). For emotional prosody, we did not differentially examine data by emotional valence or type. With respect to our systematic review procedures, only articles available in English and French were included, and therefore the inclusion of research published in other languages may have yielded additional RHD prosody studies; likewise, we did not consider gray literature (e.g., unpublished dissertations) or studies in which prosody was not the primary topic of interest, which may have provided a larger pool of data with which to examine the aims.
SUMMARY AND CONCLUSIONS
Findings from the current systematic review and meta-analysis indicate that aprosodia can occur subsequent to RHD, with emotional prosody processing appearing particularly vulnerable. While minimal evidence of phrase-level prosodic impairments was observed, these analyses substantiated prior observations of receptive deficits in speech act prosody. Above all, our hope is that this investigation informs future work regarding the aspects of aprosodia in RHD that, despite a substantial history of investigative research, remain incompletely understood, guides authors in providing a high standard level of description regarding participants with and without RHD, and inspires the continued identification, investigation, and support of individuals with RHD as they move toward post-stroke recovery.
SUPPLEMENTARY MATERIAL
To view supplementary material for this article, please visit https://doi.org/10.1017/S1355617721000825.
DATA AVAILABILITY STATEMENT
Data are available from the authors by request.
FINANCIAL SUPPORT
This research was partially funded by the National Institute on Deafness and Communication Disorders (NIDCD) through P50 014664 and R01 DC015466.
CONFLICTS OF INTEREST
The authors have nothing to disclose.