

1. Introduction
In the explanation of economic growth, any attempt to isolate one single factor among the complex mix is a hard task, and this certainly applies to the economic impact of commercial policies too. Many economic historians have supported the idea that during the late nineteenth century protection was instrumental to the development of continental Europe. Bairoch's (Reference Bairoch1972, Reference Bairoch1976, Reference Bairoch1989, 1993) hypothesis that tariffs were positively associated with growth mainly applied to European countries, but it has also been extended to other high-tariff land-abundant countries like the rich European offshoots.Footnote 1
Recent econometric studies carried out by O'Rourke (Reference O'Rourke2000) and Jacks (Reference Jacks2006) tend to confirm propositions regarding the positive correlation between tariffs and growth in the late nineteenth century.Footnote 2 Both works use a limited sample of 10 countries, mostly rich European or land-abundant countries with good institutions, and this fact has been criticized, even if they are more concerned with exploring the variation in the time series of economic growth than with analysing cross-sectional influence. Other studies that follow a similar time-series strategy point out that the relationship between average tariffs and growth (significant or not significant, positive or negative) depends crucially on the countries included in the sample. A larger sample of countries has shown that the correlation between tariff average and growth might vary considerably in different countries, according to different levels of wealth and degrees of political independence (see Williamson Reference Williamson2006b).Footnote 3 Likewise, Irwin (Reference Irwin2002b) shows that rich land-abundant countries may be outliers in the relation between tariffs and growth, because they often relied on customs duties to generate a large proportion of their government revenue: they tended to impose high tariffs, but without following an import-substituting extrategy. Tena (Reference Tena-Junguito2005, Reference Tena-Junguito, Dormois and Lains2006) remarks that the rich European tariff average is often distorted by revenue tariffs not designed to protect domestic producers, and that we should focus on the relation between manufacture tariffs and growth.
The most notable feature of this historical literature is its reliance on economy-wide average measures of protection. On one side, these data are readily available for a wide variety of countries, and average tariffs are easily calculated: all one needs to do is to divide total customs revenue by the total value of imports. On the other side, the simplicity of tariff averages makes it impossible to reach a deeper understanding of the causal mechanism linking tariffs and growth. In fact, as De Long (Reference De Long1995) and Irwin (Reference Irwin2001a) emphasized for the late nineteenth century, the central question to investigate here is how tariffs alter domestic relative prices in order to shift resource allocation between higher- and lower-productivity sectors. In this case the emphasis will be put on the dynamics of economies of scale, learning-by-doing, and technical innovation that various sectors can develop as a consequence of temporal protection.
In a very recent paper, Lehman and O'Rourke (Reference Lehman and O'Rourke2008), asking whether agricultural and industrial tariffs had the same impact on growth in the late nineteenth century, found robust evidence that manufacture, rather than agricultural tariffs, was related to growth. Their paper uses panel data, but limits the analysis to the same ‘rich countries club’ as O'Rourke (Reference O'Rourke2000). Also, it focuses on five-year periods, picking up the short- to medium-run impact of protection rather than the longer-run effects (p. 14).
This article addresses the same issue but differs from the earlier literature in two respects. Firstly, we focus on the relation between efficient or inefficient tariff structures and long-run growth; secondly, we pay special attention to the different levels and geographical diversity of tariff structures around the world. This approach is made possible because we use a new and improved database which expands the number of countries, and offers a much more detailed disaggregation of manufacture tariffs ranked according to their skill intensity.
The article is structured as follows. The next section provides a general view of the relevance of the issue of regional asymmetry in the tariff–growth debate. Section 3 presents the intuitive model which relates tariff structure and growth, based on total tariff average, industrial tariff average, and the industrial skill tariff bias. Section 4 describes the sources and the variables used in the new database employed in this study. Section 5 discusses the main results of the correlation model, while the last section looks at how, in general, these results match the model predictions that countries with relatively higher tariffs in industry grow more slowly, apparently because high-tariff countries protected the non-skill-intensive sectors more than skill-intensive ones. The last section provides some concluding remarks, including the relevance of these findings in rejecting some of the interpretations offered by the previous literature.
2. Did tariff structure explain regional asymmetries in the tariff–growth relation?
The starting point is the confirmation and discussion of the regionally asymmetrical relationships between tariff average and growth discovered by Williamson et al. The tariff–growth relationship may be ambiguous because high tariffs in sectors with positive externalities may induce high rates of growth, while high tariffs in sectors with no positive externalities may induce low rates of growth. So, in theory, there is no reason to find a systematically unambiguous relationship between average tariffs and growth in different groups of countries, and regional asymmetry may be partially explained by different tariff structures.
This article assumes that in the late nineteenth century the regional asymmetries were mainly influenced by the starting level of income per capita, relative factor abundance and political independence. The division between rich and poor countries is a general proxy for different economic structures and institutional factors that may determine both the tariff structure bias and the relationship between tariffs and growth. Rich nations in Europe, with good institutions, were able to develop tariff policies which was less dependent on pressure groups. That would imply moderate and efficient tariffs on manufactured products.Footnote 4 The tariff policies of politically independent poor countries, with less transparent institutions, weak enforcement of political rights, and lower parliamentary and executive independence, instead, were more likely to be influenced by lobbies. The result would be a policy of relatively higher, but more inefficient, tariffs in industry (biased in favour of non-competitive industrial sectors without pro-growth effects). Land-abundant new settlers tended to impose high tariffs for reasons involving public finance and political economy.Footnote 5 In terms of public finance, the taxation of imported goods reduced the cost of tax compliance in relation to other alternatives, and this is especially true for countries with low population density. Other means of raising revenue (excise taxes, land taxes, income taxes and the like) simply may not have been as feasible or as easy to enforce in countries with a widely dispersed population, particularly in the late nineteenth century. In terms of political economy, if a significant share of the population owns land (or if the government is controlled by landowners), they may have the inclination and the opportunity to avoid direct taxes on land in favour of high taxes on high-revenue-generating imported products or manufactured luxury goods.Footnote 6
The picture was very different in the European colonies in Africa and Asia that implemented typical free-trade policies, normally imposed by their metropolis. Many of these countries, which had created tightly closed economies in the mid nineteenth century, became pro-global, low-tariff countries at the end of the century.Footnote 7 Even independent countries such as Japan or China, under British influence, adopted treaties which limited their tariffs to 5 per cent in the second half of nineteenth century. Similarly, other Asian countries, such as India and Indonesia, were forced by their colonial masters to adopt liberal trade policies. Also in Africa, even if French, Portuguese and Italian colonies typically discriminated in favour of their respective colonial power, the progressive extension of European control resulted, in general terms, in a further diffusion of liberal trade policies at the end of the nineteenth century.Footnote 8 This partial exogenous determination of their commercial policy would reduce the influence of local pressure groups, which in theory would press for higher tariffs, and would lead to a more neutral incidence of tariffs on the assignment of resources.Footnote 9
Consequently, the question of whether a significant relationship between initial tariff average and growth exists, and whether this relationship is positive or negative, depends critically on the countries included in the sample.
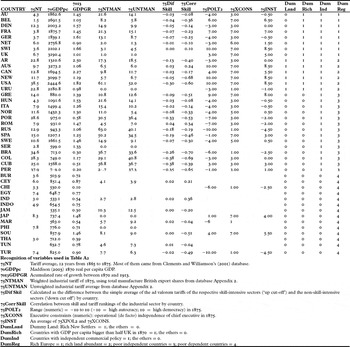
In order to assess regional degrees of protection and their relation to growth we first provide a graphical analysis of the correlation between the initial degree of protection and the subsequent rate of growth. The initial tariff average used here, and in previous works, is measured as customs revenues divided by the total value of imports for the years 1865–75; accumulated GDP per capita growth for 1870–1913 is given in 1990 international Geary-Khamis dollars, following Maddison (Reference Maddison2001). The world has been divided between rich and poor according to arbitrary but explicit criteria: those countries which, in 1870, had a Maddison GDP per capita below half of that of the richest country in the world (the United Kingdom) are classified as ‘poor’. In addition, taking into account what has been said above, a subdivision has been introduced for the rich, separating land-abundant countries from the rest (according to the established literature). At the same time, poor countries have been divided according to their tariff policy independence (in line with Williamson (2006) and Bairoch (Reference Bairoch1976, Reference Bairoch, Mathias and Pollard1989)). As a consequence, this article analyses 42 countries divided into four geographical regions (see Appendix, Table A2): 8 rich European countries (DumReg1: Austria, Belgium, Denmark, France, Germany, the Netherlands, Switzerland and the United Kingdom); 6 rich new settlers (DumReg2: Argentina, Australia, Canada, New Zealand, Uruguay and the USA); 14 poor politically independent countries from the European periphery and Latin America (DumReg3: Greece, Hungary, Italy, Norway, Portugal, Romania, Russia, Spain, Sweden, Serbia, Brazil, Colombia, Cuba and Peru) and 14 poor politically dependent countries, most of them African and Asian colonies and protectorates (DumReg4: Burma, Ceylon, China, Egypt, India, Indonesia, Jamaica, Japan, Morocco, the Philippines, South Africa, Thailand, Tunisia and Turkey). As Table A2 in the Appendix shows, we do not have a complete dataset for all countries listed: therefore, for some regressions the number of observations varies from a minimum of 28 to a maximum of 38.Footnote 10
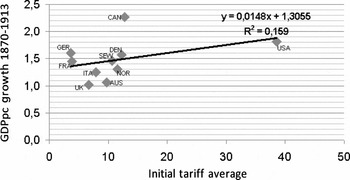
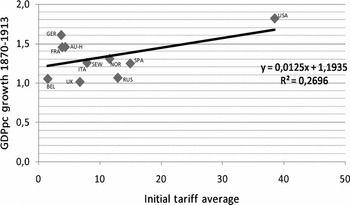
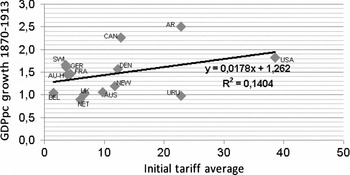
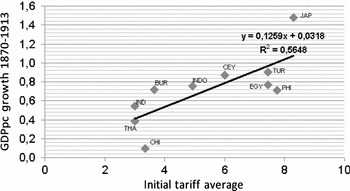
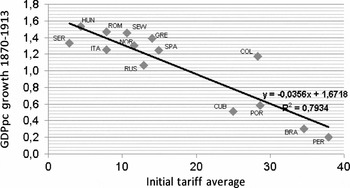
To emphasize the regional asymmetry of the tariff–growth association, we first provide Figures 1 and 2, which confirm the positive association between the initial tariff average in 1865–75 and real GDP per capita growth between 1870 and 1913, for the same group of countries used by O'Rourke (Reference O'Rourke2000) and Jacks (Reference Jacks2006) respectively. O'Rourke uses Australia, Canada, Denmark, France, Germany, Italy, Norway, Sweden, the United Kingdom and the United States, whereas Jacks uses Austria–Hungary, Belgium, France, Germany, Italy, Norway, Russia, Spain, the United Kingdom and the United States. It is important to take into account that most of the countries included in the sample are rich European and land-abundant countries. The selection of the country sample is apparently arbitrary and solely determined by the availability of historical data. In fact, it has been criticized by several authors (see Irwin (Reference Irwin2002a,Reference Irwinb), Williamson (Reference Williamson2006b) and Tena (Reference Tena-Junguito, Dormois and Lains2006)). The strong bias towards rich countries typical of the previous literature is confirmed by using an alternative sample explicitly containing only rich countries (new settler and European countries), as shown in Figure 3. In both cases the regression is strongly influenced by the tariff–growth data of the USA.
Association between initial tariff average and GDP pc growth, 1870–1913: sample of countries (O'Rourke Reference O'Rourke2000)

Association between initial tariff average and GDP, 1870–1913: sample of countries (Jacks Reference Jacks2006)

Association between initial tariff average and GDP pc growth, 1870–1913: rich countries (European core and rich, land-abundant countries)

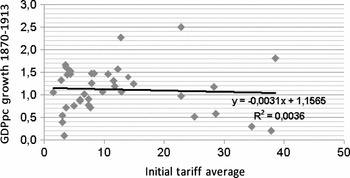
As Figure 4 shows, however, once the whole sample of 38 world countries is considered, no positive or negative association between tariffs and growth emerges. A better representation of the world including rich and poor with colonies and independent developing countries thus provides a different picture of the tariff–growth relationship. Following Clemens and Williamson (Reference Clemens and Williamson2001, Reference Clemens and Williamson2004) and Williamson (Reference Williamson, Findlay, Henriksson, Lindgren and Lundahl2006a), the strategy of this study is to accept the existence of regional asymmetry, and to propose an organization of world countries in clubs following the criteria mentioned above. Thus, the poor are divided according to their political independence, or, in other words, their capacity to develop an independent commercial policy from the metropolis. This may be an important issue for most Asian and African countries with the status of colony or protectorate in the late nineteenth century.Footnote 11
Association between initial tariff average and GDP pc growth, 1870–1913: worldwide

Figure 5 shows a stronger positive association between tariffs and growth for poor non-independent countries. These Asian and African countries had a low average tariff level (between 3 and 8 per cent) because their tariff policies enjoyed very limited independence from the core European metropolis. This exogenous determination of their commercial policy made it possible to control local pressure groups that wanted higher tariffs and led to a more neutral incidence of tariffs on the assignment of resources.Footnote 12
Association between initial tariff average and GDP pc growth, 1870–1913: poor countries and dependent trade policies (Asian and African colonies and protectorates)

By contrast, Figure 6 shows that for peripheral independent countries the relationship between tariff average and growth appears consistently negative. Politically independent poor countries had commercial policies designed by their own governments and parliaments. The European periphery and Latin America had high tariffs, especially for traditional industrial products without comparative advantage, even if some of them were linked with technologies developed from the First Industrial Revolution. From the second half of the nineteenth century many poor independent countries developed some low-skill manufactures, such as traditional textile and metal, imposing high tariffs especially in non-competitive sectors. Even if they reduced some manufacture tariffs, during the liberalization period around the 1850s and 1860s, at the beginning of 1870s they still had a level of manufacture protection that was more than threefold that of the European rich countries. During this period they developed well-established and organized lobbies which demanded high tariffs to defend national industry from the competition of rich countries’ manufactured exports. When protectionism became fashionable again in 1880s and 1890s, peripheral governments were too weak to stop rent-seeking in the economy and most of them increased manufacture tariffs in non-competitive sectors. These results could reflect both the existence of poor underlying institutions, and a negative association between protected industrial sectors and long-run growth.Footnote 13
Association between initial tariff average and GDP pc growth, 1870–1913: poor countries with independent trade policies (European periphery and Latin America)

3. The causal mechanism between tariffs and growth: tariff structure and institutions
In order for tariffs to have a positive effect on growth it is necessary that over time protected manufacturing sectors increase productivity more rapidly than less protected sectors because productivity growth should overcome the accumulated protection welfare losses. As Rodriguez and Rodrik (Reference Rodriguez and Rodrik2000, p. 264) highlight: ‘Such models are in fact formalizations of some very old arguments about infant industries and about the need for temporary protection to catch up with more advanced countries.’ In this case the emphasis is on the dynamics of economies of scale, learning-by-doing and technical innovation that protected sectors can develop as a consequence of temporal protection. However, it is questionable to assume that, without further qualifications, late nineteenth-century manufacturing as an undifferentiated sector responded to the criteria above. In this sense, a more reasonable assumption that we can make is that a country which focuses protection on highly skilled manufacturing industries will probably have higher rates of growth than if protection were focused on low-skilled manufacturing sectors.
This opens the question of how decisions about protecting low- or high-skilled sectors were taken. The literature on endogenous protection has long recognized that a country's tariffs are an outcome of a political rent-seeking game mainly determined by the type of institutions developed in the country (Krueger Reference Krueger1974, Reference Krueger1997; Magee, Brock and Young Reference Magee, Brock and Young1989; Trefler Reference Trefler1993; Grossman and Helpman Reference Grossmann and Helpman1991, Reference Grossmann and Helpman1994; and Magee Reference Magee2002). In fact, we can observe that countries or governments fall prey to ‘rent seekers’ and usually protect sectors because they are more interested in barring foreign competitors than promoting growth.
In a very recent paper Nunn and Trefler (Reference Nunn and Trefler2006), following Grossman and Helpman's (Reference Grossmann and Helpman1994) protection-for-sale model, develop a new approach to examine the causal mechanism between tariffs and long-term growth for the late twentieth century, introducing externalities into the model.Footnote 14 In the new model, tariffs affect future growth via externalities and these externalities vary across industries. High tariffs reduce welfare, and probably growth, if they are not distributed in favour of industries which generate positive externalities at an economy-wide level. Nunn and Trefler's contribution links to the previous literature on the institutions-protection dynamic, by suggesting that only countries with developed institutions, able to put a lid on lobbying, will favour tariffs in skill-intensive industries against non-skill-intensive industries. So, this model assumes that good institutions encourage politicians to be closer to pro-growth policies.Footnote 15
Following Nunn and Trefler, this article adopts the hypothesis that a country with ‘good’ institutions will provide higher tariffs in industries that generate positive externalities. These externalities would have to operate at an economy-wide level, coming from general economic and/or technological sources, rather than from manufacturing alone.
Following the tradition of the tariff–growth literature, and especially Nunn and Trefler (Reference Nunn and Trefler2006), equation (1) expresses the dependent relationship between the annual average rate of growth of GDP per capita and, as explanatory variables, tariff average, manufacture tariffs, tariff structure and the quality of institutions:

In this equation we consider only long-term growth, so we take t = 0 to be the initial year (1870) and t = 1, the final year (1913).
The dependent variable is lnYC1 /YC0 (measured as the accumulated real GDP per capita growth rate). β0YC0 refers to the initial GDP per capita in 1870 used as the classical variable of control for convergence in this type of exercise. Еτc0 is the tariff total or manufacture average (we will use both) in country c and initial year 0 (1875). Let SBv τc0 be the tariff structure showed by the skill-bias of tariffs in country c in initial year 0 (1875), and Хc0 βX as country-specific variables related to the quality of institutions. We also introduce regional dummies as regional fixed effect related to the level of development, land abundance or political independence, with only two values 0 and 1.
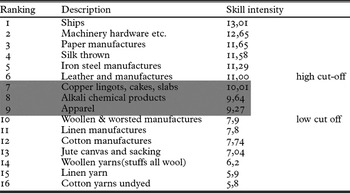
In the case of the initial tariff average (Еτc0) we will use the weighted total tariff average ‘75NT’ and the unweighted tariff average for manufacture ‘75UNTMAN’, as presented in Table A2 in the Appendix. For the initial tariff structure (SBv τc0) we will use the initial manufacture skill bias constructed following Nunn and Trefler's (Reference Nunn and Trefler2006) procedures. The first proxy used is presented as ‘75Corr-Skill’, and defined as the cross-industry correlation between skill-intensity ranking estimated for 1875, shown in Table 1, and the respective ranking of ad valorem tariffs of the same sectors. Most of the countries in our sample have a negative correlation sign between the skill and tariff ranking, showing in general that tariffs are usually higher in non-skill-intensive industries and lower in skill-intensive industries (see correlation in Table A3 in the Appendix). The second proxy used is ‘75Diff-Skill’, which is constructed choosing an arbitrary ‘cut-off’ in the ranking of skill-intensive industries and calculated as the simple difference between the unweighted tariff average of the sectors situated in the ‘up cut-off’ and those of the ‘down cut-off’ for every country. This cut-off has been chosen in relation to the largest differences in the skill-intensity sectors around the mid point of the ranking (see Table 1 below). For the institutional variables, two types of index have been used: one that relates to the level of democracy of a country, POLITY2 (numeric), range = −10 to 10 (−10 = high autocracy; 10 = high democracy); and another which measures the grade of independence of the executive government, XCONST (numeric). The last institutional variable would be used as proxy variable of good institutions in relation to the independence of the government from pressure groups.
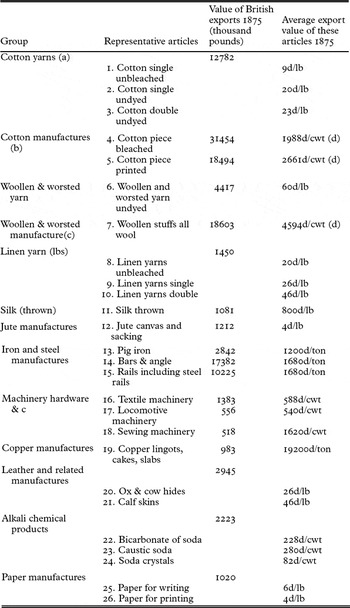
Skill-intensity ranking

Sources: The wages used to construct this ‘skill-intensity’ ranking came from two different sources: the wage distribution for male production workers in 12 manufacturing industrial sectors in 1890 in Iowa (covering the 165 largest cities) offered by Claudia Goldin and Frank Katz (Reference Goldin and Katz1999, appendix table 1, p. 46) and the patchy but abundant information on wage distribution in the textile sector (cotton, wool, hemp, jute and silk) in Barcelona in 1884 (included in Scheuch Reference Scheuch1885).
4. New data on industrial tariffs, skill-bias and institutions
With the exception of Bairoch (Reference Bairoch, Mathias and Pollard1989), there are no comparative studies of industrial tariff levels of the 1870s by country. Bairoch (Reference Bairoch, Mathias and Pollard1989) includes a table of comparative industrial tariff averages in 1875 for 14 countries (‘Author's computation based on tariff duties and prices for 14 different manufactured products’, p. 42). But he does not offer information on the manufactured items included, or the method used (tariffs, prices and weights). A more accurate attempt at estimating manufacture tariffs by country was developed very recently in Lehman and O'Rourke (Reference Lehman and O'Rourke2008). This work offers a time-series estimation for the years 1875–1913 of weighted agricultural, manufacturing and ‘exotics’ tariffs for the same sample of 10 countries used in O'Rourke (Reference O'Rourke2000). The procedure adopted was to divide customs revenues by total imports in 16 identical commodity categories for every country and classified as belonging to either.Footnote 16
The estimation presented here has been devised adopting the following procedure (for details of the estimation of the industrial tariff database see Appendix). In the first place, British sources offered the ad valorem tariffs of 26 industrial products in 1875 for 32 countries; secondly, those 26 industrial products have been assembled in 16 industrial sectors for which their relative skill intensity has been estimated, based on the general structure of USA industrial wages in 1890 (using secondary sources) and other sources of textile wages in 1885 in Spain (from the USA Consular Reports).
The ad valorem tariff sources used in this estimation were taken, firstly, from the study directed by Robert Giffen and presented to the House of Commons in 1877 and 1881. The data were developed by the UK Statistical and Commercial Department Board of Trade, with the title: ‘Import duties on British goods (foreign countries) and rates of duty (foreign and colonial) on British manufactures or produce’. Secondly, data came from the Annual Statement of Trade (1876) and Board of Trade (1878). The first work relates tariffs and prices imposed upon 15–24 manufactured articles in 32 countries; the second relates prices and duties for an additional 9 manufactured articles obtained from a similar group of countries. This material provides us with a complete series of homogeneous data of the tariff average for around 26 industrial products in 32 countries (for sources, products and technique used see Appendix).
A detailed study has been developed also for the classification of the mentioned manufacture tariffs in a ranking according to their respective skill intensity. In the literature, relative skill intensity by sector is estimated by using ratios of workers with more than 12 years of schooling over the total. To our knowledge, no data of this kind is available on the ratios of skilled workers in different industrial sectors at the end of the nineteenth century.Footnote 17 Skill-intensity measures are apparently quite resistant to temporal and geographical change; we have made the assumption that capital is uniformly distributed between sectors, and in consequence that sectors with relatively higher salaries have a higher proportion of skilled workers.Footnote 18 This means that we assume that higher ‘median’ wage sectors will rank higher in our estimations of skill intensity.Footnote 19
The wages used to construct the skill-intensity ranking shown in Table 1 came from two different sources (as noted at the foot of the table). In the first case, the complete wage structure makes it possible to estimate the ‘median’ wage of the sector. In the second case, extensive but incomplete information on wages for different textile sectors allows us to construct incomplete professional samples by sector, but it suggests the use of a simple wage average instead of the ‘median’ average for the estimation skill-intensity ranking of the different textiles sectors.
For the institutional variables, the level of democracy of a country, POLITY2 and the level of independence of the executive government, XCONST, the data came from the Polity IV database. It contains coded annual information on regime and authority characteristics for all independent states (with a total population greater than 500,000) in the global state system and covers the years 1800–2004.Footnote 20
5. Evidence on tariffs and growth
The recent paper by Lehmann and O'Rourke (Reference Lehman and O'Rourke2008) mentioned above uses panel data exploiting the variation in agricultural and industrial tariffs for a sample of 10 countries, most of them rich, in the late nineteenth century. Attention is focused on the association of manufacture and agricultural tariff structure with the ups and downs of economic activity of the rich countries.Footnote 21 The work developed here places greater emphasis on the manufacture tariff structure and long-run growth of rich and poor countries according to the skill-intensity structure of their manufacturing sector. Therefore we designed an extended and homogeneous ad valorem tariff database for around 26 industrial products for 32 countries in 1875, and later we assembled these data in 16 industrial sectors, ranked according to their relative skill-intensity bias. This model, for the first time, privileges the industrial tariff structure, the geographical coverage of data, and the long-run relationship between tariffs and growth. In order to capture this effect, regional dummy fixed variables or different clubs of countries will be employed alternatively. The econometric strategy of this article is to run a simple cross-section model with interaction terms and fixed regional effects in order to capture the income and regional influence in the association between tariffs and long-run growth.Footnote 22 Furthermore, an intuitive theoretical model of endogenous growth is provided which relates both sides of the equation. We expect that, in general terms, most of the countries of our sample will impose high tariffs in industries that generate no positive externalities and slow growth. In a cross-section study like this, the reduced number of observations allows the simultaneous introduction of several control variables and explanatory variables all together in a single regression equation. Average tariff (75NT), manufacture tariffs (75UNTMAN) and structure of protection (75Diff Skill) may not be put in one regression because there is a high correlation between them. Only the initial GDP per capita (70GDPpc) and the variables that proxy good institutions (75XCONST) would be used, in the same regression, with the regional dummies, as control variables.Footnote 23
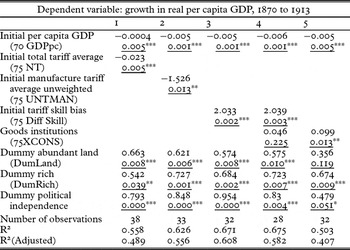
Table 2 tests the comparative explanatory power of the total tariff average, manufacture tariff and skill industrial tariff respectively for long-run growth in 1870–1913.Footnote 24 Variables are not logged and the respective regressions include three additional dummy variables with regional fixed effects related to the level of development, land abundance or political independence (with only two values 0 and 1, rich countries = 1, the rest = 0; rich land-abundant countries = 1, the rest = 0; politically independent countries = 1, the rest = 0) following the discussion in previous sections regarding the importance of the level of development, factor endowment and political independence variables in the explanation of regional asymmetry found between tariffs and growth by the literature. Regression 1 shows that these regional fixed effects are relevant in the regressions between the tariff average and late nineteenth-century growth. The regional fixed-effect dummies allow extending the explanatory power of the initial average tariff on growth from the small group of rich countries, as defined by O'Rourke, to a more representative world of 38 countries. Furthermore, the results would show that in a larger world, with rich and poor countries included in the sample, the sign of this relationship changes from positive to negative. What is more important, as regression 2 shows, the countries which imposed higher tariffs on the manufacturing sector were those that had the worst growth performance, and this relationship is stronger than shown by the total tariff average. Exploring further the association between manufacture tariffs and growth, regression 3 offers some evidence to support the idea that there is a positive relationship between the efficiency of the structure of manufacture protection and growth. The efficiency of the structure of protection in this work means higher tariffs in the more skill-intensive manufacturing sectors, and it is measured by the initial tariff skill bias (our variable 75Diff Skill). The coefficient of correlation between manufacture tariffs (75UNTMAN) and tariff skill bias (75Diff Skill) is very high and negative (−0.91), which does not allow us to include both variables in the same regression, but would support the idea that those with higher manufacture tariffs were those with the most inefficient structure of manufacture protection. That would suggest too that countries which apparently put more emphasis on an import-substituting strategy, and imposed higher tariffs on manufacturing sectors, were those that had a more inefficient manufacture tariff structure and a worse growth performance. This evidence would fit with the initial hypothesis that more protected countries were more interested in barring foreign competitors than in promoting growth, which is consistent with the suggestion that tariffs may be the outcome of a political rent-seeking game in which the quality of institutions may play an important role as a causal variable. Nevertheless, we should decide between good tariff structure and good institutions, as the main factor responsible for good growth performance, because of the potential endogenous connection between both variables. Our concern is to find a direct connection between a good manufacture tariff structure and its potential positive externalities in the wide economy as the main explanatory variable for growth. Regression 5 in Table 2 shows, on one hand, that the coefficient of ‘good institutions’, explained by a variable as the level of independence of the executive government (75XCONST), is very low but positive and significant. On the other hand, regression 4 offers a combination of both variables, good institutions and good tariff structure, in the same regression. The result shows that tariff structure and not institutions is the main variable explaining late nineteenth-century growth, which is consistent with the argument outlined above.Footnote 25
Tariff structure and economic growth with regional fixed effects

Note: P-values underlined.
***significant at 1%; **significant at 5%; *significant at 10%.
Sources: Appendix, Table A2.
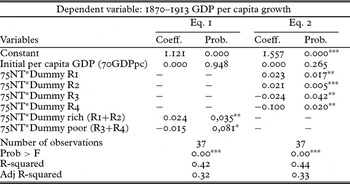
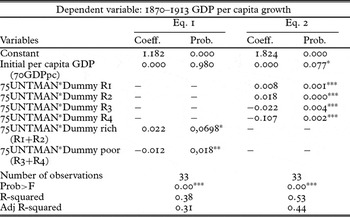
Tables 3 to 6 present a test of the regional asymmetry of the different explanatory variables used above (total tariffs, manufacture unweighted tariffs, skill-bias tariff and good institutions). The econometric strategy used in these tables was to introduce four different regional dummies, with interaction terms, for each of the respective independent variables. On one hand, in equation 2 we introduce our four different regional dummy variables: Dummy R1: rich European countries; Dummy R2: rich new settlers; Dummy R3: poor politically independent countries; and Dummy R4: colonies and protectorates. On the other hand, in equation 1 we offer a regional division of the world between the ‘rich club’ (Dummy rich (R1+R2)) and the ‘poor club’ (Dummy poor (R3+R4). As expected, following the main hypothesis of the article, results show how the relationship between tariffs and growth is only slightly positive and significant for the ‘rich countries club’ and negative and strongly significant for the rest. This happened for total and for manufacture tariffs (NT and UNTMAN respectively) and in both equations. In equation 1, we present the world divided into two separate clubs according to the level of development (Dummy rich (R1+R2) and Dummy poor (R3+R4)), and in equation 2 the impact of every regional dummy. Results show a positive sign for the rich Europeans and land-abundant countries (Dummy R1 and Dummy R2) and a negative sign for the poor independent (Dummy R3) and for the poor dependent countries (Dummy R4) respectively. Therefore, in line with previous findings, Tables 3 and 4 show that the influence of tariff average and tariff manufacture on growth at the end of the nineteenth century was negative for the world globally, as Table 2 shows, but that the impact was different for rich and poor countries. It would confirm that Bairoch and O'Rourke's tariff–growth positive hypothesis apparently only works in the case of the ‘rich countries club’.
Initial total tariffs and growth regressions with interaction terms

Sources: Appendix, Table A2.
Initial manufacture unweighted tariffs and growth regressions with interaction terms

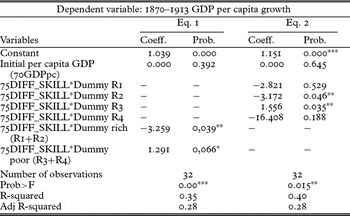
Initial skill-bias tariffs and growth regressions with interaction terms
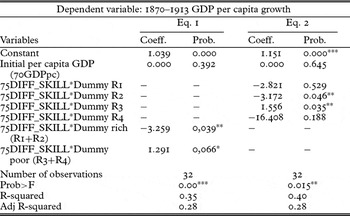
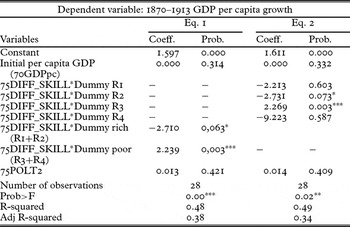
Initial skill-bias tariffs and growth regressions with interaction terms

Sources: Appendix, Table A2.
Despite a general positive correlation between the protection of skill-intensive sectors and growth applying to the entire sample, still regional asymmetry persists, as shown in Tables 5 and 6. Results in Table 2 fit with the general expectations that countries that protected the more skilled industrial sectors were those with the best growth performance. However, regional correlations introduced in equation 1 of Tables 5 and 6 show that this mainly happened in the ‘poor countries club’. On the contrary, rich countries appear to have a negative relationship between the efficiency of the structure of protection and growth performance, even if coefficients are significant only if the interval of confidence is reduced to 5 or even 10 per cent. This appears to be as a paradox, as it means that, in the case of the rich countries, those that protected the unskilled manufacturing sectors more ended-up with better growth performance. However, at a deeper level of disaggregation, a negative correlation is only significant for the new settler land-abundant countries (Dummy R2), but not for the rich European countries (Dummy R1). To explain this result one can consider that new settler economies may be outliers because their special factor endowment created the conditions to impose high tariffs for reasons involving public finance and political economy, as discussed in the introduction. For these countries growth was exogenous to protection in general, while the structure of protection was oriented towards low-skilled sectors because their relative lower elasticity of demand led to maximization of tax revenues.
5. Conclusions
The potential dynamic relationship between tariffs and growth can be better appreciated in the long run, and this article highlights the importance of the structure of protection and regional asymmetry in this long-term relationship. In theory, there is no reason to find a systematically unambiguous association between average tariffs and growth in different groups of countries, and regional asymmetry may be partially explained by different tariff structures.
The article's main methodological innovation is the use of a new database of industrial tariffs for 32 countries in the 1870s. This new evidence allows us, for the first time, to include manufacture protection and manufacture tariff structure as explanatory variables alongside tariff average, and different regional dummies. Results show that, at a global level, income, factor endowment, and political independence are important variables to explain regional asymmetry in the association between tariffs and growth. Under these conditions, an increase in protection, measured by total and manufacture tariff averages, implied more protection of unskilled and inefficient sectors and less growth, and this is especially consistent with the behaviour of poor countries in the late nineteenth century. Protection was apparently positive for the ‘rich countries club’, but had a limited impact on growth.
Comparative advantage in low-skilled sectors might be an engine for growth, therefore higher protection of those sectors might appear as a legitimate option. However, international trade theory and historical experience show that tariffs never focus on relatively low-cost sectors with comparative advantage in the present day. Tariffs in non-comparative advantage sectors in the present day may have a positive relationship with growth in the future, if high tariffs are imposed in sectors with dynamic positive externalities. Endogenous growth literature assumes that this might be the case if ‘good institutions’ succeed in controlling rent-seeking.
In this article tariff skill-bias runs through measures of good institutions, and reduces the possibility that the skill-bias of the protection structure is capturing the broader effect of ‘good institutions’ on growth. In broader terms, this article proves that the initial total and manufacture tariff negative relation with growth is related to the tariff structure, and shows how those that protected skill-intensive sectors had a better growth performance than those who did not, and this is specially true for the poor countries. Tariff structure provides a better causal mechanism for explaining the 1870–1913 growth than the initial tariff average, independently of income level. The article also proves the strong regional asymmetric effect of tariffs on growth in the world between the rich and the poor.
This works thus rejects the established view that, as a general statement, tariffs were positively associated with long-run growth in late nineteenth century, as has been maintained recently by O'Rourke (Reference O'Rourke2000), Williamson (2001, Reference Williamson, Findlay, Henriksson, Lindgren and Lundahl2006a), Jacks (Reference Jacks2006). European and Latin American peripheral countries demanded high tariffs to defend national industry from the competition of manufactured imports from rich countries. Tariff structure was the result of a rent-seeking policy competition between inefficient sectors trying to defend national manufactures more than a governmental tariff import-substitution strategy. An inefficient manufacture tariff structure did not foster positive externalities at an economy-wide level, and this was especially true for the developing world. That is probably the reason why total, and especially manufacture tariffs, usually appear associated with negative growth in the world in the late nineteenth century.
Protection, in general, seems negatively correlated with growth, but apparently had a slightly positive impact on the ‘rich country club’. This result, in the strict sense, is consistent with Lehman and O'Rourke (Reference Lehman and O'Rourke2008), highlighting the fact that manufacture tariffs were positively related to growth in the developed world in the late nineteenth century: ‘it could well be that what was true in our sample of more or less affluent economies was not true for poorer regions of the world as well’ (p. 13). Strong regional asymmetries suggest that the association between protection and growth depends on what was protected. This article suggests that in the late nineteenth century, as today, it is necessary not only to look at the different impacts of agricultural vs industrial protection, but at the efficiency in the configuration of manufacture protection too. Much work is still to be done regarding the reasons for the different configurations of tariff structures, but also regarding the different impact of tariff policy in different economic contexts, to understand more about the dynamic mechanism of causality between tariffs and long-run growth.
Acknowledgements
Earlier versions of this paper were presented in 2007 at the Seminare Chaire de Finances Internacionales, Sciences Po, Paris; sixth European Historical Economics Society Conference, Lund 2007; sixth World Congress of Cliometrics, Dalkeith Palace, Edinburgh; LSE Thesis workshop in Economic History, London. Thanks to participants, especially to Marc Flandreau, Kevin O'Rourke and Knick Harley. Additional comments were made by Concha Beltran, Ma Angeles Pons, Leandro Prados de la Escosura and Jeffrey Williamson. Special thanks are due to Esteban Nicolini and Felipe Fernandes for their intellectual support and econometric advice, and to Paolo Di Martino for his comments and editing help. The Spanish Ministerio de Ciencia e Innovación, research projects ECO2008–02089 and NEINVECON, is gratefully acknowledged.
Appendix: Estimation of the industrial tariff database in 1875
There is some well-known contemporaneous estimation of comparative manufacture tariff averages by country before World War I. The League of Nations (1927) offers comparative index numbers for more than a dozen countries in 1913, but only Liepman (1938) develops a complete disaggregated study by sector with an explicit methodology for the same year. Another relevant study, less commonly used by economic historians, is that of the Board of Trade (1905), which offers estimations of tariff averages in 20 countries for 32 manufactured articles.
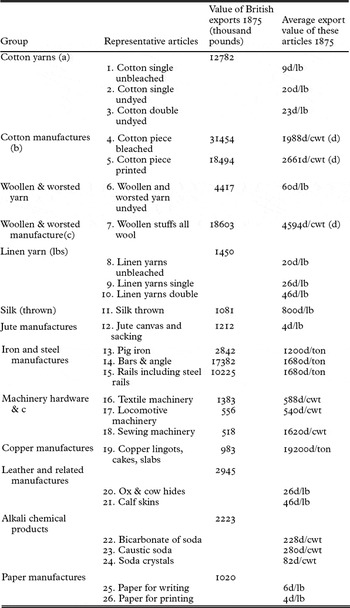
For 1870s, there is not a single systematic study, so to develop the necessary quantitative variables on cross-country industrial sector tariffs, a new panel of data has been constructed on the ad valorem tariffs of 26 industrial articles in 1875 for 32 countries based on British sources. Following League of Nations and Liepman recommendations, we offer both the unweighted and the weighted tariff average. For the first, a simple arithmetic average of the 26 industrial articles has been estimated for every country, for the second, the relative importance of every article in total British exports is used as weight (see column 3 of Table A1 in this Appendix). This technique involves, in the first place, making a list of the principal classes of goods and assigning a rough ‘weight’ to each group according to its comparative importance in British exports. A few leading articles or classes of articles are then chosen from each group as representative of the whole group, and the average tariff rates of duty on these leading articles for each country are taken as fairly representative of the tariff treatment of the whole group. These tariffs should be expressed using the standard British monetary, capacity, mass or weight units for the corresponding articles (for special calculations see the technical specifications below points (a), (b) and (c) in Table A1).
The sources present the incidence of import tariffs on the principal manufactures exported from United Kingdom (the main world manufacture exporter in 1875) in more than 32 countries. This estimation uses British fob export prices instead of national cif import prices in the denominator for the estimation of the ad valorem tariffs. On the one hand, this would imply an over-bias, but in the case of manufactured articles with low freight factors, practical implementation of fob instead of cif prices makes little difference to the final results.Footnote 26 On the other hand, especially for poor countries, British export values are in fact closer to real market prices than the low accurate import unit values that most of the poor countries had in their respective official trade statistics in 1870.Footnote 27
To obtain the sector tariff average, the unweighted tariff of the articles belonging to the sector was used. In this way, a complete series of homogeneous data of the tariff average for 14–16 industrial sectors in 32 countries was obtained (for the sectors see Table 1; for the countries see Table A2). This method (which is adopted below) has the advantage of applying a uniform standard to all countries, both as regards the list of articles on which the duties are calculated, and the relative ‘weight’ attached to each article. The unweighted manufacture tariff by country assumes an artificial standard import demand structure for every country which has not been biased by tariffs.Footnote 28
Sources
Ad valorem rates, import duties and prices of manufactures exported in 1875
The data on prices were presented with the respective tariffs by the UK Statistical and Commercial Department Board of Trade, with the title ‘Import duties on British goods (foreign countries) and rates of duty (foreign and colonial) on British manufactures or produce’, and also on import duties in ‘British goods (foreign countries) return of the estimated average ad valorem rate of import duty levied in the principal European countries and in the United States, on certain articles of British produce or manufacture’, both in British Parliamentary Papers vol. LXXVI.181, session 1877. This study has been complemented by other estimations on prices, especially for textiles (for instance, cotton manufactures and woollen and worsted manufactures) but also for an additional nine manufactured articles for the year 1875, from the ‘Annual statement of trade: return of the values of the exports of British and Irish produce 1854–1880’. British Parliamentary Papers vol. LXV, session 1882.
With this material a complete series of additional homogeneous data of the tariff average for 16–14 industrial sectors in 32 countries has been obtained (for the final sector aggregation see Table A1). This study was directed by Robert Giffen and presented to the House of Commons in 1877 and 1881.
Technical specification for some articles used for 1875:
(a) In the same way as for cotton piece goods, for cotton yarns 40 yards to the lb has been assumed. See British Parliamentary Papers (1905), p. 291.
(b) Cotton piece goods are entered in UK Trade Accounts by the yard, whereas most duties are imposed by weight or graduated according to the weight per square metre of the tissues. An ‘average account’ of 5 yards to the lb has been assumed. See British Parliamentary Papers (1905), p. 291.
(c) In the case of woollen and worsted piece goods, average weights have been estimated varying from 18 oz to the yard for heavy broad woollen piece goods and worsted coatings to 5 oz to the yard for mixed worsted stuffs. See British Parliamentary Papers (1905) p. 291.
(d) Equivalence for measurement of mass or weight: 1 ton = 20 cwt; 1 cwt = 112 lb = 50.8 kg; 100 yard = 20 lb; 1 oz = 1/16 lb; 1 lb = 0.453 kg.
(e) Official equivalence for monetary units: 1 pound = 20 shillings = 240d; 1 shilling = 12d.
Database available to researchers upon request.
Groups, articles and prices taken as representative of British manufacture exports, 1875
Variables and data used in the tariff–growth regressions

Method and sources: see Section 4 of the text, and Appendix.
Matrix correlation between variables of Table A2