

Introduction
In the past two decades, many established democracies have recorded remarkably high levels of electoral volatility (Mair, Reference Mair2005). Either as a consequence of new party entry and old party exit or as a result of vote switching across existing parties, parties’ vote shares have become increasingly less stable between elections (Dalton and Wattenberg, Reference Dalton and Wattenberg2000). Electoral earthquakes have happened in Italian recent history as well. According to the most commonly used measure of electoral volatility (Pedersen, Reference Pedersen1979), two Italian general elections (i.e. 1994 and 2013) are at the top of the list of the most volatile elections in Western Europe since the Second World War with values that are well above 35%.Footnote 1 Yet, these two cases have very little in common. On the one hand, the chief reason of such a high volatility in 1994 was the disappearance of the main left- and right-wing parties. This caused a massive re-structuration of the political market. Nonetheless, the newly branded parties that emerged in 1994 unambiguously positioned themselves on the left-right continuum. By contrast, electoral volatility cannot be explained by the exit of any of the established parties in 2013. Moreover, the new political party that entered the fray in that occasion [i.e. the MoVimento 5 Stelle (Five Star Movement) – M5S hereinafter] does not fit into the traditional left-right dimension. Hence, examining the composition of the electorate of this party is crucial to better understand how voters perceive it and what the dimensions of electoral competition were in that election.
Our goal is to understand the sources of volatility in the context of the 2013 Italian parliamentary election. Why the M5S performed so well in its first participation in a general election is puzzling. Despite the tardy official decision to enter the competition (only 4 months before the elections were held), the M5S obtained an impressive 25% of the vote share, beating estimations by polling institutes by 10 percentage points (Hanretty, Reference Hanretty2013) and making it the most voted list if one does not count the votes cast by Italians abroad. It ended up just in front of Italy’s main centre-left party [Partito Democratico (PD)], and clearly outperformed Italy’s main centre-right party [Popolo della Libertà (PdL)]. From the very beginning of the electoral campaign, the M5S positioned itself outside of the left-right continuum and declared upfront that it would not participate in a coalition government with either the left- or right-wing parties. The declared objective of this strategy was to be the most voted party in order to get the majority seat bonus and govern alone.
The electoral success of the M5S has been investigated in the light of a variety of theories (e.g. Tronconi, Reference Tronconi2015) and by using both individual- (Itanes, 2013) and aggregate-level data (Tronconi, Reference Tronconi2013). Survey data were largely employed to figure out the reasons for voters’ swing towards the M5S (Itanes, 2013; Tronconi, Reference Tronconi2015) and to estimate which parties they voted for before (De Sio and Schadee, Reference De Sio and Schadee2013). Aggregate-level data were employed to carry out geographical analyses (Tronconi, Reference Tronconi2015) and, similarly to survey data, to investigate voters’ switch among parties (Tronconi, Reference Tronconi2013). Although our analysis presents some similarities with the swing estimates obtained from survey data (e.g. the amount of votes gained from the PD), it also highlights some important differences (e.g. the amount of votes gained from the PdL and from abstention). Hence, our findings confirm that employing aggregate data can be very useful when estimating the swings, especially when a new party is involved, because sampling errors cannot occur (Bethlehem, 2009) and interesting differences with survey data estimates might emerge.
In this paper, following the approach used by De Sio and Paparo (2014), we estimate the flow of votes between the 2008 and 2013 elections by applying an ecological inference method, the Goodman model (Reference Goodman1953), first to the entire Italian voting population at the polling station level, and then to the four geopolitical areas proposed by Diamanti (Reference Diamanti2003).Footnote 2 However, unlike De Sio and Paparo (2014), who are interested in providing an overall picture of the flows of vote, we primarily focus on the movement of votes involving the M5S. Therefore, in this paper we pay special attention to the composition of the M5S electorate (both at the national and subnational levels). We will show that the M5S was able to attract about the same amount of former left- and right-wing voters while also mobilizing a considerable group of previous non-voters, and that this dynamic is overall speaking the same across the four geopolitical areas analysed – even if involving different political parties across them. Focussing on four subnational areas is appropriate, as electoral behaviour in Italy has always been characterized by a remarkable geographical component (Agnew, Reference Agnew1996, Reference Agnew2002; Diamanti, Reference Diamanti2003; Shin and Agnew, Reference Shin and Agnew2007).
We are aware that the application of the Goodman model to the entire Italian population and to large macro-areas has to be interpreted with caution, as some scholars (e.g. Corbetta and Parisi, Reference Corbetta and Parisi1984) argue that the flow of votes estimates can be considered reliable only when applied to a homogeneous context such as a municipality (Tronconi, Reference Tronconi2013), for instance, performed a local analysis of aggregate data at the local level by only considering 11 municipalities. However, other authors (e.g. Biorcio, Reference Biorcio1993; Natale, Reference Natale2000) claim that even within a municipality there are areas that cannot be seen as homogenous and show evidence that flow of votes estimates at the national level can be also considered reliable – the aforementioned work of De Sio and Paparo (2014) proposes an analysis based on national data as well.
The 2013 Italian parliamentary election and the M5S
The 2013 Italian parliamentary election took place 4 months before the end of the normal 5-year electoral cycle as a consequence of the early dissolution of the previous parliament on 22 December 2012. Although new elections were in principle not necessary as the main centre-left (PD) and centre-right (PdL) parties had reached an agreement to install a technical government led by the economist Mario Monti, they had to be called when the PdL withdrew its support and toppled Monti’s cabinet. During the Monti’s government a strict austerity policy was enacted, which was appreciated at the European level but was at times strongly criticized within Italy itself. The new elections were scheduled for 24 and 25 February 2013. The elections were characterized by the emergence of a few new parties trying to compete with the traditional centre-left and centre-right parties – PD and PdL – and their main partners: Sinistra Ecologia Libertà and Lega Nord (LN), respectively. However, the most relevant change in the electoral supply was the emergence of the M5S, which ran in a national election for the first time.
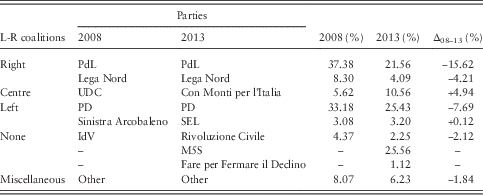
The election results are presented in Table 1. First of all, it should be noted that electoral participation followed the sharp decline of the last four decades in Italy and turnout rates decreased by 5 additional percentage points, going down from 80.45% in 2008 to 75.17% 5 years later. Data displayed in Table 1 clearly illustrates that the party supply in 2013 was slightly larger than 5 years before. Moreover, two new options (i.e. Con Monti per l’Italia and M5S) gained a substantial amount of votes at the expense of the two big parties, PdL and PD, which suffered remarkable electoral losses. Partly as a consequence of these facts, party system fragmentation increased considerably in 2013: the effective number of electoral parties went from 3.82 to 5.33.
Chamber of deputies 2008 and 2013 election results (% valid votes)

L-R=left-right; PdL=Popolo della Libertà; UDC=Unione di Centro; PD=Partito Democratico; SEL=Sinistra Ecologia Libertà; M5S=MoVimento 5 Stelle.
Especially important is the performance of the M5S, which obtained more than 25% of the votes and became the first single party within Italy.Footnote 3 As mentioned before, polling companies heavily underestimated the Movement’s result, which was projected to be about 15% (Hanretty, Reference Hanretty2013). Led by the comedian Beppe Grillo, the M5S had started to participate in conventional politics by taking part (quite successfully) in the 2010 municipal elections under the label Liste a Cinque Stelle (Five Star Lists).Footnote 4 More positive results were reached at the 2010 regional elections and the 2012 local elections, with more than 150 grillini sitting at local councils and four candidates elected as mayors (Bordignon and Ceccarini, Reference Bordignon and Ceccarini2013). In October 2012, Grillo announced on YouTube that the M5S would participate in the upcoming 2013 general election.
Mainstream parties occupied a special place amongst the various targets of Grillo and his supporters since the very beginning (Tronconi, Reference Tronconi2015). This distance from traditional political actors was underlined by the decision of not accepting candidates who were members of any other party, or had been elected for a political office more than once in the past. These requirements made the profile of its candidates fundamentally different from that of the traditional professional politician. Moreover, the complete rejection of any kind of ideological (left-right) label also clearly illustrated its distance from the traditional parties. Its post-ideological nature also emerged in the political press releases periodically posted on its blog (‘Right and left do not exist’)Footnote 5 or in Grillo’s characterization of the Movement as one ‘of ideas, not of ideologies’.Footnote 6 We will test whether Grillo’s electoral success was rooted in this lack of ideological definition.
Data and methods
The Goodman model
To empirically assess the composition of the M5S electorate, we estimate the flows of vote between the 2008 and the 2013 general elections by applying an ecological inference method to the entire Italian voting population. Although researchers studying voting behaviour often rely on electoral surveys, the use of this source of individual-level data poses numerous problems. First of all, reported turnout rates are usually much higher in survey samples than in reality because of problems of representativeness of the sample and respondents’ misreporting (Selb and Munzert, Reference Selb and Munzert2013; Russo, Reference Russo2014). By employing the entire population this problem is fully overcome and any issue linked to incompleteness or selection of the data is excluded.
A second limitation of surveys is that in some contexts individuals prefer to conceal their true preferences from the interviewer if they do not share a particular standpoint or opinion that dominates the public sphere. Several instances of this type of spiral of silence process have been identified in the literature (Noelle-Neumann, Reference Noelle-Neumann1974). Breen (Reference Breen2000), for example, has analysed the tendency of surveys to underestimate the vote for extreme parties. This seems to be particularly problematic in Italy in 2013, where the pre-electoral polls underestimated the result of the M5S by about 10 percentage points whilst overestimating the performance of the PD and Monti’s coalition by about 5 percentage points each (Hanretty, Reference Hanretty2013). If these problems seriously undermine the estimates of pre-elections polls, we cannot exclude that post-electoral polls also suffer from the same limitations (even if the weighting procedures might be easier to implement in the latter).
In order to obtain an estimate based on the entire voting population we will use the Goodman (Reference Goodman1953) model. While other studies employ a different technique (Ricolfi, Reference Ricolfi1993; De Sio, Reference De Sio2008), the Goodman model continues to be the preferred one to estimate flows of votes in Italy (Schadee and Corbetta, Reference Schadee and Corbetta1984; Agnew, Reference Agnew1996; De Sio, Reference De Sio2008). Part of the reason for this success lies in the fact of producing very similar results to the King (Reference King1997) model (De Sio, Reference De Sio2008). This is not surprising since the King model is simply the Goodman regression approach using the Duncan and Davis (Reference Duncan and Davis1953) deterministic bounds to inform the results (Grofman and Barreto, Reference Grofman and Barreto2009).
The Goodman model assumes that the population of one electoral district can be classified by using two variables: the variable Y (election t 1), which has K categories (the parties at election t 1), and the variable X (election t 0), which has J categories (the parties at election t 0). Subsequently, Y k is the percentage of the population that belongs to each of the K categories of variable Y, and X j is the percentage of the population that belongs to each of the J categories of variable X. Following these specifications, one can assume the percentages of the population to be positive, and to be smaller than the population itself.
For each electoral division of the sample (or the population if all polling stations are used) the equation can be represented by the following expression:
 $$Y_{k} {\rm \,{\equals}}\,b_{{\rm 1}} X_{{\rm 1}} {\rm {\plus}}b_{{\rm 2}} X_{{\rm 2}} {\rm {\plus}}b_{{\rm 3}} X_{{\rm 3}} {\rm {\plus}}\,\ldots\,{\rm {\plus}}b_{j} X_{{j{\rm }}} {\rm {\plus}}{\epsilon}$$
In the Goodman model, independent and dependent variables represent percentages of the population, and the regression coefficients correspond to these percentages. Therefore, it is not possible for coefficients to have negative values or values >1. If such unacceptable values do appear, it is necessary to re-adjust them by using an iterative algorithm in order to obtain coefficient estimates that are between 0 and 1. Any such re-adjustment of the coefficient estimates has to be as minimal as possible. The re-distributed value (VR) measures the size of such readjustments (Schadee and Corbetta, Reference Schadee and Corbetta1984). The VR is calculated by taking the differences of the coefficients’ values before and after the re-adjustment and adding them up (Schadee and Corbetta, Reference Schadee and Corbetta1984: 87). As a rule of thumb, if the VR coefficient is <0.15 (i.e. 15% if the population is expressed in percentages), the flow of votes estimates can be considered reliable. The VR value of the estimates presented in this article fall overall speaking within the reliability interval, with very minor exceeding values in some of the specified geographical areas [i.e. North-West (15.66%) and Red zone (15.36%)].
Geographical areas
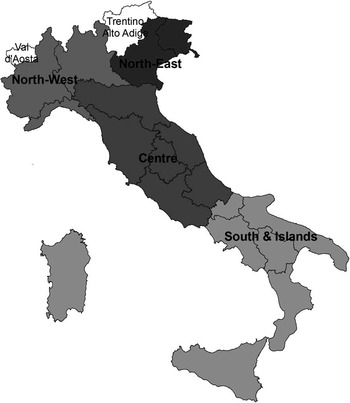
There are several ways of dividing the Italian territory into electoral areas (see, among others, Galli and Capecchi, Reference Galli and Capecchi1968; Barbagli and Corbetta, Reference Barbagli and Corbetta1980; Corbetta and Parisi, Reference Corbetta and Parisi1984). The partitions differ in terms of the number of zones, the presence or absence of territorial continuity constraints or the indivisibility of the regions (Cartocci, Reference Cartocci1987). Despite these specificities, Diamanti (Reference Diamanti2003) has observed that the various propositions can be traced back in a schematic way to a model with four zones (see Figure 1):
-
1. North-West: Piemonte, Liguria;
-
2. North-East: Lombardia, Veneto, Friuli Venezia Giulia, Trentino Alto-Adige;
-
3. Centre (Red zone): Emilia-Romagna, Toscana, Umbria, Marche;
-
4. South and Islands: Lazio, Abruzzo, Molise, Campania, Puglia, Basilicata, Calabria, Sicilia, Sardegna.
Four geopolitical areas.

Despite the profound political changes (in terms of supply, demand, and electoral laws) registered during the 1980s and 1990s, the electoral orientations in these zones have fundamentally remained constant (Shin and Agnew, Reference Shin and Agnew2007), and each of them is still characterized by a specific competition dynamic (Diamanti, Reference Diamanti2003). The North-West is characterized by high levels of electoral competitiveness, which makes it impossible to identify a predominant party. By contrast, the electorate of the North-East has always presented a clear conservative profile, with victories of the Democrazia Cristiana first and the LN later on. The Centre is traditionally the stronghold of the Italian left, or rather what used to be the Italian Communist Party and now is, after several transformations, the Democratic Party. Finally, the South and the islands are less stable in terms of voting patterns, being, thus, the electoral behaviour in this part of the country characterized by a high prevalence of vote switching (Musella, Reference Musella2000; Diamanti, Reference Diamanti2003).
When looking at the elections of the Second Republic, the division into these four zones is still relevant from a political point of view (Corbetta and Piretti, Reference Corbetta and Piretti2009). It is, therefore, clear that in Italy the geographical context remains an important variable in explaining vote choice in the sense that it ‘incorporates homogenous traditional political tendencies that are embedded in macro-areas within the country’ (Schadee et al., Reference Schadee, Ballarino, Maraffi and Vezzoni2010). Therefore, besides the national level of the analysis, we provide a more detailed picture by looking at the flow of votes in each of these four geopolitical areas.
Data
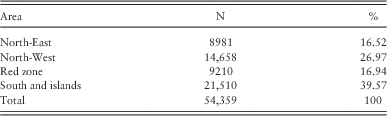
The data we employed are raw numbers of votes for the 2008 and 2013 Chamber of Deputies elections at the lowest available level of aggregation, which is the polling station.Footnote 7 Unlike other multi-party systems, in Italy it is possible to obtain data at the polling station level, which is required when using the Goodman model. There are slightly >60,000 polling stations in Italy, and they include between 500 and 1200 voters. Two out of the 27 electoral districts into which Italy is divided (i.e. Valle d’Aosta and Trentino Alto-Adige) were excluded from the analyses because they have party landscapes that are not comparable with the rest of the country. In order to be included in our final data set, polling stations need to have a between-election difference in the register (i.e. the list of those eligible to vote in a particular polling station) of no more than 10%. This way we avoid potential problems caused by voters’ lists with excessive changes such as those in hospitals.Footnote 8 As a result of the application of these criteria, data from 89.35% of the total number of polling stations (i.e. 54,359 out of 60,602) were used in the analyses.
Table 2 shows the amount of polling stations per geographical area. The flows of vote estimates for each of the four areas were weighted by the number of members of the polling stations. The national flows of vote estimates were obtained by calculating an average of the estimates of the four areas weighted by the number of polling stations in each area.
Polling stations per area

Before proceeding with the interpretation of the results, a final clarification is needed about the way non-voters were treated. Since this article deals with the concept of abstention as a non-expression of preference for any party, non-voters are defined both as voters who do not vote at all and those casting a vote for what is a ‘not vote’ choice on the election ballot (i.e. blank and spoiled votes). Consequently, given the inclusion in the analysis of the blank and spoiled ballot papers, we describe something that would be more correctly defined as no-vote rather than abstention.
Results and discussion: who are the M5S voters?
In this section, we will present the swing vote estimates first at the national and then at the subnational level. We will primarily focus on the composition of the M5S electorate, that is, from which parties and ideological bloc this new political actor obtained its voters.
Flows of vote: the national-level dynamics
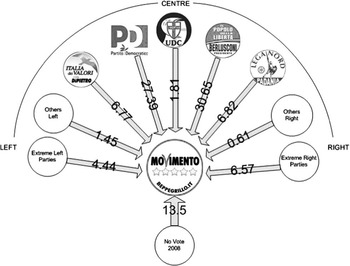
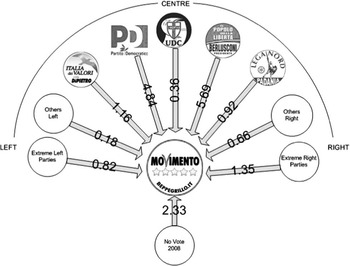
Figure 2 presents the first set of results looking at the electoral origin of the M5S vote. This figure has to be interpreted as follows: when considering the whole sum of votes obtained by the M5S, different shares of this amount come from each of the 2008 (groups of) parties.Footnote 9 By looking at Figure 2, the first thing we see is that M5S actually gains about the same amount of votes from both the left and the right. In fact, Figure 2 shows that 40.06% of the M5S votes come from left-wing parties (i.e. the sum of Italia dei Valori, PD, the extreme left and other left-wing options) while 46.46% come from right-wing parties (i.e. the sum of LN, PdL, the extreme right and other right-wing options). The proportion of transfers is particularly high in the case of the two main parties, PD and PdL. In overall terms, 6 out of 10 M5S voters have shifted their support from one of these two parties in 2008 to Beppe Grillo’s Movement in 2013.
MoVimento 5 Stelle (M5S)’s incoming voters between 2008 and 2013 general elections (on the total of votes received by M5S).

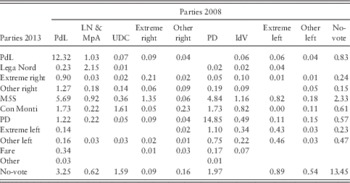
In Table 3, it is fundamental to remember that the whole population that is eligible to vote, rather than only the valid votes (as in Figure 2), is considered. In order to correctly read Table 3, consider first that the total of the whole table is 100%. The matrix gives you the percentage of eligible voters that is in a particular situation. For example, 5.52% of the eligible voters voted for PdL in 2008 and M5S in 2013, while 5.69% voted for PD in 2008 and shifted to Grillo’s party in 2013. After adding up all these movements, we can see that 17.7% of the eligible Italians voted for the M5S in the 2013 elections. Table 3 also shows an interesting element with regard to the mobilization of former non-voters. Although, as indicated in Figure 3, the votes coming from former non-voters make up only 13.49% of the total votes of M5S (2.33% of eligible voters in Table 3), when looking at Table 3 it is possible to observe that M5S is the party that mobilized the highest amount of former non-voters. None of the other parties reach even one-third of that amount. These findings confirm the main trends found by the survey estimates (De Sio and Schadee, Reference De Sio and Schadee2013) and by previous aggregate-level analyses (De Sio and Paparo, 2014).
MoVimento 5 Stelle (M5S)’s incoming voters between 2008 and 2013 general elections (on the total voters’ transfers).

Total voters’ transfers between 2008 and 2013 general elections

PdL=Popolo della Libertà; LN=Lega Nord; MpA=Movimento per le autonomie; UDC=Unione di Centro; PD=Partito Democratico; IdV=Italia dei Valori; M5S=MoVimento 5 Stelle.
Flows of vote: the subnational-level dynamics
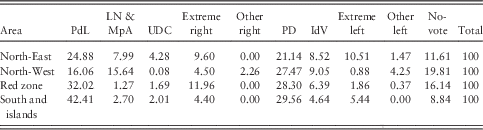
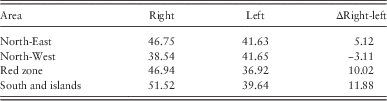
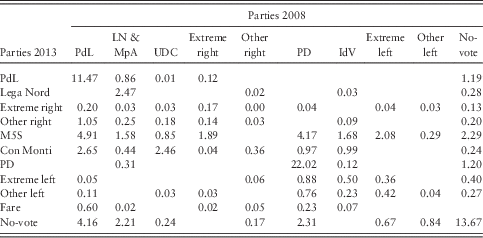
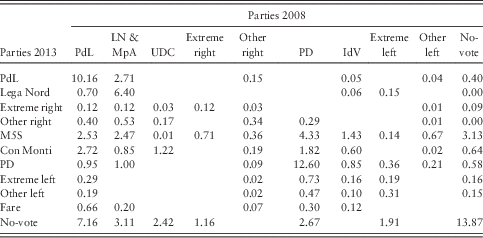
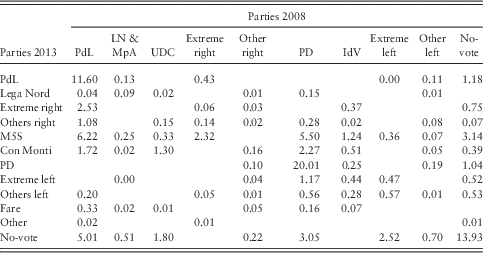
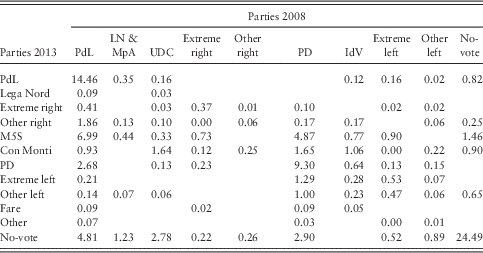
Analogously to Figure 2, Table 4 presents the set of results looking at the electoral origin of the M5S vote per geopolitical area (to check the total vote transfers between 2008 and 2013 for each geopolitical area see the Appendix). In order to better highlight the dynamics concerning the swings from each ideological bloc, Table 5 summarizes the amount of swing voters coming from the right and left blocs.
MoVimento 5 Stelle (M5S)’s incoming voters between 2008 and 2013 general elections for each geopolitical area – focus on parties (%)

PdL=Popolo della Libertà; LN=Lega Nord; MpA=Movimento per le autonomie; UDC=Unione di Centro; PD=Partito Democratico; IdV=Italia dei Valori.
MoVimento 5 Stelle’s incoming voters between 2008 and 2013 general elections for each geopolitical area – focus on ideological bloc (%)

Table 4 highlights a few interesting dynamics. First of all, swing voters are coming from the main parties, PdL and PD, in different proportions across areas. The PdL seems to have the largest variation, as it goes from the 16.06% of the North-West to the 42.41% of the South and the islands. However, when looking at the LN results, this pattern is easily explained, as it appears clear that the LN balances out the lower migration of PdL voters to the M5S in the North-West. A similar outcome is observable in the North-East. The losses of the PD towards the M5S show less variation, but also in this case it is important to notice that its main ally, Italia dei Valori, has a steadier and equally distributed loss towards the M5S across areas.
A remarkable dynamic that involves both PdL and PD is that they suffer the most severe losses in the South and the islands. This is also the area in which M5S is able to mobilize the smallest amount of previous non-voters – this is not surprising considering that historically this is the geopolitical area with the highest abstention rates (Putnam, Reference Putnam1993; Tuorto, Reference Tuorto2006). It is also interesting to notice that the extreme parties, both left and right, have a particularly high amount of losses in two out of the four areas. The extreme right-wing parties have a more homogenous dynamic, but still the highest losses in favour of the M5S are located in the North-East, and, quite unsurprisingly, in the Red zone. The extreme left-wing parties suffer the highest losses in the North-East and in the South and islands.
Table 5 illustrates the overall swing from the right and the left-wing blocs in favour of the M5S. If at the national level the difference between the left-wing and the right-wing blocs was 40.05% from left-wing parties and 46.46% from right-wing parties, the picture at the subnational level reveals a much more nuanced situation. Both areas in the North have a less dramatic difference in terms of left-wing and right-wing swing voters, whilst transfers in the Red zone and in the South and islands are noticeably higher for the right-wing bloc. Despite these differences, the overall dynamic of switching towards the M5S can all in all be considered quite homogenous across areas.
Conclusion
Using a newly compiled data set comprising all the actual data from the 2008 and 2013 parliamentary elections and composed of the four traditional geopolitical Italian areas, this article shows that the flows of votes from the two main centre-right and centre-left parties and the mobilization of previous non-voters are key in understanding the success of the M5S. Our analysis largely confirms the findings of other studies that addressed the same topic drawing on survey data. However, it also highlights some new features that emerge at the regional level in spite of an overall homogeneity across areas. In fact, in the North-East and North-West the swing voters are switching towards the M5S in a quite balanced way, while in the Red zone and in the South and the islands the swing voters are significantly switching more from the right.
Although the more evident limit of this method lies in the impossibility to understand the reasons for the swing, at least two relevant sparks for future research emerge. The first one is linked to Hirschman’s (Reference Hirschman1970) theory on exit, voice, and loyalty. Within this framework, a vote for a party other than the one usually supported that involved a definitive abandonment of a political option could be given an exit interpretation, whereas it would be understood as a voice option if it entailed a mere signal of temporary dissatisfaction (Weber, Reference Weber2011; Passarelli and Tuorto, Reference Passarelli and Tuorto2015). While it is hardly new to claim that the support of the two main centre-left and centre-right parties for Monti’s technical government and the bad economic context disappointed large amounts of PdL and PD voters, it is still not fully understood which the long-term consequences of these vote transfers were. For example, even admitting difficulties to compare elections across levels of government, it is good to know that the M5S vote suffered important drops in the 2014 European Parliament and the 2015 regional elections (of about 4 and 9% compared with the 2013 parliamentary election, respectively) but won the 2016 mayoral elections in Rome and Turin.
Second, the results of this article also suggest that a new cleavage has emerged in Italian politics. De Sio and Schadee (Reference De Sio and Schadee2013) show evidence of a two-dimensional political space in Italy (left-right and anti-pro establishment), and find that the least ideological supporters of mainstream parties were more likely to defect from their previous party. Hence, an untested dynamic that seems plausible is the combination of a lack of ideological definition of the M5S and the continued persistence of the left/right dimension. In fact, Bartolini and Mair (Reference Bartolini and Mair1990) demonstrated that most volatile voters did not change party families and remained loyal to their ideological bloc in Europe between 1885 and 1985. Likewise, a high percentage of Italian voters was faithful to one coalition (centre-left or centre-right) in the 1990s (Natale, Reference Natale2000), and less than 10% of voters switched blocs between 2006 and 2008 (Russo, Reference Russo2014). Grillo’s party represented the first non-ideological viable option in the electoral history of Italy, and whether or not this provoked the demise of ideological voting in that country merits further research.
Acknowledgement
The authors wish to acknowledge the Archivio Storico della Camera dei Deputati for providing the data for the 2008 and 2013 elections.
Data
The replication data set is available at https://dataverse.harvard.edu/dataset.xhtml?persistentId=doi%3A10.7910%2FDVN%2F2K58F2&version=DRAFT.
Appendix
North-East

North-West

Red zone

South and islands