


INTRODUCTION
Agriculture is important in Timor-Leste's economy and culture. More than 70% of the population lives in rural areas, with 63% active in cropping and more than 86% involved in raising animals (MOF, 2011). The country is very mountainous, with four peaks above 2200 m within an area approximately 240 km long by 60 km wide (Supplementary Figure S1). The wide topographic diversity of Timor-Leste supports a wide range of crops despite its small area.
Elevation and north/south aspect are the main drivers of variation for annual rainfall totals across the country (Figure S2). The lowest rainfall areas lie along the north coast (< 1000 mm) and the highest rainfall areas are associated with high elevations. The north coast has a single short wet season, whereas the south coast has a bimodal wet season. The bimodal season not only reduces the length of the dry season, but also contributes to an increased total annual rainfall.
Efficient resource allocation for agriculture development is hindered by the highly variable landscape, and diverse farming systems, even in small areas. Rural development programs are often allocated to work in a single one out of the country's 12 rural districts. Faced with major diversity of agricultural livelihoods within any one district, progress is often hampered by spreading meagre resources across a large range of activities. All but one district include some flat coastal areas, and cooler mountainous regions with highly diverse systems of agriculture. An approach that could group villages into particular agricultural zones – based on their agricultural systems – would allow more targeted rural development nationally. Currently, the country has no method for defining the locations and types of agricultural zones nationally. Efficient rural development requires a simple method to define the location and description of livelihood zones across the country. Such a method needs to be easy to apply but to be consistent with the quantitative data available for each village.
In a first attempt at describe the climate zones of Timor-Leste, ARPAPET devised a system that splits the country into six agro-ecological zones based on elevation and north/south aspect (ARPAPET, 1996). There are three zones in the north facing side of the island, and three on the south facing side. The coastal zone extends from sea level to 100 m elevation, the next zone is from 100 to 500 m elevation, and above 500 m is the third zone. More recently Molyneux et al. (Reference Molyneux, Rangel da Cruz, Williams, Andersen and Turner2012) added a seventh (temperate) zone for areas above 2000 m in elevation, where temperate crops such as wheat, barley, plums and peaches are grown.
The ARPAET classification was based only on elevation and aspect, and was unable to include aspects of the farming system, and the types of crops grown and animals raised. As such the zoning was unable to direct or guide development activities based on similar agricultural activities. For example, the presence/absence of an irrigation system and local preference for particular animals were not reflected in the ARPAPET zones.
The Ministry of Agriculture and Fisheries (MAF) and development community were looking for a way to zone the rural areas of Timor–Leste based on the farming systems. Such zoning would need to rely on extensive knowledge from a group of experts concerning the whole country, or some national level data available for all 442 villages in Timor-Leste. Expert knowledge based on every village was not considered feasible, so zoning had to rely on quantitative-national data sets.
Kostrowicki (Reference Kostrowicki1977) presented a summary of the theoretical basis of agricultural typologies and the distinction of typology and regionalisation. A regionalisation is based on the location of the agricultural activity, and is static by nature, whereas the typology is responding to the type of agriculture conducted and is dynamic over time. The current system in Timor-Leste, of seven agro-ecological zones, is a static regional system. A typology is a dynamic system that is based not on differences between locations, but the similarities of the types of activities between locations.
Typology development requires a number of steps. The first two steps are intertwined and are (1) the selection of the variables to be utilised and (2) the methods by which the similarities are measured. Kostrowicki (Reference Kostrowicki1977) did not make firm recommendations on the variables to be included or the way that similarity is measured, but left those choices to researchers involved. Once the typology is established, the third and final step is to delimit agricultural zones by generalisations of the more complex typology pattern to a simpler regional picture, based on the dominance or co-dominance of individual types over a given region.
Timor-Leste has not completed an agriculture census since the restoration of independence (2002) but has completed many other national level surveys. These include the income and expenditure household survey, demographic household and Nutrition survey (DHS, 2009/2010). Unfortunately, all of these surveys are quite small and only sample a small percent of the population, which does not include all villages. For example, the most recent latest DHS survey sampled less than a quarter of the 442 villages.
By contrast, the national census (2005 and 2010) covered every single household in the country (MOF, 2011). The most recent census asked each household about the range of agricultural activity the household was involved in. Each household was asked whether they grew any of 10 crops or crop types, and how many of each seven animals they had in the household at the time of survey.
There are many different variables and methods to type variables together to group farming systems into different types. Some typologies use only the dominant crop to delineate homogeneous systems (Kelley et al., Reference Kelley, Jayawant and Partasarathy-Rao1997) even though Kostrowicki et al. (Reference Kostrowicki1977) recommended a wide range of variables.
Given the demand for clear agricultural zones, and the availability of census data at the village level, the research question is: Can a descriptive and relatively simple map of agricultural zones be produced from village census data using Timor-Leste as the example.
This research paper follows on the theoretical basis of typology development with the aim of developing a useful typology of Timorese agriculture for agricultural planning using national census data. The paper first summarises the agriculture information from the national census of 2010, and then based on a hierarchical clustering technique, groups villages that have similar agriculture systems. Based on the output of the statistical clustering the types of agriculture system were defined, and then a set of simple rules were developed to present a typology of agriculture in Timor-Leste. The resulting typology was then tested with practitioners and professionals in the field.
METHODS
Census data and cluster analysis
This study used agricultural variables from national census data to develop a typology for agricultural livelihoods in Timor-Leste. A population census was conducted throughout Timor-Leste in 2010. The reference date for the village census was midnight 11/12 July 2010 (MOF, 2014). Enumerators asked questions and recorded responses of each household in Timor-Leste from 12–25 July. The questionnaire consisted of 6 parts (and 82 questions), and was developed in a participatory approach with many branches of government and civil society. Under Section 5, named ‘housing and household amenities’ section, households were asked which crops they grew (if any) and the number of each type of animal(s) held by the household.
There were 10 options for crops grown in the census. These were five individual species (rice, maize, cassava, coffee and coconut) and five crop groups (vegetables, temporary fruit, permanent fruit, other temporary crops and other permanent crops). Temporary fruits include pineapples, passionfruit and papaya. Permanent fruits include fruit trees such as mangoes, jack fruit and citrus and other permanent crops such as cloves, cinnamon and candle nut. Households reported if they grew each crop/crop type or not. There was no minimum threshold area or amount of production for each crop. In addition to the number of crops grown, each household gave information on the numbers of seven species of animals, namely chicken, pig, sheep, goat, horse, cow and buffalo. All the above data are reported at the village level. In addition, the number of farming households are reported, but only at a higher level than the village (sub-district).
Only rural villages were considered in this typology. Of a total of 442 villages, 28 were defined as urban and excluded from the analysis. The excluded urban areas are located in the national capital (Dili), as well as the capital cities of the rural districts and sub-districts. The criterion to be a rural village was to have a population density below 500 people km−2. The average population density of rural villages was 90 people m−2.
National level data were summarised using two methods: The first method included all households in rural areas. The second method only included households involved in farming.
Village level data for the 414 rural villages were compiled into an Excel spreadsheet. All data were analysed at the village level. The data included the number of households that grow a range of 10 crops (and crop types), percentage of households with each of the seven species of animals, and the average number of each animal per household. In total this gave a matrix of 414 villages, each defined by 24 variables.
Cluster analysis was used to group similar villages based on the 24 agricultural variables as in Joffre and Bosma (Reference Joffre and Bosma2009). The analysis combines villages with similar levels of the 24 variables into groups of villages. The variation between the groups is compared to the original variation between the 414 villages. As the number of groups reduces from 414, the percent variation retained in the resulting groups also reduces. At any step in the process, the analysis can be stopped and queried for the number of groups, members of each group and the percent variation retained between those groups. Choosing the end point of the clustering procedure was based on the ‘elbow test’ (Thorndike, Reference Thorndike1953) that balances percent of the variation retained with a manageable and meaningful number of groups (Mooi and Sarstedt, Reference Mooi and Sarstedt2011).
The hierarchical cluster analysis routine of GenStat 16 (VSN International, UK) was used to complete the analysis. Group means were used to cluster similar groups together as in Madry et al. (Reference Madry, Mena, Roszkowska-Madra, Gozdowski, Hyrniewski and Castel2013). Velicer and Jackson (Reference Velicer and Jackson1990) suggest that although there are many different options in cluster analysis, in practice there is little difference in the output.
Average characteristics of each of the livelihood groups (11) were computed and mapped. Although no geographical data were used in the clustering analysis, villages belonging to each livelihood group were generally located next to or near each other. Based on a range of features of each livelihood, a set of rules was developed to mimic the cluster analysis output as close as possible. Once the rules were formulated, they were applied to each village, and each village was defined as one of the rule-based livelihood zones, and finally maps of each of the zones were produced.
Geographic and social characteristics by group
This report also used a wide range of physical and social descriptors of each village. Characteristics used in this analysis include elevation (m above sea level, asl), annual rainfall total (mm), population density, adult literacy rate (%), percent births delivered by trained assistant, access to electricity (%), percent of female headed households, improved water supply (%), net school enrolment rate (%), sex ratio, distance (km) by road to the district capital, distance (km) by road to national capital, Dili and a village asset index. Village level data of these parameters were sourced from the ADB report, least developed villages (ADB, 2013).
A one-way analysis of variance (ANOVA) by group was performed to determine if the zones differed from each other for these indicators.
RESULTS
Each farming household in Timor-Leste grows a wide range of crops. More than two-thirds of the cropping households grow maize, cassava, vegetables, fruit and other non-specific temporary and permanent crops. Thus, amongst all rural households, more than half grow maize, cassava, vegetables, fruit and other crops. Animal production in households is similarly very common, with more than two-thirds of rural households raising chickens and pigs. Larger animals are less common, with only 12% of households raising buffalo. Among the seven animals recorded, sheep are the least common – reported in only 4% of households nation-wide. As a result of the high frequency of a wide range of cropping and animal raising activities, many households have a diverse mix of many enterprises.
The spatial distribution of most cropping activities is not random across the country. Maize and cassava are widely distributed across the country (Figures S3 and S4), whereas coffee and rice are localised in elevated areas and irrigated areas, respectively (Figures S5 and S6). Sheep production is restricted to the northern and drier coastal regions (Figure S7), while goats are mostly raised in the northern half of the county in the central and western parts (Figure S8). Cattle are concentrated in west and southern part of the nation (Figure S9), and buffalo are more clustered in the southern and eastern parts (Figure S10).
The correlation matrix (Figure 1) shows which activities are often associated with each other. There are generally high positive correlations between the levels of cropping of non-rice crops. For example, the level of maize grown in a village is correlated to the level of cassava, fruit, vegetables and other crop production. Rice production is not correlated with the production of other annual crops, but is positively correlated with coconuts and negatively with coffee production. Coffee planting is generally negatively correlated with animal production, especially buffalo.
Correlation coefficient (r) matrix between 17 agricultural descriptors in 414 villages in Timor-Leste.
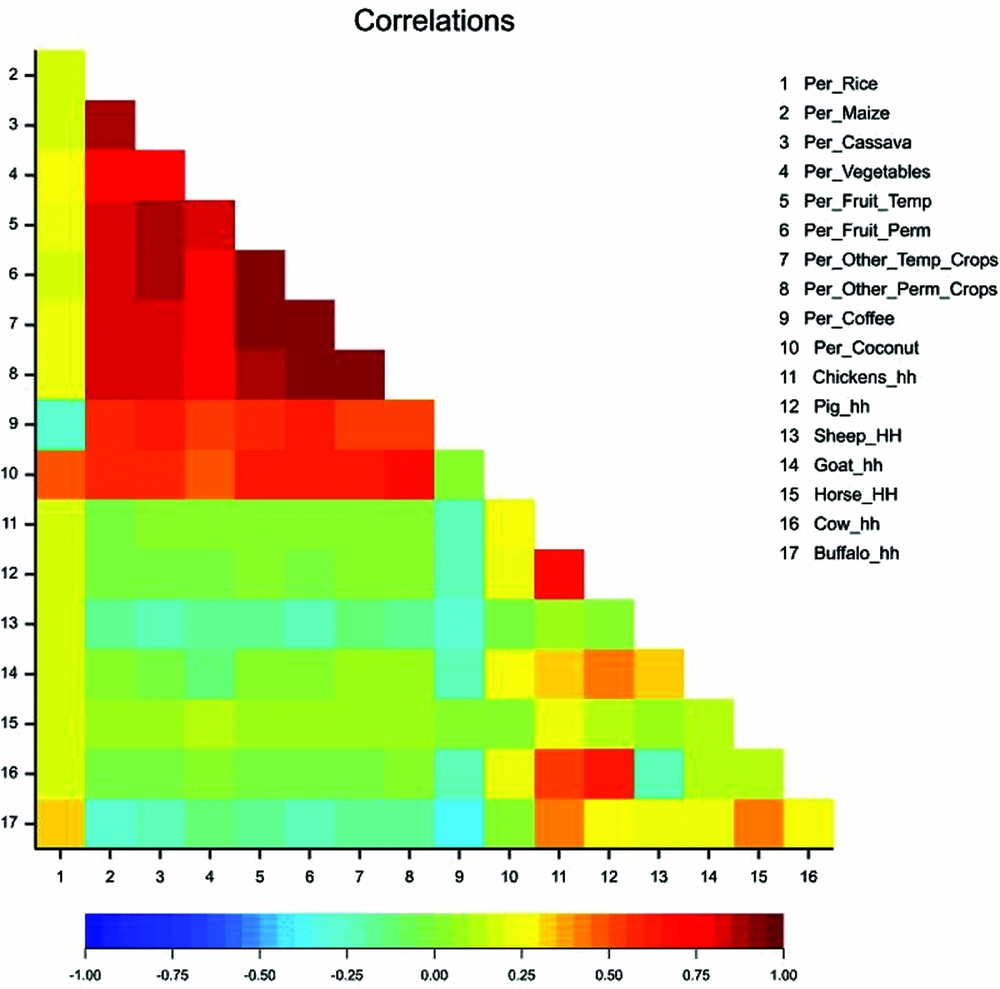
Amongst the level of animal ownership, the levels of cow, pig and chicken ownership are generally positively correlated with one another.
Clustering on cropping and animal ownership characteristics
The 11 groups formed as a result of cluster analysis, retained 83% of the variation between the original 414 villages, and these generally correlate with the geography and climate of Timor. Any further increase in the percent variation retained (and number of groups) led to a large number of smaller splinter groups. Such smaller splinter groups were not recognisable as coherent entities. For example, with an end-point of 86% variation, the extra four groups had an average of five villages per group. As a result the 83% variation threshold was selected.
Table 1 defines important characteristics of each of the 11 groups. Each group is defined as a livelihood system. The number of villages in a livelihood system ranged from 3 to 84, with nine of the 11 systems having 24 or more villages. Each of the systems was characterised by which activities that were most different from average.
Characteristics of the 11 distinct livelihood systems defined by cluster analysis, based on cropping and animal raising data from the national census. Crop data are percentages of households in a village growing each crop/crop type (no minimum area), and data for animals are the numbers raised per household for each of seven animal species averaged over the village.

Coffee growing households dominate four of the 11 systems identified in the cluster analysis, and comprise 31% of the population. In these areas, more than 57% of households grow coffee, which is above the national value of 44% of households growing coffee (Table 1). The largest of the four coffee systems (78 villages) has significant levels of coconut and vegetable production, and a high level of chicken ownership. The next largest system (32 villages) has a very low level of animal ownership; while a third system (24 villages) has a low level of cropping and animal ownership. The fourth coffee system is small consisting of only three villages and is distinguished in having high levels of chicken, pigs and coconut ownership in the village.
Rice cropping dominates another set of three systems covering 96 villages overall containing 240 000 households representing 30% of the population. Rice production is spread throughout the country in pockets – from the western border with West Timor, Oecussi, the Maliana plain, irrigation areas on the south coast, the Baucau–Viqueque districts and elevated areas in the district of Los Palos (Figures S6 and S11). The largest rice system (52 villages with 86 000 people) has a high level of planting other crops and average animal diversity. The second rice system (24 villages, 24 000 people) has a much lower level of crop diversification. The third rice system (20 villages, 20 000 people) has significant numbers of sheep and buffalo but an even lower level of non-rice cropping. All the 14 villages with high sheep ownership are on the North coast in Manatuto and Baucau in the driest part of the country, where sheep production is suited.
The remaining four systems have a relatively low percent of households involved in cropping. The largest of these four systems (84 villages, 185 000 people) have above average numbers of large animals. Animal ownership is an important feature of two of these remaining systems, and the last system has below average-level of cropping and animal ownership.
Each of the 11 livelihood systems are associated with particular geographical areas rather than randomly distributed across Timor-Leste (Figure 2). The first four systems (based on coffee growing) are centred in the elevated cool inland regions of the island, generally these areas are above the contour of 700 m above sea level with more than 2 000 mm of annual rainfall.
Map of livelihood zones of Timor-Leste with village boundaries.
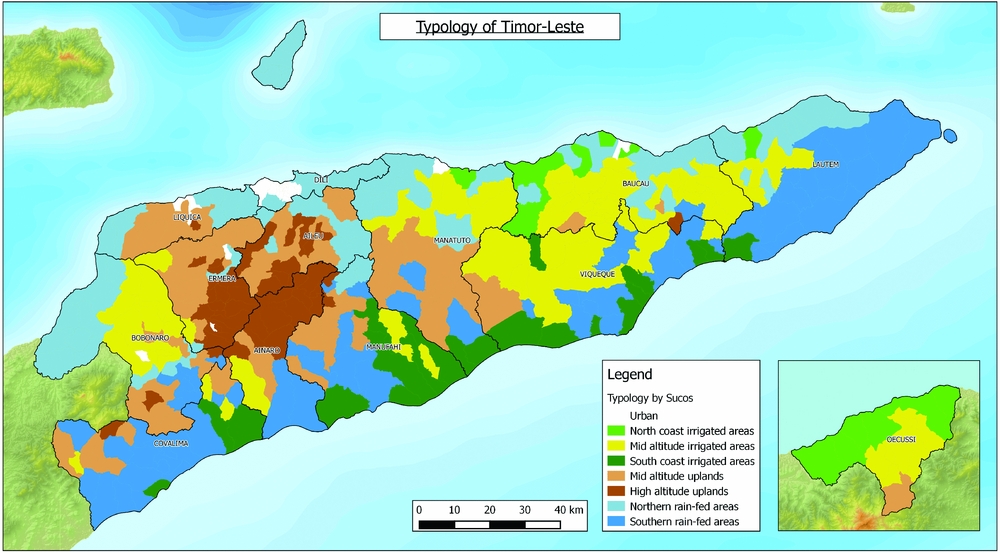
The rice-based livelihoods are in areas where there is irrigated land. As seen in Figure S11, these villages are spread from the North coast, South coast and also some mid-altitude areas. Rice cultivation in the dryer north coast is associated with sheep and goat production; elsewhere rice-based villages raise other animals.
Livelihood systems based on large animals (buffalos and cows) lie mostly in the southern half and eastern end of the country. There are also pockets of cattle production on the central north coast and north-east end of the island.
Defining livelihood zones from livelihood systems information
The livelihood systems information was then used to define livelihood zones. As a result of the geographic localisation of most of the livelihood systems, a proposal of livelihood zones was established. Livelihood zones are areas where villages have similar agriculture production and potential.
Based on the lessons learned from the cluster analysis, a set of rules was developed to mimic of the outputs of the cluster analysis. These rules were then applied to each village, and each village was allocated to one of the zones, based on simplified rules. The matrix of the number of villages in each of the 11 groups based on cluster analysis and the seven typology zones is given in Supplementary Table S1.
The cluster analysis showed that most of the differences between villages are based on the level of rice and coffee production. Rice production regions are dependent by irrigation availability and coffee production is limited by altitude/temperature and rainfall. This contrasts to the situation of other crops such as maize and cassava which have a wider adaptation and distribution across the country. As a result, the definition of zones is primarily based on the intensity of rice and coffee production among households in a village.
The first rule was therefore to separate rice growing villages from non-rice growing villages. Rice zones are defined as having more than 35% of households involved in rice farming. These villages are further divided into three zones based on their locations in the pockets in the North coast, mid-altitude and South coast.
The second set of zones is based on those villages with more than 50% of households harvesting coffee. This is based on 4 of the 11 clustered groups that are distinctive based on participation in coffee production. The coffee-based zones are further split based on the elevation of the village. The cluster analysis showed that at higher elevations, the livelihood system became less diverse with less animals and less diversity of the tropical crops grown in much of the rest of the country. To mimic this output, the villages with a majority of households picking coffee was split into those above and below 1100 m elevation. This resulted in two coffee-based zones, comprising 12% and 22% of the population, respectively.
The final two zones of the seven zone typology were villages where households did not grow either rice or produce coffee. The clustering analysis shows that such villages on the north coast have more sheep and buffalo, where areas on the south coast have more cows and buffaloes. These non-rice and non-coffee villages were therefore split into two zones, that reflected the climates and types of animals at each household. Villages in the north of the island receive a single rainfall season, from December to March, whereas the south coast and the far eastern end of the island have a much longer wet season that results in greater total rainfall.
A summary of the rule based zones is presented in Table 2 and a summary of zoning typology rules follows:
1. Villages with more than 35% of households involved in rice farming.
1b. Geographic sub-division of rice farming villages into North coast, mid-altitude and South coast.
2. Villages with more than 50% of households harvesting coffee.
2b. Coffee villages divided based on their elevation: above and below 1100 m elevation.
3. Villages with less than 35% of households growing rice and less than 50% of households growing coffee
3b. Geographic division of non-rice and non-coffee villages into north watershed and south watershed.
Description, definition and population of seven livelihood zones of rural villages in Timor-Leste. Data based on 2010 national census.

*HH = Households.
Zone descriptions
The seven livelihood zones differ from each other in many characteristics. By definition, the mid and high altitude zones are cooler than the other zones. The north coast irrigated zones have the lowest annual rainfall. Rainfall is higher in the south coast zones, and higher again in the elevated areas. A brief description of the livelihood zones is given below.
1. North coast irrigated zone: Located in the coastal areas of Oecussi, Manatuto and Baucau with very low rainfall, short wet season and high temperatures. They have improved access to services such as health, roads, water and sanitation with a high asset index. These households are predominately rice growers (Table 3). As with other coastal systems, crop diversity is lower than in elevated areas. They have similar diversity in livestock although some households have comparatively high numbers of sheep (Table 4).
2. Mid-altitude irrigated zone: Located in the Maliana basin, the eastern mountain region of Baucau, Luro and Viqueque as well as the elevated area of Oecussi. The large population in this zone has low access to health services and low access to improved water and sanitation (Table S2). They also have the lowest asset index. These households focus their efforts on rice production but also have a good level of diversity in both crops and livestock with high numbers of buffalo.
3. South coast irrigated zone: Located in pockets along the South coast, this zone has many similarities to the North coast rice system. Significant differences include the length of the wet season – the South coast has a long bimodal wet season. These South coast villages have larger holdings of cows and buffalo than sheep and have a low asset index.
4. Mid-elevation upland zone: Located in lower mountain regions of central Liquiça and Ermera as well as in pockets throughout all districts except Covalima and Lautem. These villages receive above average rainfall although there will be differences in the length of the wet season from north to south. They have a low asset index, very low access to electricity, but 60% have access to improved water supply often from small gravity-fed springs. While this zone is marked by coffee production they are also generally more diverse in their cropping systems being at a relatively low altitude bordering coffee and non-coffee systems. There tends to be more rice, coconut and buffalo in these villages than the high-altitude coffee systems.
5. High elevation upland zone: Located in the highland regions mainly in Ermera, Aileu and Ainaro with pockets in other districts. This system receives a very high amount of rainfall often on steep slopes. The zone has the highest population density and second highest total population. The zone has low literacy rates and very low access to health services, sanitation and water even though they are relatively closer to Dili than the other systems (Table S2). This zone has a focus on coffee similar to the mid-elevation upland zone; however, the villages in this zone are less diverse in production of other crops and livestock. Maize and cassava are a prominent feature of the system and nearly one third of households have at least one horse. Most households also have around two pigs and a few chickens. At the higher elevations, temperate crops like wheat, barley, plums and peaches are grown.
6. Northern rain-fed zone: This zone is located along the north coast from the western border in Bobonaro to Baucau in the east as well as the whole island of Atauro and some pockets scattered through the mountains. Their asset index is the second highest. Although other indicators such as health, electricity, sanitation and water are low, they are still comparatively higher than other zones. This zone is marked by having low specialisation in any particular crop and a low diversity within their system. Annual rainfall is very low and not supported by irrigation systems like the north coast irrigated zone. These are the households often working the dry, arid slopes along the North with low production levels who are struggling to find water. Only around half the households grow maize or cassava. Most households raise chickens and pigs. They have the highest rate of goat ownership. This zone may be more reliant on coastal fishing and firewood collection – data for which are not included in the census.
7. Southern rain-fed zone: This system is located along the south coast and the eastern end of Timor-Leste especially in the districts of Covalima, Ainaro, Manufahi, Baucau and Lautem. They constitute the highest population zone but have low access to services such as health, electricity and sanitation.
Cropping characteristics of the seven livelihood zones based on a rule-based system. Percent of households growing each crop. The F probability and LSD from one-way ANOVA by zone are shown.

Animal husbandry characteristics of the seven livelihood zones based on a rule-based system. Percent of households raising each type of animal and animal holdings of the seven livelihood zones. The F probability and LSD from one-way ANOVA by zone are shown.

This system is marked by low specialisation and low diversity. In comparison with rice systems along the south coast they score lower in all crop and livestock commodities except horses (which are still low). Less than half the households grow maize or cassava or vegetables and very few grow rice. It is assumed that those who do grow maize grow large areas as districts such as Lautem are one of the largest maize producers in the country. Along the south coast there is low population density and the common occurrence of 1 ha lots assigned during the Indonesian period.
Expert confirmation of typology
The livelihood zone typology has received a positive response from the development community working in Timor-Leste including Government, bilateral donors and NGOs. The seven livelihood zones were used effectively in 2014 by the MAF and the Australian Government Department for Foreign Affairs and Trade (DFAT) to select target zones for the planned agriculture development project – TOMAK (To'os Ba Moris Diak – Farming for prosperity). This provided expert confirmation of the usefulness of the new livelihood zone typology.
DISCUSSION
This research has shown that it is possible to develop a useful typology of agricultural livelihoods using village level census data. Utilising the three step approach of typology development of Kostrowicki (Reference Kostrowicki1977), the census data were found suitable to produce descriptions of the types of agriculture at the village level.
The size of the data set for analysis (in this case a matrix of 414 and 20 agricultural descriptors) required the use of quantitative statistics to identify naturally occurring groups within the 414 rural villages. Hierarchical clustering was found to be a very useful and quick tool for the production of typologies as demonstrated by Tittonel et al. (Reference Tittonell, Muriuki, Shepherd, Mugendi, Kaizzi, Okeyo, Verchot, Coe and Vanlauwe2010) with small farms in Africa and by Joffre and Bosma (Reference Joffre and Bosma2009) with shrimp farmers in the Mekong delta. As stated by Landais (Reference Landais1996), statistical approaches are assumed to be ‘blind’ where no a priori perception of the context influences the operator of the typology in determining the drivers of farming system diversity (Berre et al., Reference Berre, Baudron, Kassie, Craufurd and Lopez-Ridaura2016). Using this definition the typology developed herein is also being considered ‘blind’. Another positive feature of our approach which uses a methodology employing national census data from every rural village in the land ensured the entire country was treated in the same manner, with consistent questions and a single method of data analysis. The Government of Timor-Leste has responded well to this, appreciating the rigour and logic that underpins the analysis to explain and justify interventions.
The wide diversity of agriculture systems in Timor-Leste enabled its 414 rural villages to be reduced to 11 groups, while maintaining 83% of the original variation between these villages. Clearly, the very distinctive types of agriculture across villages within the country led to the success of the method.
The distribution of villages with similar livelihood systems established by cluster analysis was found to be clearly geographically linked allowing the establishment of livelihood zones in the country. The resulting zones are a useful refinement of the agro-ecological zones (ARPAPET, 1996) which were defined solely on elevation and aspect. By basing the livelihood zoning on the output of the cluster analysis based on national village-level crop and animal data, several new patterns emerged. For example, the large difference in diversity of livelihoods between the mid and high elevation uplands.
Typologies such as the one conducted herein need to be based on complete sets of data on a wide range of characteristics which is a limitation in most developing countries (Nelson and Geoghegan, Reference Nelson and Geoghegan2002). Even though the data set used here is unusually complete for a developing country there are some limitations to the described typology procedure. The first limitation is that the entire procedure to identify zones is limited by the input data – in our case the national village census. Unfortunately, a number of key activities such as firewood collection and fishing are not included. Also missing from the census data set data are many minor crops, such as tobacco, common beans and wheat. The inclusion of these crops would add to the sensitivity of the zoning. The data only records whether or not a crop is grown rather than the area or production levels. For example, a maize producer growing 500 kg for household consumption would be considered the same as a maize producer growing 5 tonnes for sale as stock feed.
A second limitation is that, because the zoning is dominated by patchy activities showing clear spatial localisation, those activities that are generally widespread across the whole country tend to be neglected. For example, more than two-thirds of households raise chickens and pigs. Due to their widespread distribution, the level of chicken and pig ownership did not contribute to the clustering, and therefore can be neglected in defining livelihood zones. There is a risk that policy makers using this system will focus on the differences between the zones, and miss important opportunities to assist households in ways that are easily transferable across the country and zones.
Livelihood zones are areas where villages have similar agriculture production and potential. This allows a rational approach to the assessment and planning for the needs, economic opportunities, environmental concerns of each zone and social improvements for sustainable development (Ikerd, Reference Ikerd2013, Galdeano et al., Reference Galdeano-Gómez, Aznar-Sánchez, Pérez-Mesa and Piedra-Muñoz2017, Piedra-Muñoz et al., Reference Piedra-Muñoz, Galdeano-Gómez and Pérez-Mesa2016). The immediate benefit derived from the typology is its capacity to provide logical and easily understood targeting. The typology can also lead to a more informed method for decision makers to allocate resources to the various zones. In the case of the Timor-Leste, aid design missions (e.g. Australian DFAT) have started using this typology to decide on target areas for intervention. Using the typology TOMAK has been able to focus around key communities, avoid dissipation and provide opportunity to plan sequential expansion over time.
To further illustrate the use of zoning, intervention points for each zone can be expressed to assist planning future research and development. For example, the following represent possible entry innovations in the zone – Mid-altitude irrigated zone – selected by DFAT for an agriculture development project. Potential areas for improvement should consider taking advantage of cooler temperatures than along the coast. Rice inputs are required to stimulate the market chain with surplus production as for other rice areas. However, the highest value in these elevated, irrigated flat areas may be dry season vegetable and common bean production.
Discussion with users (DFAT) has identified two important additional features of the typology:
1. The typology is amenable to updating to include new variables over time and thus illustrate change. Importantly, a full set of national data may not be necessary. Instead, within each livelihood zone, data could be enriched by local surveys collected. This provides the opportunity to integrate social and cultural data sets over time. Within a particular livelihood zone, it may thus give the opportunity to consider different scenarios and see how clustering is affected by changes over time.
2. The typology provides a vehicle for development programs to plan, collaborate and leverage support. Frequently development partners will work in neighbouring or related areas without any real indication of the relevance of their work to other communities. The typology offers the opportunity to identify ‘sister’ villages with similar characteristics where scaling-up may be logically targeted.
These additional unanticipated attributes of the agricultural livelihoods zoning – realised by its early users – augur well for its potential to assist agricultural development in Timor-Leste and illustrate the value of the general approach of typology development using census data.
CONCLUSIONS
The study proposes a new system of livelihood zoning that combines geographic and agricultural data. This paper shows how national census data can be used to define new agricultural livelihood zones through summarisation by clustering followed by rule development. This can be replicated wherever there is reliable village-level census data and geographic information. The output of the typology – livelihood zones – has been endorsed and is already in use by the development community in Timor-Leste.
Acknowledgements
The authors wish to gratefully acknowledge the support of the Australian Centre for International Agricultural Research (ACIAR), the Australian Government DFAT and to the Seeds of Life program. We are also indebted to the contribution of David Swete Kelly, who provided valuable feedback on the typology from the Timor-Leste government and Timor-Leste development community.
SUPPLEMENTARY MATERIAL
To view supplementary material for this article, please visit https://doi.org/10.1017/S0014479717000436


 Open access

