In October 1851 news of the whaling fleet's summer season in the North Pacific reached American ports. The reports were devastating: due to the unexpectedly early incursion of ice in the Bering Straits, many of the vessels were badly damaged, and eight were lost. Conditions were so difficult that even the vessels that escaped serious harm were unable to pursue whales. In a letter home, the first mate of one New Bedford vessel described the ordeal:
There is a solid body of ice as far as the eye can see … We were in the ice 32 hours, 9 hours of which the ship did not move with a steady wind. Our men got out on the ice and walked around half a mile; and to tell the truth I thought we should never see clear water again. Our ship is damaged a great deal. I have heard of 8 ships cast away, some in the ice and some on the land … As to whales they cannot be caught.1
Letter printed in the Whalemen's Shipping List, 28 October 1851.
The failure of the 1851 season in the North Pacific was more than a minor or localized setback for the industry. In the 1840s and 1850s, American whalers exploited the “whaling grounds” of the North Pacific more intensively than those of any other regions of the oceans. Almost 50 percent of the American fleet was in the North Pacific at the time, and the largest ports were particularly focused on this region: 72 percent of whalers from New London, Connecticut; 67 percent of those from Sag Harbor, New York; and 49 percent of those from the largest port, New Bedford, Massachusetts, were in the North Pacific.2
Author's calculations from data printed in the Whalemen's Shipping List, 28 October 1851. These three ports accounted for more than 50 percent of the entire fleet in the years 1845–1855.
The industry's focus on one region during this period was not anomalous. The history of the American whalers' exploitation of the seas is characterized by many episodes of agglomeration in specific regions of the oceans. Rather than pursuing a more even distribution among the known “whaling grounds” of the world, the industry's merchants seemed to prefer to send their vessels to the place then believed to have the best whaling, in what contemporary observers sometimes compared to a gold rush.3
The Polynesian of Honolulu, a paper of some importance to the whaling industry, compared the discovery of a new whaling ground to “the discovery of a rich vein in a gold mine. It draws all the laborers and speculators to the spot ….” (15 January 1848).
Journal entry, 5 August 1845, in Brown, In the Wake.
This pattern is puzzling when one considers the role that capital markets played in the allocation of investments in the industry. Although they almost never employed the corporate form of ownership, and instead organized their ventures in a mode closer to that of a partnership, whaling merchants were able to offer stakes in their ventures to outside investors by selling shares in their vessels.5
The organization of a whaling venture possessed many partnership-like features, such as the unlimited individual liability of all owners, and some corporate-like features, such as the transferability of ownership shares, but they were not bound by any formal articles of agreement. See Hilt, “Incentives.”
For a discussion of the rights and obligations of co-owners of vessels see Story, Commentaries, chap. 16; and Blunt, Merchant's and Shipmaster's Assistant.
The one important exception is the use of the corporate form, which was adopted on a very limited scale in the 1830s and 1840s. See Hilt, “Incentives.”
An additional benefit from greater diversity among voyage itineraries could have been reduced hunting pressure on individual whale populations.8
Davis, Gallman, and Gleiter, In Pursuit, chap. 8, document the substantial effects of hunting pressure on whaling voyage productivity.
In what follows, I analyze whaling entrepreneurs' investment decisions, and the reasons the capital market failed to engender diversity in voyage itineraries. I present a simple analysis of the financing arrangements of whaling voyages, and the moral hazard problems that may have limited the extent of sales of equity stakes in vessels, and thus the influence of the asset market on the industry's investments. I then present some empirical tests of the main conclusions of the analysis using newly constructed datasets of whaling voyages from three whaling ports from the 1840s and 1850s.9
Much of the analysis and evidence presented in the article focuses on the 1850s, because of the availability of data from that era.
WHALING GROUNDS AND VOYAGE RISKS
All of the species of whales pursued by the American industry migrate seasonally, and areas of ocean identified as places where whales tend to gather for breeding (often in lower latitudes, and in the winter months), or feeding (often in higher latitudes, in the summer months) became known as “whaling grounds.”10
The extent of the whalers' knowledge of the migratory patterns of whales, and the whaling grounds known in the mid-nineteenth century, are documented in Wilkes' Narrative. Davis, Gallman, and Gleiter, In Pursuit, chap. 4, describe the species of whales pursued by the American industry.
Many whaling grounds were identified with a particular species of whale; Clark's “Whaling Industry” includes a detailed map of the then-known whaling grounds and the species taken within them. Bockstoce, Whales, presents a detailed discussion of the unique characteristics of Arctic voyages.
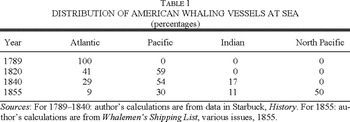
Table 1 presents the location of the American whaling vessels at various times in the eighteenth and nineteenth centuries—a coarse measure of voyage itineraries. In general, the data show a pattern of gradual expansion away from North America: initially they focused on the Atlantic; they then proceeded into the Pacific, and later the Indian Oceans; and finally, after around 1845, they focused on the North Pacific.12
This region encompasses the area above 50° north latitude in the Pacific Ocean, between the coasts of what are now Canada, Alaska, and Russia, and extending to the north into the Arctic Ocean. North Pacific voyages began to venture into the Arctic only after 1848.
Many whaling voyages had sailed into the Indian and the Pacific by the turn of the nineteenth century, and several whaling vessels visited regions of the North Pacific in the 1830s; see Stackpole, Sea Hunters; and Webb, Northwest. Eighteenth-century exploring voyages, whose findings were often published in volumes with detailed navigational charts, had documented the presence of whales in the Pacific, including the North Pacific, much earlier; see, for example, Shelvocke, Voyage; Hawkesworth, Account; Steller, Reise; and Vancouver, Voyage. The use of such charts by whalers is mentioned in The Friend, 1 November 1848.

The intense focus on the North Pacific in the late 1840s and the 1850s likely represents a similar failure. Despite its treacherous weather and harsh conditions, this region—with its abundant populations of right whales and bowhead whales, which could be used to produce whale oil and baleen—became the center of whaling activity for the American industry in the years following 1845, and was compared to “a very El Dorado” for the industry.14
The Polynesian, 4 October 1845.
Author's calculations from Starbuck, History.
In some years, voyages to the North Pacific found many whales and mild weather, and returned home with large cargoes of whale oil. At other times, however, the treacherous topography, severe climate, and changing migratory patterns of the whale populations there frustrated efforts to pursue whaling. Conditions in the worst seasons were so hazardous that most vessels returned with very small cargoes, and many vessels did not return at all.16
In the years 1851, 1860, 1871, and 1876, significant numbers of vessels were lost. Starbuck's History presents “the long catalog of whale-ships crushed by ice.”
During this period, the Whalemen's Shipping List began to compile data that can be used to measure the industry's exposure to the risks of the North Pacific, in a way that is not possible for previous periods or for other whaling grounds.
In the years of poor cargoes, the supply of whale oil in world markets fell, and one could imagine that resulting price changes might have compensated the whaling merchants. But there were many close substitutes to whale oil products, and demand was relatively elastic; see Davis, Gallman, and Gleiter, In Pursuit, chap. 9. As a result, although prices certainly did change in response to changes in supply, the years of small cargoes did indeed result in substantial losses for the whaling merchants. One New Bedford whaling merchant, in reference to the disastrous 1860 catch in the North Pacific, wrote that “we must all lose money on such a small catch” (Matthew Howland to Captain Paul Greene, 18 January 1860.)

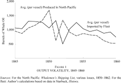
FIGURE 1 OUTPUT VOLATILITY, 1845–1860
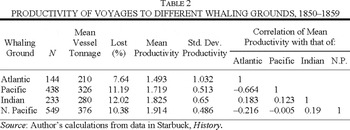
Had the fleet been distributed differently, would volatility have been reduced? We can begin to address this question at least superficially by analyzing the productivities of voyages sent to the different whaling grounds, and their correlations with one another. Table 2 presents such statistics based on a rough measure of productivity, defined as the log of real units of output per unit of input, computed from the 1,364 whaling voyages originating from the five largest American whaling ports from 1850–1859.19
The index is defined as the log of gallons of whale-oil-equivalent output per ton-month at sea, or ln((gal. whale oil) + (gal. sperm oil × rel. price) + (pounds baleen × rel. price)) – ln(vessel tons × months at sea).

The data in the table indicate that, conditional on the successful completion of the voyage, the North Pacific offered the best combination of risk and return, with the lowest of the former and the highest of the latter. However, the relatively high rate of vessel losses (10.4 percent), coupled with the large average vessel size—likely associated with greater costs—indicate that the risks associated with North Pacific whaling voyages may have been much higher than implied by the standard deviation of productivity.
The table also presents data indicating there were many strong, negative correlations in productivity between the different regions. This suggests that the distribution of vessels among the various whaling grounds was likely an important determinant of the volatility of aggregate output, and that there were likely to have been substantial gains to diversification across different whaling grounds. This is at least consistent with the notion that the strong emphasis on the North Pacific in the 1850s increased aggregate volatility, relative to some other distribution of the voyages.
MANAGEMENT AND SOURCES OF FINANCING
The industry's entrepreneurs, who managed every aspect of whaling voyages from their inception and maintained their accounts, were known as “agents.”20
The responsibilities of the agent included obtaining a vessel, and making whatever modifications or repairs the vessel required for a whaling voyage; purchasing the supplies and equipment for the voyage; hiring the captain and crew; managing the prosecution of the voyage (to the extent possible) by corresponding with the captain at pre-arranged locations; keeping all the accounts associated with the voyage; and selling the produce obtained when the voyage returned. See Davis, Gallman, and Gleiter, In Pursuit, chap. 10.
In purchasing a stake in a vessel, an investor became a partner in its voyage and was therefore obligated to finance a proportional share of the vessel's “outfit”—the supplies and appurtenances necessary for the voyage—whose cost was often far larger than that of the vessel itself.21
Butler, J. & W. R. Wing, presents a number of examples of the cost of voyage outfits.
The New Bedford agents Swift & Allen, for example, charged other investors the equivalent of 5.5 percent interest per annum (author's calculations from entries in their journal, 1847–1853, pp. 96, 273, and 320.). In cases where the investor was also a merchant in the business of supplying vessels, some of these payments might come in the form of goods.
See, for example, J. R. Thornton, journal, 1850–1855, pp. 129, 212, and 237. A few agents instead charged a flat fee for the outfit; N. & W. W. Billings of New London, for example, charged a fixed amount, $250, for outfitting a voyage, but took a larger commission on sales of output (Day Book, 1833–40).
The sales of ownership shares in vessels formed a connection between the investments of whaling agents—their voyages—and the preferences of investors. In planning a whaling voyage, an agent acted not as an independent entrepreneur, but instead as a manager who would seek investments from others. The agents often consulted with prospective investors when planning a new venture and attempted to gauge investor sentiment before initiating a voyage.24
See, for example, Charles W. Morgan, letter to R. Russel, 27 August 1834, which refers to “consultations” with vessel owners, and Swift & Allen's letters to the prospective investor L. Goddard, describing planned voyages (24 December 1849 and 13 May 1850.)
Among the most important such characteristics was the voyage itinerary. At the point in the planning process when investors purchased shares in the vessel, the intended whaling grounds for the voyage had usually been decided.25
The agent's decisions over the voyage itinerary and the identity of the captain, were generally made at the beginning of the planning process, as voyages to different seas required somewhat different outfits. The purchase of shares in a vessel was typically recorded by the agents shortly before a voyage departed.
The “Memoranda” in the Whalemens Shipping List of 7 October 1851, for example, noted that the agent Dexter Jenney purchased the bark Winthrop, and that “she is intended for the South Atlantic whale fishery, and is to be commanded by Capt. Woodward.” Similar reports were frequently presented in that publication; see, for example, 9 September 1851, 16 March 1852, and 1 February 1853.
[The] Brig Ospray, 3 years old, [was] purchased in Baltimore last week …. She has just arrived and will probably be ready for sea in April. She is a beautiful Brig of 236 Tons, newly coppered …. Captain Macomber, who has been engaged to sail for us many months, is to command her and will probably cruise entirely in the Atlantic Ocean.27
Letter from Swift & Allen to Lemuel Goddard, 24 March 1851, in Swift & Allen, letterbook 1847–52. This level of information is quite typical of Swift & Allen's correspondence with this investor; cf. letters of 1 October 1849 and 20 January 1850.
As the results of most whaling voyages could be obtained from the tables in whaling newspapers, prospective investors could easily obtain a great deal of information about the success of the prior voyages of the captain, the agent, or voyages to the same whaling grounds.28
The newspapers of most whaling ports printed detailed reports of the progress of locally sponsored voyages. The Whalemen's Shipping List, the New Bedford paper that commenced publication in 1843, printed comprehensive tables of whaling voyages at sea, which included the names of the master and agent of each vessel.
Investors' willingness to pay for a share in a vessel would have been influenced by all of this information, and could therefore have created a powerful stimulus for diversity in whaling voyages. If most whaling vessels were sent to the same place, then the expected cash flows from their voyages would have been strongly correlated with those of other vessels, and therefore aggregate income and consumption in their ports. The value of shares in those vessels should have been discounted to reflect this correlation, and the price of the equity in vessels sent elsewhere would not have been discounted to the same extent.29
The fundamental implication of models of asset prices is that expected payoffs that are correlated positively with consumption have lower prices, to compensate investors for bearing risks. Stiglitz, “Optimality,” discusses the potential of asset prices to stimulate diversity in investments in the context of the Capital Asset Pricing Model (CAPM); Baron, “Optimality,” provides a survey of the subsequent literature on the subject.
The prices investors actually paid for shares in whaling voyages were generally based on their book value—the acquisition cost of the ship and outfits, plus the commission charged by the agents. But in the case of a voyage that was highly desirable to investors, the prices paid for shares incorporated an “advance,” or premium, over book value, making it closer to a market value. Sometimes this premium was quoted as a dollar amount, for example “$100 on 1/16th,”30
Swift & Allen, letter to L. Goddard 20 January 1850. This would have represented a 6 percent premium over book value.
See, for example, J. R. Thornton, journal, 1850–55, p. 212, entries for sale of shares in ship Phocion.
Too few accounting records survive to systematically analyze the relationship between share prices and whaling grounds. Moreover, some of the surviving records of sales include transactions where a nominal payment ($1) was made, and presumably some other form of compensation was provided (see, for example, Bill of Sale, 1/16 ship Eugenia, New Bedford Whaling Museum, coll. 78.)
But the high degree of transactions costs in these exchanges limited their extent and influence. The agents' efforts—crucial determinants of the success of the voyages—would have been difficult for the investors to observe or evaluate: with the voyages subject to so many sources of risk, poor performance could always be attributed to bad luck. The agents' role as keepers of the voyages' accounts could also have been abused to defraud the other owners.33
At least a few episodes of such behavior seem to have occurred; for example the credit rating agency R. G. Dun and Company recorded in 1861 that the agent Allen Lucas “sold the oil of the ships (at least of one ship) in which they were agent & put the money into their own pockets & cheated the owners” (R. G. Dun & Co., 17 Dec. 1861, p. 569.)
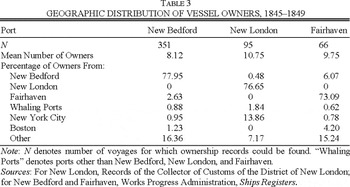
First, whaling voyages tended to have a small number of owners, who usually lived in the city in which their vessels were based. Table 3 presents ownership data, by city, for the vessels of New Bedford, New London, and Fairhaven, for the years 1845–1849.34
These data were obtained from the registers of the vessels from those ports, which at the time listed the names and cities of residence of all owners of each vessel, but not the size of each owner's stake. A description of the history of vessel registers and related documents is included in Stein, Maritime Documents.
Davis, Gallman, and Gleiter (In Pursuit, chap. 10) document the persistence of relationships between agents and particular owners in New Bedford. This suggests that the threat of withholding investments in the future, or perhaps the potential reward of increased investments in the future, in response to the perceived performance of the agent, could have provided a source of managerial incentives as well.
The role of concentrated ownership in creating incentives for monitoring management is discussed, for example, in Shleifer and Vishny, “Large Shareholders.”

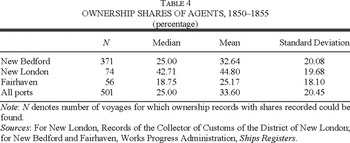
But secondly, the agents retained substantial ownership stakes in their own vessels, which addressed the problem of moral hazard more directly. Table 4 reports the average levels of ownership of agents in their vessels for the years 1850–1855, when this information was first recorded on ship registers. The data indicate that, in each port, the ownership shares of the agents were quite substantial, with a median stake of 25 percent, and a mean of about 34 percent. Evidence of the importance of these stakes for investors is found in the surviving correspondence between agents and prospective investors—when soliciting investments, the agents were careful to point out the shares they held in the vessel.37
For example, Charles W. Morgan's letter to E. J. Oelricks, 2 October 1835, mentions how he has decided to purchase part of another investor's stake in his vessel “to my own account.” Similarly, Swift & Allen's correspondence with prospective investors mentions their own stakes; see, for example, their letter of 20 January 1850 to L. Goddard. Because most investors lived in the same city as the agents whose voyages they financed, few correspondence over prospective investments survive.

Although managerial ownership may have created a powerful source of performance incentives, it necessarily impeded risk sharing between agents and other investors. As they retained substantial quantities of their vessels' equity, the agents would bear a commensurate fraction of their voyages' risks. In selecting a whaling ground for their vessels, the agents would therefore have considered not only the value of the equity they sold, but would also have considered their own stakes in their vessels.
If one of the whaling grounds was believed to be superior to the others, a merchant who held sole ownership in a vessel, or who sold very little of its equity to investors, would be very likely to send it to those superior grounds. However, there would have been some benefit for investors if some agents had selected one of the inferior whaling grounds, because of the gains from diversification that could be realized. The only way the asset market could induce some agents to select these grounds is if they sold sufficient quantities of the equity in their vessels for the price of that equity to compensate them for making that choice.38
Another possible impetus towards diversification across whaling grounds may have been hunting pressure: as more vessels sailed in the same region, their productivity was lowered. The fact that this additional motive for diversification was present makes the lack of diversity in voyages even more of a puzzle.
EMPIRICAL ANALYSIS
The analysis of the previous section suggests that the incentive to send a vessel to some whaling ground other than the one that offers the best combination of risk and return is increasing in the fraction of the vessel's equity sold to other investors. The larger the fraction of the vessel's equity sold, the greater the influence of asset prices, and thus the preferences of investors, on the whaling ground choice for the voyage.
Beginning around 1850 the registers of all U.S. vessels engaged in overseas trade, which included whaling vessels, recorded the names and shares of all owners.39
Prior to this time, the registers recorded the names, but not the ownership shares. The date on which ownership shares began to be recorded varied somewhat from port to port.
In the early 1850s the whaling ground that was regarded as offering a superior combination of risk and return was the North Pacific. The analysis presented above therefore implies that the greater the ownership share in the vessel held by the agent, the greater the likelihood that the vessel would be sent to the North Pacific. In order to test this proposition, a sample of 501 whaling voyages, originating in New Bedford, Fairhaven, and New London from 1850–1855, was collected. This sample contains all voyages for which a register could be found, and represents 64 percent, 68 percent, and 74 percent of all voyages from these three ports, respectively, for the period.40
Some registers issued in 1850 and later did not record ownership shares.
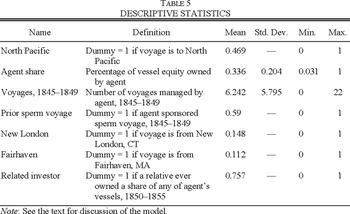
The ownership data obtained from vessel registers were then matched to data on the voyage itineraries, and also to the characteristics of the agents managing the voyages. Because the question of interest is whether the voyage was sent to the North Pacific, the itinerary of the voyage was recorded as a binary variable, equal to one if the voyage was sent to the North Pacific, and zero otherwise. Table 5 provides descriptive statistics for all the variables in the dataset.41
The source for the voyage itineraries, and the agent characteristics, is Starbuck, History. Vessel characteristics were obtained from the ship registers.

The characteristics of the agents, as well as those of the vessels, would probably have influenced the agents' choices of whaling grounds, and should therefore be included as controls in an empirical framework that attempts to explain the destination of the voyages. For example, agents who were wealthier, or more willing to take risks, may have been more likely to send their vessels on the expensive and risky voyages to the North Pacific, compared to, say, the Atlantic Ocean. Therefore, agent characteristics that may proxy for these traits are also included. In addition, some agents may have specialized in obtaining or dealing in sperm whale oil and its related commodities, which would have made the North Pacific less attractive to them, as the North Pacific was known as a region where right whales (and their close relative, the bowhead) could be obtained. Therefore, a binary variable equal to one if an agent ever managed a sperm whaling voyage in the years 1845–1849 is also included.
To account for factors such as changes in product prices, the whalers' knowledge of conditions on the different whaling grounds, the degree of hunting pressure on each ground, and other such factors that changed over the sample period, fixed effects for each voyage departure year are included in each specification. Finally, to control for whatever factors particular to each port may have influenced the choices of the different agents, fixed effects for each port are also included in each specification.
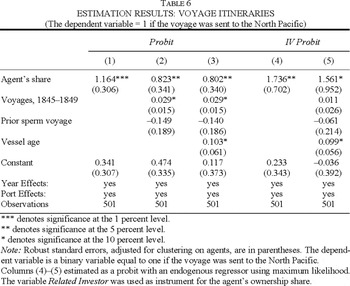
Estimation results are presented in Table 6. Given that the observations in the dataset, individual voyages, were managed by 124 different agents (there is an average of 4.0 voyages per agent), there will likely be correlation among the voyages from the individual agents. Therefore, robust standard errors adjusted for clustering on agents are reported in the table.

In the table, column (1) reports the estimation results for a specification with the agents' shares, controls for the port of origin, and year effects. The estimated result is strongly consistent with the hypothesized positive relationship between the agent's ownership share and the likelihood that the voyage was sent to the North Pacific. The coefficient on the agent's share indicates that, at the mean, an increase in the agent's share equal to one standard deviation of this variable resulted in a 9.4 percent increase in the likelihood that the vessel would be sent to the North Pacific.
Subsequent specifications, reported in columns (2) and (3), include the different agent characteristics and vessel characteristics as covariates. The effect of including these controls is to reduce the magnitude and the precision of the estimated effect of the agent's share, but the effect is robust to the inclusion of these controls. In column (2) the number of voyages the agent sponsored in the five years prior to the sample period, a measure of experience and also, possibly, wealth, is found to increase the likelihood that the agent would send his vessel to the North Pacific. The binary variable for a prior sperm whaling voyage is also included; this has the hypothesized (negative) sign but it imprecisely estimated. Column (3) introduces a vessel characteristic, the age of the vessel.42
Other vessel characteristics, such as its rigging— ship, barkentine, brigantine, etc.—or its tonnage were included as robustness checks (not reported here) and did not change the results.
It should be noted, however, that this specification assumes that the vessel characteristics are determined exogenously. If it were the case that the agents selected particular types of vessels for voyages of different destinations, then this would imply an endogenous relationship between characteristics and voyage itinerary. Nonetheless, the effect of the agent's share is robust to the inclusion of the vessel characteristics.
These results are broadly consistent with the hypothesized relationship between the agents' shareholdings and their choices of whaling grounds. Agents who retained larger ownership shares in their vessels were more likely to send them to the North Pacific. It is reasonable to infer from this result that agents who were less influenced by asset prices in their decisions were less likely to send their vessels to whaling grounds that generated a source of diversification. However, these results do not have a causal interpretation. The agents' shareholdings, after all, were not experimentally assigned, but rather were chosen by the agents themselves. The agents' shareholdings may have been endogenously determined jointly with the vessel itineraries.
In order to attempt to address this issue, a careful analysis of the determinants of the level of the agents' shareholdings is needed. The next section presents such an analysis, and proposes some instruments that could be used as a source of identification.
THE AGENTS' RETAINED SHARES
The agents sold shares in their vessels to outside investors in order to share the risks, and raise capital for their ventures. Each of these objectives suggests reasons that the estimates of the effect of the agents shares presented previously could be biased. Let us begin with the former. Some whaling voyages may have been judged riskier, in which case the agents would have sold greater shares in their vessels in order to optimally allocate this greater level of risk between themselves and their investors.44
The distribution of risks between a principal and an agent in the context of an optimal incentive contract, and how this distribution varies with the level of risks of the enterprise, is discussed in Holmstrom and Milgrom, “Multitask.”
The second motive for selling shares in the vessel, raising capital, also has implications for the relationship between the agents' level of shareholdings and the voyage destination. For example, some agents may have had less of a need for external financing than others, in which case they would have retained greater shares in their vessels. These wealthier agents may also have been more likely to send their vessels to the North Pacific, because they were more tolerant of risks.45
This would be the case, for example, with standard preferences such as constant relative risk aversion (CRRA).
In order to address these issues, an exogenous source of variation in the agents' ownership shares is needed to identify the effect of the agents' shareholdings on the voyage destinations. One such source can be obtained from considering sales of equity in the vessel by the agents to their relatives. In the sample of 501 voyages, the agent sold some share in the vessel to a relative, defined as someone with the same family name, in 211 (42 percent) of the voyages. It may have been the case that these ownership stakes of relatives served some of the same purposes as the ownership stake of the agent himself: it helped to demonstrate to unrelated or outside investors that the agent would perform his role diligently. In this sense, the ownership stakes of relatives could serve as a substitute for the ownership stakes of the agents themselves. Moreover, if an agent had relatives who were willing to purchase stakes in his vessels, then this agent was probably better able to sell equity in his vessels—other agents may have been unable to sell as much of their vessels' equity as they intended because they may have had a more difficult time identifying investors.
There is a danger that the ownership stake of a relative, or even a variable indicating that some relative had a stake, may have been endogenously related to the destination of the voyage, and therefore would not be a valid instrument. However, if we consider a variable that indicates whether an agent ever had a relative purchase a share in any of his vessels, then this is much more likely to capture whether or not the agent had relatives who were willing or able to invest in his voyages. The fact that an agent is related to someone who has been willing to invest in his voyages is much more likely to be exogenous in this context. The logic of using this instrument is that agents who were able to sell shares (at least some of the time) to relatives may have been able to retain lower stakes in their vessels, independently of their wealth or risk tolerance.
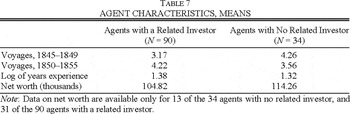
Therefore, a binary variable equal to one if the agent ever had a relative make an investment in any of his vessels during the sample period will also be used as an instrument. The risk of this instrument is that it may be correlated with an agent's wealth—agents with relatives wealthy enough to invest in their voyages may also be wealthier. Alternatively, one might imagine that a very wealthy agent might not need to seek the investments of relatives, whereas a poorer agent might rely more heavily on his family. To address these concerns, we can compare the various observable characteristics of the 90 agents for whom a related investor ever purchased a share to the 34 agents for whom this was not the case. These comparisons are presented in Table 7. As an additional means to evaluate whether this instrument is correlated with wealth, a measure of the agents' net worth, available for 44 of the 124 agents in the sample, is also provided. The measure was compiled by R.G. Dun and Co., and was recorded in the 1850s.46
The entries in the ledger were meant to rate the creditworthiness of the different agents, and often provided a quantitative estimate of the agents' net worth. The entries used in the table were made between 1849 and 1858. The reason the coverage is incomplete is that for many agents, no quantitative estimate is provided; the ledger simply notes “good” or “doing very well.” For other agents, no entries are made until well after the sample period. It may be the case that agents who were not mentioned or given quantitative assessments in the ledgers had smaller businesses, or were less wealthy. This is not a cause for serious concern, however, because an approximately equal fraction of agents in both categories (with and without a related investor) were given no quantitative estimate.

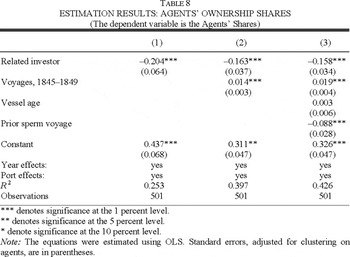
With this instrument, we can identify the coefficient on the agents' ownership shares in a regression of the voyage itineraries on the agents' characteristics. As the dependent variable is binary, an instrumental-variables probit model will be estimated, using maximum likelihood. Before examining the results of these regressions, which are presented in Table 6, we can evaluate the validity of the instrument by examining a first-stage, reduced-form regression of the agents' ownership shares on the instruments and other agent characteristics. The results are presented in Table 8.

In general, the results indicate that the instrument performs its function reasonably well. It enters with the expected sign, and is statistically significant. The results also indicate that the agents' ownership shares were increasing in the number of voyages they managed in 1845-49, likely indicating that experience or wealth also influenced their ownership shares.
The results for the instrumental variables probit estimation of the equation for the probability that a voyage traveled to the North Pacific are presented in columns (4) and (5) of Table 6. Column (4) presents the same specification as column (1), only with the agents' shares treated as endogenous. The estimated coefficient on the agents' shares is larger, indicating that the direction of the bias was likely negative. This is consistent with the notion that the agents reduced their holdings in voyages to the North Pacific to optimally share the greater risks of these ventures with their investors. The estimated effect implies that, at the mean, an increase in the agent's share equal to one standard deviation of this variable increased the likelihood that the vessel would be sent to the North Pacific by 14.2 percent.
In column (5), all of the additional covariates used in other specifications are included as well. In this specification, the precision of the estimated effect of the agent's share is reduced. However, the magnitude of the coefficient remains about the same, and the estimate remains significant at the 10 percent level. These results are at least consistent with the notion that managerial ownership had an influence on the investment decisions of whaling agents. Evidently, in an environment with less significant obstacles to risk sharing, fewer vessels would have been sent to the North Pacific in the 1850s, implying that there would have been greater diversity among the itineraries of whaling voyages. It is likely that the participants in the industry would have faced lower aggregate risks as a result.
DIVERSIFICATION OF THE AGENTS' OWN VOYAGES
One slightly puzzling finding presented above is that agents who had managed a large number of voyages prior to the sample period were slightly more likely to send a voyage to the North Pacific (Table 6.) This could be due to the agents' greater wealth and risk tolerance, but it also seems to suggest that the agents with the greatest incentive to diversify their voyages chose not to do so. When agents managed multiple voyages, did they diversify them?
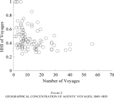
In order to address this question more systematically, a Herfindahl-Hirschman index (HHI) of concentration was constructed for the voyages of each of the 154 whaling agents active in New Bedford, New London, and Fairhaven for the years 1845–1855, using all voyages originating from those ports over the period. The index measures the degree of concentration in each agent's voyages among the four possible choices of oceans listed in surviving records.47
For an agent j with Nj total voyages during the period, the index is defined as

where n1j through n4j are the agent's numbers of voyages to the Atlantic, Pacific, Indian, and North Pacific Oceans. As there are four possible voyage choices, the index takes a value from 0.25 (perfect diversification) to 1. The index is constructed for 154 agents who managed a total of 1,271 voyages.
Figure 2 plots the values of the HHI index against the number of voyages sponsored by each agent. The relationship between the concentration and scale of the agents' activities is clearly decreasing: the larger the number of voyages sponsored by an agent, the more diversified his voyages were.48
A regression of the agents' voyage HHIs on their voyage totals, along with port fixed effects, where the unit of observation is the agents, produces a coefficient on the voyage total of –0.013, with a standard error of (0.002). The difference between this result and that of Table 6 is that there the measure of total voyages employed is from the period prior to the sample, and thus does not measure the scale of the agents' current operations.

FIGURE 2 GEOGRAPHICAL CONCENTRATION OF AGENTS' VOYAGES, 1845–1855
The data in Table 2 suggest that a different distribution of ownership—one with fewer agents, each with much larger operations—might have produced a different, more diversified pattern of investments, and might have come closer to replicating the allocation that would have obtained in a market with greater risk sharing.
CONCLUSION
In response to a high degree of moral hazard problems and transactions costs, whaling enterprises were configured as closely held organizations, whose main investor was also its manager. This arrangement proved highly durable and succeeded in facilitating enormous investments in the industry. But the resulting allocation of ownership shares forced the industry's entrepreneurs to bear much of the risks of their own voyages. As a result, their risk-taking behavior changed, and in particular diversity in whaling voyages was reduced. A high degree of aggregate risk within the industry was the result. As one early historian of the industry concluded, “fluctuations in the business were constant, and with many ports the tide of success seemed to ebb and flow with quite as measured a rhythm as the alternating rise and fall of old ocean.”49
Starbuck, History, p. 99.
The investment opportunities of whaling entrepreneurs entailed a choice between voyages that offered the best combination of risk and return, and alternative voyages that offered inferior risk-return profiles, but whose returns would be imperfectly correlated with those of the others. The limited extent of equity sales in vessels, a likely result of moral hazard concerns, constrained the ability of market forces to compensate an entrepreneur for choosing the latter. Only the merchants with very large-scale operations fully internalized the externality associated with generating sources of diversification.
Many aspects of the whaling industry are unusual, or even totally unique, in the history of the American economy. The industry's response to moral hazard problems, however, was not. It is likely that the consequences described in this article were felt in other industries as well.
I would like to thank Charles Calomiris, Alessandra Casella, Alan Dye, Kyle Kauffman, Michael Riordan, Paul Sengmüller, and various seminar participants for helpful discussions. The insightful comments of two anonymous referees and the editor (Jeremy Atack) improved the article substantially.