Introduction
The Bransfield Strait lies between the South Shetland Islands and the north-western part of the Antarctic Peninsula (Fig. 1). In the north-east it is bounded by the South Scotia Ridge, a transform boundary (Galindo-Zaldívar et al. Reference Galindo-Zaldívar, Jabaloy, Maldonado and De Galdeano1996) that connects the South Sandwich Arc with the Shackleton Fracture Zone and forms the southern boundary of the Scotia Plate (Pelayo & Wiens Reference Pelayo and Wiens1989, Barker et al. Reference Barker, Dalziel, Storey and Tingey1991). North-west of the South Shetland Islands is the South Shetland Trench that developed by south-eastward subduction of the Phoenix Plate, which is now considered by many to be extinct and overthrust by the Antarctic Plate from the south-east (Barker & Dalziel Reference Barker, Dalziel and Cabré1983, Larter & Barker Reference Larter and Barker1991, Maldonado et al. Reference Maldonado, Aldaya, Balanya, Galindo-Zaldívar, Jabaloy, Larter, Rodríguez-Fernández, Rossanov and Sanz de Galdeano1994).
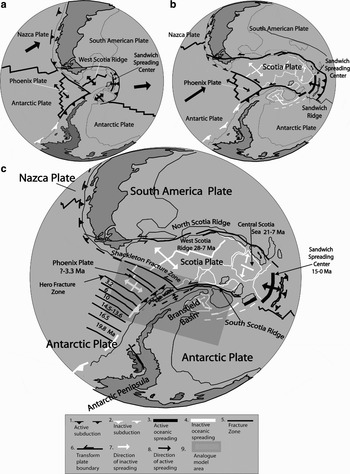
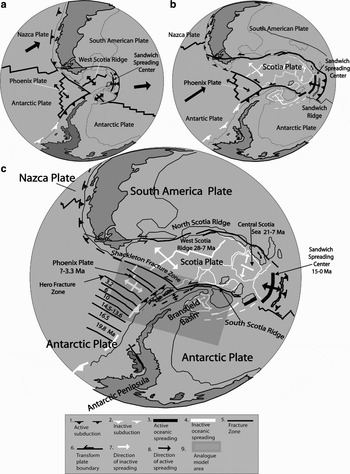
Evolution of major tectonic features within and around the Scotia Plate. a. Tectonic plate configuration at 15 Ma, b. Tectonic plate configuration at 6 Ma (after Anderson Reference Anderson1999, Barker Reference Barker2001). c. Present tectonic setting shows the age of the collision between the Phoenix Ridge and Antarctic Trench, and the beginning and cessation of spreading centre activities. The shadowed rectangle shows the experimental area.
The Bransfield Basin is preserved as a remnant of the past subduction process, and is generally considered to represent a back-arc rift (Barker Reference Barker1982, Larter & Barker Reference Larter and Barker1991, Barker & Austin Reference Barker and Austin1998). However, the exact nature of the basin has been a matter of debate. Although some neo-volcanic edifices within the basin are composed of enriched mid-ocean ridge basalt, which suggests nascent seafloor spreading (Gambôa & Maldonado Reference Gambôa, Maldonado and St. John1990, Keller et al. Reference Keller, Fisk and White1991, Reference Keller, Fisk, White and Birkenmajer1992, Acosta et al. Reference Acosta, Herranz, Sanz, Uchupi, Poag and de Graciansky1992, Keller & Fisk Reference Keller, Fisk, Parson, Murton and Browning1992), this might also be attributed to arc crustal extension without actual seafloor spreading (Barker & Austin Reference Barker and Austin1998, Barker et al. Reference Barker, Christeson, Austin and Dalziel2003). Geochemical data, in fact, seem to indicate a bimodal composition, with a transition from mid-ocean ridge basalt-like to arc-like volcanic rocks and a relatively small contribution by subducted material (Petersen et al. Reference Petersen, Herzig, Schwarz-Schampera, Hannington and Jonasson2004). Normal faulting of the arc crust also suggests that the Bransfield Strait is in transition from intra-arc rifting to oceanic spreading (Barker & Austin Reference Barker and Austin1994, Lawver et al. Reference Lawver, Keller, Fisk, Strelin and Taylor1995, Prieto et al. Reference Prieto, Canals, Ercilla and De Batist1998, Taylor et al. Reference Taylor, Goodliffe and Martínez1999, Barker et al. Reference Barker, Christeson, Austin and Dalziel2003). Pelayo & Wiens (Reference Pelayo and Wiens1989) also noted that large normal fault events in the Bransfield Basin and along the South Scotia Ridge have greater depths and seismic moments than earthquakes associated with mid-ocean ridge spreading, indicating that the mechanical process of extension in these areas is notably different.
Whereas many authors believe that the opening of the Bransfield Basin results predominantly from roll-back of the South Shetland Trench (Barker Reference Barker1982, Larter & Barker Reference Larter and Barker1991, Barker & Austin Reference Barker and Austin1998, Anderson Reference Anderson1999, Barker et al. Reference Barker, Christeson, Austin and Dalziel2003), González-Casado et al. (Reference González-Casado, López-Martínez, Giner-Robles, Duran and Gumiel1999, Reference González-Casado, Giner-Robles and López-Martínez2000) related the basin opening to a sinistral simple-shear couple between the Scotia and Antarctic plates. They argued that the widening of the Bransfield Basin and insufficient trench roll-back cause compression in the South Shetland Islands. Regional strain analysis by the latter authors indicated that the main structures have a mean NE–SW strike, with a subordinate NW–SE direction and σ3 having a NE–SW orientation. The analysis of faults on Deception Island (Rey et al. Reference Rey, Somoza and Martínez-Frías1995, Fernández-Ibáñez et al. Reference Fernández-Ibáñez, Pérz-López, Martínez-Díaz, Paredes, Giner-Robles, Caselli and Ibáñez2005), on the other hand, indicates three main orientations: 015°, 080°, and 155°. Apparently, most of these are steeply dipping normal faults with some horizontal and occasional reverse displacements, but the nature of the volcanic deposits and the absence of kinematic indicators make it difficult to identify the sense of displacement in most cases. Geomorphologic evidence, in the form of uplifted marine terraces and incised drainage, suggests tilt movement on some faults (Fernández-Ibáñez et al. Reference Fernández-Ibáñez, Pérz-López, Martínez-Díaz, Paredes, Giner-Robles, Caselli and Ibáñez2005).
The Phoenix Ridge has been inactive since 3.3 ± 0.2 Ma (Livermore et al. Reference Livermore, Balanya, Maldonado, Martínez, Rodríguez-Fernández, Sanz de Galdeano, Galindo, Jabaloy, Barnolas, Somoza, Hernández-Molina, Suriñach and Viseras2000), so that most authors have incorporated the Phoenix Plate into the Antarctic Plate (Galindo-Zaldívar et al. Reference Galindo-Zaldívar, Jabaloy, Maldonado and De Galdeano1996, González-Casado et al. Reference González-Casado, Giner-Robles and López-Martínez2000, Barker et al. Reference Barker, Christeson, Austin and Dalziel2003, Fernández-Ibáñez et al. Reference Fernández-Ibáñez, Pérz-López, Martínez-Díaz, Paredes, Giner-Robles, Caselli and Ibáñez2005). However, shallow normal faulting in the Bransfield Basin (Prieto et al. Reference Prieto, Canals, Ercilla and De Batist1998, Barker & Austin Reference Barker and Austin1998), deformation of the trench sediments (Maldonado et al. Reference Maldonado, Aldaya, Balanya, Galindo-Zaldívar, Jabaloy, Larter, Rodríguez-Fernández, Rossanov and Sanz de Galdeano1994), and earthquakes as deep as 55 km localized near the south-western end of the Bransfield Basin (Pelayo & Wiens Reference Pelayo and Wiens1989) suggest that tectonic activity and possibly subduction could be continuing along the South Shetland Trench.
Considering the ambiguous field and petrographic evidence, as also reflected in the contradicting viewpoints outlined above, it is still not clear which processes are responsible for the opening of the Bransfield Basin, and to which extent this opening is influenced by the dynamics of the Phoenix and Scotia plates. In particular, it needs to be established whether active subduction is indeed continuing along the South Shetland Trench or whether the only active process since 3.2 Ma is one of trench roll-back due to thermal/gravitational sagging of the formerly subducting slab. It is also unclear whether the observed fault systems in the Bransfied Basin are related to extension because of back-arc or mid-ocean spreading, or to transtension along the South Scotia Ridge. Therefore, in an endeavour to understand the dynamic evolution of the Bransfield Basin since the Pliocene, we analysed the geomorphological and structural characteristics of the Bransfield Basin using analogue experimental models of the tectonic interaction between the Antarctic, Scotia, and Phoenix plates.
Tectonic events associated with the opening of the Bransfield Basin
During the Cenozoic, the Pacific margin of the Antarctic Peninsula was affected by a series of progressive collisions between the South Shetland Trench and segments of the Phoenix Ridge. This caused tectonic uplift of the arc and fore-arc (Barker Reference Barker1982, Jeffers et al. Reference Jeffers, Anderson, Lawver, Thomson, Crame and Thomson1991, Maldonado et al. Reference Maldonado, Aldaya, Balanya, Galindo-Zaldívar, Jabaloy, Larter, Rodríguez-Fernández, Rossanov and Sanz de Galdeano1994, Anderson Reference Anderson1999) (Fig. 1). Six unconformities in the sedimentary cover of the ocean floor represent the time when subduction ceased in the different oceanic segments (Herron & Tucholke Reference Herron, Tucholke, Hollister and Craddock1976, Barker Reference Barker1982). They were dated at 19.8, 16.5, 14.5, 10, 6.0, and 5.5–3.1 Ma, respectively.
The sequence of tectonic events associated with the opening and development of the Bransfield Basin can be summarized as follows:
1) Spreading of the West Scotia Ridge starting at 28 Ma (Fig. 1a) and finishing at 7 Ma (Fig. 1b) (Barker Reference Barker2001),
2) Possible opening of the Bransfield Basin at a rate of 1.1 mm yr-1 during the Oligocene–Miocene (Sell et al. Reference Sell, Poupeau, González-Casado and López-Martínez2004),
3) Activity of the Sandwich Spreading Center (Fig. 1b) from 15 Ma to the present (Vanneste et al. Reference Vanneste, Larter and Smythe2002),
4) Tectonic inversion in the Shackleton Fracture Zone at 7 Ma (Fig. 1), following the demise of the West Scotia Ridge (Livermore et al. Reference Livermore, Balanya, Maldonado, Martínez, Rodríguez-Fernández, Sanz de Galdeano, Galindo, Jabaloy, Barnolas, Somoza, Hernández-Molina, Suriñach and Viseras2000),
5) Simultaneous spreading extinction of the three remnant segments of the Phoenix Ridge (Fig. 1c), closely associated with the last ridge-trench collision of the Hero Fracture Zone (Fig. 1c) at c. 3.2–3.3 Ma (Anderson Reference Anderson1999, Livermore et al. Reference Livermore, Balanya, Maldonado, Martínez, Rodríguez-Fernández, Sanz de Galdeano, Galindo, Jabaloy, Barnolas, Somoza, Hernández-Molina, Suriñach and Viseras2000),
6) Extension of the Bransfield Basin for the past 2 Ma at an average full-rate of 2.5–7.5 mm yr-1 (González-Ferrán Reference González-Ferrán, Thomson, Crame and Thomson1991),
7) Formation of the axial volcanoes of the central Bransfield Basin 0.71 m.y.a. according to magnetic anomalies (Hardland et al. Reference Hardland, Armstrong, Cox, Craig, Smith and Smith1990, Canals et al. Reference Canals, Gràcia, Prieto, Parson and Ricci1997) and a minimum full spreading rate of 0.83 mm yr-1 (Canals et al. Reference Canals, Gràcia, Prieto, Parson and Ricci1997).
Bathymetry, volcanism, and structural features of the Bransfield Basin
The following overview was compiled from observations by different authors and the information is summarized in a geomorphologic structural map (Fig. 2).
Bathymetry, tectonic and volcanic map of the Bransfield Basin. a. Fault systems are plotted with different line types to differentiate between the relative ages. b. Volcanic stages distinguished by different textures relative to age (after Birkenmajer Reference Birkenmajer1982, Santanach et al. Reference Santanach, Pallàs, Sàbat, Muñoz and López-Martínez1992, Gràcia et al. Reference Gràcia, Canals, Farràn, Prieto, Sorribas and Gebra1996, Canals et al. Reference Canals, Gràcia, Prieto, Parson and Ricci1997, Prieto et al. Reference Prieto, Canals, Ercilla and De Batist1998, Anderson Reference Anderson1999).

The orientation of the longitudinal axis of the Bransfield Basin is approximately 060°. It is divided by volcanic complexes, forming the Deception and Bridgeman islands, into the western, central and eastern sub-basins (Gràcia et al. Reference Gràcia, Canals, Farràn, Prieto, Sorribas and Gebra1996, Lawver et al. Reference Lawver, Sloan, Barker, Ghidella, Von Herzen, Keller, Klinkhammer and Chin1996, Anderson Reference Anderson1999).
The western sub-basin is located between Boyd Strait and Deception Island (Fig. 2) and comprises the shallower part of the Bransfield Basin, reaching maximum depths of 1250 m. Volcanism is not observed in this sub-basin (Anderson Reference Anderson1999).
The central sub-basin is asymmetric with a steep northern slope and a gentle southern slope. On the shelf, large glacial troughs with mega-glacial lineaments resulting from ice flow movement and erosion during the last glacial episode (Wellner et al. Reference Wellner, Lowe, Shipp and Anderson2001, Canals et al. Reference Canals, Casamor, Urgeles, Calafat, Domack, Baraza, Farrán and De Batist2002) are present (Fig. 2). Four oceanic steps (1, 2, 3 and 4 in Fig. 2), spaced between 40 and 50 km apart and with depths that vary from west to east between 750 and 1950 m, segment the basin floor (Anderson Reference Anderson1999).
A line of conical and linear volcanic edifices labelled A–F, extend parallel to the basin axis, which trends at 060° (Gràcia et al. Reference Gràcia, Canals, Farràn, Prieto, Sorribas and Gebra1996). The latter authors distinguished three phases of volcanism. During the first phase a submarine volcanic edifice (D) began to form, followed by a conical submarine volcano (A). In the second phase, the previously formed conical volcano (D) was ruptured and separated by a linear volcanic edifice. Additional submarine volcanic edifices (B, C, F, and E) developed during the third phase, while continued extension in the volcano D area formed a thin belt of possible oceanic crust.
The central sub-basin is dominated by a main north-east and secondary north-west system of normal faults. The NE-trending faults define three graben systems parallel to the basin axis (Fig. 2). The orientation of these grabens and their associated deposits induced Prieto et al. (Reference Prieto, Canals, Ercilla and De Batist1998) to propose migration of the extensional grabens and associated depocentres from the Antarctic Peninsula margin to the South Shetland Island margin along three spatially and temporally differentiated trends, the first having an orientation of 071° (the graben system nearest to the Antarctic Peninsula), followed by 064° (the intermediate system), and finally 053° (the system nearest to the South Shetland Islands). The NW-trending secondary fault system is responsible for the morphological steps that deepen the basin from south-west to north-east (Prieto et al. Reference Prieto, Canals, Ercilla and De Batist1998). On the King George and Livingston Islands of the central sub-basin, 065°-trending dextral strike-slip faults (Fig. 2) were formed by oblique convergence between the Phoenix and Antarctic plates (Birkenmajer Reference Birkenmajer1982, Santanach et al. Reference Santanach, Pallàs, Sàbat, Muñoz and López-Martínez1992) during the Late Cretaceous–Pliocene. The north-west strike-slip faults on King George and Livingston islands, spaced between 5 and 15 km apart, reflect a transition from compressional to extensional regimes produced by the cessation of spreading of the Phoenix Plate (Birkenmajer Reference Birkenmajer1982, Santanach et al. Reference Santanach, Pallàs, Sàbat, Muñoz and López-Martínez1992).
The eastern sub-basin lies between Bridgeman Island and the South Scotia Ridge (Figs. 1 & 2). This basin reaches a maximum depth of almost 2300 m. The northern slope of the basin is steep, between 9° and 20°, whereas its southern slope is gentler (between 5° and 13°) and irregular. The floor of the basin has an approximate width of 25 km and shows two oceanic steps divided by submarine volcano H (Fig. 2), which displays a complex geomorphology. This sub-basin is also characterized by four deep troughs displaying a rhombic shape, interpreted by Gràcia et al. (Reference Gràcia, Canals, Farràn, Prieto, Sorribas and Gebra1996, Reference Gràcia, Canals, Farràn, Sorribas and Pallas1997) to reflect NW–SE extension with a left-lateral strike-slip component probably related to the South Scotia Ridge.
Analogue experimental models
A series of experiments was carried out in order to understand how the regional dynamic evolution of the plates described above may have contributed to the development and opening of the Bransfield Basin. The aim of the experiments was to examine the causes of the deformation observed in the Bransfield Basin and in particular, the effect of the Scotia Plate motion on deformation in the Bransfield Basin area.
Rheological, spatial and temporal analogies
The modelled area is a rectangle of approximately 1200 km by 600 km, corresponding to oceanic (ex-Phoenix Plate and part of the oceanic Antarctic Plate) and continental lithospheres (continental Antarctic Plate and associated shelves) (see Fig. 1). Analogue modelling was carried out within a rigid Plexiglas tank. The long side of the tank was parallel to the relative motion of the Scotia Plate with respect to the Antarctic Peninsula, i.e. approximately E–W.
The following assumptions were made to design the analogue models:
1) The mechanical behaviour of the continental and oceanic lithosphere is that of a brittle upper layer lying above a high-viscosity ductile layer. These layers are modelled using sand and silicon, respectively. Sand is a brittle material with a negligible cohesion and a 30° internal friction angle, which is suitable for reproducing at scale the mechanical properties of the brittle lithosphere (e.g. Davy & Cobbold Reference Davy and Cobbold1991). Silicon putty is a Newtonian material with a high viscosity, close to 1 × 10⁵ Pa s. The analogues of the continental and oceanic lithospheres have different thicknesses, densities and viscosities (see Table I for a complete description of the physical parameters of the analogue experiments).
2) The asthenosphere is assumed to behave as a low-viscosity, ductile Newtonian fluid. It was modelled using honey, the viscosity of which is small compared to that of silicon.
3) Present-day deformation along the western part of the Scotia Plate is minor, so that we modelled the Scotia Plate boundary as a rigid boundary, using a metal triangle that transmits stresses without being deformed. This rigid boundary was pushed at constant speed using a motor-driven piston, in order to reproduce the relative motion of the Scotia Plate with respect to Antarctica.
To model the deformation of 80 km thick lithospheric plates, the length scale factor is 5 × 10⁻⁷, whereas the density scale factor is close to 0.4. From the simple scaling relations in Table I, we derived that 20 min in the experiments correspond to 1.5 m.y. in nature. The piston velocity was set to represent the relative motion of the Scotia Plate with respect to Antarctica (1.4 cm yr-1, Pelayo & Wiens Reference Pelayo and Wiens1989). Davy & Cobbold (Reference Davy and Cobbold1991) and Martinod et al. (Reference Martinod, Hatzfeld, Brun, Davy and Gautier2000) provide more details concerning scaling in this kind of experiment.
Physical properties of the experimental material.

We also wanted to study how possible roll-back of the South Shetland Trench resulting from density contrasts between the continental lithosphere of the Antarctic Peninsula and the former Phoenix Plate section of the Antarctic Plate, could control the formation of the Bransfield Basin. To do so, we tested the effect of gravity spreading above the trench on the tectonics of the Antarctic Plate.
For convenience, we shall refer hereafter to regions of the experiment in terms of geographic locations, the northern boundary corresponding to the moving rigid plate.
Model 1
Experiment 1 modelled the tectonic regime that developed in the study area resulting from the westward motion of the Scotia Plate. A continental (Antarctic Peninsula and associated shelves) and an oceanic (Antarctic Plate) zone were differentiated in the analogue model, in which the continental plate was more buoyant than the oceanic plate. The boundary between these zones had the same orientation as the Shetland subduction zone (Fig. 3). During the analogue experiment, the piston pushed a rigid structure modelling the Scotia Plate at constant speed (4.5 cm hr-1). This rigid plate motion resulted in the superficial deformation of the sand/silicon layers. A square grid of passive sand markers enabled the visualization of surface deformation, which was surveyed using a digital camera.
Experimental assembly illustrating the differentiation between a continental and oceanic zone used in experiment 1. The width and length of the analogue area are 30 cm and 60 cm, respectively. The conical arrow shows the direction of piston movement.

Different stages of the experiment are shown in Fig. 4. Deformation concentrated near the triangle and propagated from north to south. The oceanic zone (western part of the model) was affected by transpressional deformation where folds and oblique sinistral thrust-slip faults appeared. The faults and fold axes trended between 320° and 330° (Fig. 4), corresponding to the axis of maximum extension (X). The angle between the maximum stretch axes and the eastern side of the triangle was almost perpendicular, implying a high deformation partition (Teyssier et al. Reference Teyssier, Tikoff and Markley1995).
Photographic sequence at a. 0, b. 90, and c. 225 min of experiment 1. d. Structural interpretation sketch at 225 min. This figure represents the shadowed rectangle of Fig. 1 and the box represents the Bransfield study area shown in Fig. 2. The grey line shows the limit between the continental and oceanic zones. Strain ellipsoids indicate maximum and minimum strain axes.

The continental zone was affected by a transtensional regime, where a set of 078°–088°-oriented oblique sinistral normal faults (Fig. 4) developed. Near the triangle, sinistral strike-slip faults were cut by a secondary system of 058°–063°-oriented strike-slip faults (Fig. 4). Grabens and horsts developed in the southern zone affected by transtensional deformation.
Model 2
This experiment was done with a different geometry of sand/silicon plates to take into account the presence of the Phoenix Plate. As explained above, the Phoenix Plate subducted below the Antarctic Peninsula during the Miocene and Pliocene. The boundary between the Phoenix Plate and the Antarctic continent thus corresponds to a weak zone, despite the fact that the subduction velocity drastically decreased following the extinction of the Phoenix Ridge 3.3 ± 0.2 Ma ago. Therefore, the limit between the Antarctic and Phoenix plates was considered to be a free boundary, so that the Antarctic continent could spread freely above the Phoenix oceanic plate. This approach has been used successfully to model the deformation of continental plates spreading above subduction zones, for instance in the Aegean Sea (Hatzfeld et al. Reference Hatzfeld, Martinod, Bastet and Gautier1997, Gautier et al. Reference Gautier, Brun, Moriceau, Soukoutis, Martinod and Jolivet1999, Martinod et al. Reference Martinod, Hatzfeld, Brun, Davy and Gautier2000). However, it must be stressed that this analogue model was limited in simulating roll-back in a passive rather than active way, i.e. there was no actual sinking of the oceanic crust relative to the continental crust. The experiment only reproduced buoyancy differences between the two types of crust, allowing the upper, less dense crust to extend over the lower, dense crust as if the latter were actively sinking.
Here, the sand-silicon layer modelled the Antarctic continental plate. To simulate the free boundary between the Antarctic and Phoenix plates, we removed the silicon-sand layer in a representative model area of the Phoenix Plate (Fig. 5). During the analogue experiment, the piston representing the Scotia Plate advanced at 4.5 cm hr-1 as in the previous experiment. As soon as the experiment started, fractures developed in the Bransfield area with an approximate 065° orientation (Fig. 6a). These fractures partly resulted from extension of the sand-silicon plate during spreading of the light material that modelled the continental lithosphere above the dense honey (Hatzfeld et al. Reference Hatzfeld, Martinod, Bastet and Gautier1997), and partly from the transtension produced by the migrating Scotia Plate. The direction of the extension was approximately perpendicular to the free continental boundary, which migrated towards the north-west. The oceanic free boundaries did not extend significantly because the buoyancy of the sand-silicon layer modelling the ocean was close to zero.
Experimental assembly illustrating the differentiation between a continental and oceanic zone used in experiment 2.

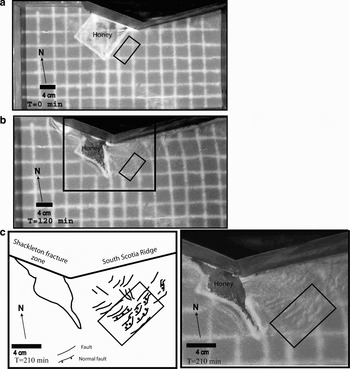
Photographic sequence of experiment 2 at a. 0, and b. 80 minutes, respectively. c. Photograph and structural interpretation sketch at 140 min of the enlarged area shown in Fig. 6b. This figure represents the shadowed rectangle of Fig. 1 and the box represents the Bransfield study area shown in Fig. 2.

In the Bransfield area, a system of 065°-trending normal faults with a sinistral component of movement developed. They were segmented by a 005°–010°-striking secondary system of faults. It is interesting to note that in the Bransfield area (Fig. 6c), the main and secondary system of faults formed a discontinuous rift. After 20 min (equal to 0.67 m.y.) the main system of faults was clearly developing and after 80 min the entire main fault had been formed (Fig. 6b). The secondary system started as fractures at 40 min and developed into a clear normal fault before 80 min, equal to 2.7 m.y. Between 80 and 140 min the number of secondary faults and the extension of the main sinistral normal fault increased (Fig. 6c). The direction of extension at 0 min was 325° and rotated to 316° after 140 min, equal to 4.7 m.y.
Model 3
In this analogue experiment, the sand-silicon layer was homogeneous with a density similar to that of the honey (Table I). It was used to model both the oceanic and continental Antarctica lithosphere. The buoyancy of the plate being close to zero, the spreading force occurring close to the free boundary modelling the Antarctica–Phoenix plates boundary was small. In this way, the magnitude of the extension produced by lithosphere-asthenosphere density contrasts in the free borders was reduced. Extension in the central zone of this experiment mainly resulted from the constant speed motion of the rigid triangle that modelled the Scotia Plate (Fig. 7).
Assembly showing the layer configurations.

After 120 min, equal to 4 m.y., the developed structures were still very few (Fig. 8b). In the Bransfield area a diffuse extensional zone was characterized by 060°–070°-trending fractures.

After 210 min, equal to 7 m.y., extension increased in the Bransfield zone and in the southern part of the diffuse extensional zone a discontinuous system of normal faults trending 060°–070°, developed (Fig. 8c). The development of faults in experiment 3 was less extensive and slower than in experiment 2, whereas the secondary system of faults observed in experiment 2 did not reappear in experiment 3.
Discussion
Experiment 1 did not reproduce all the structural features observed in the Bransfield Basin, but showed the development of transpressional and transtensional regimes close to the Shackleton Fracture Zone and South Scotia Ridge, respectively. The transtension observed in the Bransfield area (main NE–SW fault system, Fig. 4d) had a different orientation and extension was restricted to the eastern part of the Bransfield area (Fig. 4d), despite the fact that the density contrast between the oceanic and continental plate should have favoured extension on the continent, close to the continent-ocean boundary. Stresses arising from the buoyancy contrast between the continental and oceanic plate were not large enough to trigger extension of the continental plate in the Bransfield area.
The fact that experiment 1 did not exactly reproduce the structural setting of the Bransfield Basin is probably because it did not take into account the weak zone corresponding to the boundary between the Phoenix Plate and the Antarctic continent. Nevertheless, this experiment suggests that oblique continental rifting could have developed in the Bransfield area after 7 Ma due to the development of a transtensional regime, which concurs with field evidence. Pelayo & Wiens (Reference Pelayo and Wiens1989) and Giner-Robles et al. (Reference Giner-Robles, González-Casado, Gumiel, Martín-Velázquez and García-Cuevas2003) concluded from seismic studies that left-lateral slip with a component of extension occurs along the South Scotia Ridge, which is supported by deformational structures in the eastern Bransfield sub-basin (Gràcia et al. Reference Gràcia, Canals, Farràn, Prieto, Sorribas and Gebra1996, Klepeis & Lawver Reference Klepeis and Lawver1996).
Transpression west of the southernmost sector of the Shackleton Fracture Zone, as shown by experiment 1, is also supported by field evidence (Pelayo & Wiens Reference Pelayo and Wiens1989). Multichannel seismic and long-range side scan sonar studies along the South Shetland Trench indicate the presence of an accretionary prism with a complex internal structure, the toe of which is overthrust above the youngest trench deposits. The thrust-bounded wedges are laterally and vertically segmented by normal faults (Maldonado et al. Reference Maldonado, Aldaya, Balanya, Galindo-Zaldívar, Jabaloy, Larter, Rodríguez-Fernández, Rossanov and Sanz de Galdeano1994), suggesting that transpression may alternate with extension caused by roll-back of the oceanic crust.
In the case of experiment 3, the secondary N–S system of faults did not develop in the Bransfield area and an almost diffuse extension resulted. The absence of this secondary system of faults is attributed to the continental buoyancy of the plate having been close to zero and because the spreading force occurring close to the free boundary modelling the Antarctica–Phoenix plate boundary was small. However, the fact that a 060°–070° system of faults did develop as a result of the rigid triangle modelling the Scotia Plate, even in the absence of oceanic floor, indicates that transtension along the South Scotia Ridge was the dominant force in the development of this system.
Of the three models, experiment 2 bears the best resemblance to the structures actually occurring in the field. The main system of faults had an orientation of 065° that agrees with the ENE–WSW main fault system in the central and eastern Bransfield sub-basins. In particular, this strike is the same as that observed on King George and Livingston islands associated with the Ezcurra Phase (Birkenmajer Reference Birkenmajer1982, Santanach et al. Reference Santanach, Pallàs, Sàbat, Muñoz and López-Martínez1992), although the horizontal displacement produced by the experiments was sinistral, not dextral as reported by these authors. However, seismicity studies by Galindo-Zaldívar et al. (Reference Galindo-Zaldívar, Jabaloy, Maldonado and De Galdeano1996) indicate that the stress distribution in the Bransfield Strait is similar to that in the axial depression of the South Scotia Ridge, where an ENE–WSW fault system displays an active sinistral transtensional regime with transpressional sectors.
Of particular interest is that the 065° fracture set that initially developed in the experiments partially resulted from extension of the sand-silicon layer that modelled the buoyant continental lithosphere above the oceanic lithosphere. The direction of extension perpendicular to the free continental boundary and migration of the latter to the north-west closely resembles the situation in the Bransfield Basin. However, in the experiment only passive roll-back of ocean crust was simulated, which suggests that its effect was relatively minor and that the extension of the Bransfield Strait is related mainly to the west–north-westward migration of the Scotia Plate as suggested by González-Casado et al. (Reference González-Casado, Giner-Robles and López-Martínez2000). In contrast with the latter authors, however, who consider the Phoenix Plate to be presently incorporated into the Antarctic Plate, experiment 3 indicates that the Phoenix Plate still exists as such and has a free boundary with the Antarctic continent. We contend that expansion of the buoyant continental crust is caused mainly by shearing and transtension along the South Scotia Ridge, but is facilitated by continued, albeit slow, roll-back of the Phoenix Plate. Barker et al. (Reference Barker, Christeson, Austin and Dalziel2003) observed that the crustal thickness in the central sub-basin increases from north-east to south-west, which suggests that the Bransfield Basin is opening by north-east to south-west rift propagation within arc crust of the Antarctic Peninsula. Older (c. 21 Ma) and thus denser oceanic crust to the north-east, compared with younger (c. 12 Ma) crust to the south-west (Larter & Barker Reference Larter and Barker1991) would cause a somewhat higher rate of sinking in the north-east, in the process creating space for expansion of the continental crust caused by transtension along the South Scotia Ridge.
Barker et al. (Reference Barker, Christeson, Austin and Dalziel2003) note that extension of the Bransfield Strait is focussed towards the trench side as shown by the asymmetric physiography of the basin floor, with a steep back-arc slope and gentler continental margin slope. They attribute this to subduction-related magmatism weakening the arc–back-arc crust along the trench side. However, this asymmetry could also be a result of purely sedimentary processes, with glacially derived sediments primarily being accumulated along the southern margin of the Bransfield Basin and much less along the northern margin, because the South Shetland Islands represent a much more reduced drainage basin. This is evident from the seismic and bathymetric studies of Prieto et al. (Reference Prieto, Canals, Ercilla and De Batist1998) and Canals et al. (Reference Canals, Casamor, Urgeles, Calafat, Domack, Baraza, Farrán and De Batist2002). Based on our experimental results, we consider active subduction not to be taking place along the South Scotia Trench at present, but rather favour a process of passive subduction. In active subduction, the ocean floor expands horizontally and sinks beneath a stagnant continental plate, whereas passive subduction in our terminology refers to the situation where there is no active expansion of the oceanic crust but only roll-back, coupled with active extension of the continental crust above it due to transtension and pronounced density differences.
The secondary 005°–010° normal fault system that developed in experiment 3, forming a discontinuous rift with the main fault system, is also duplicated in the Bransfield Basin (Fig. 2). Individual NS-striking faults with downfaulting to the east are not uncommon, as for example associated with Costa Recta on Deception Island (Fernández-Ibáñez et al. Reference Fernández-Ibáñez, Pérz-López, Martínez-Díaz, Paredes, Giner-Robles, Caselli and Ibáñez2005). Such faulting may also be manifested in the deepening of the whole Bransfield Basin towards the north-east. The N–S fault system may be partly attributed to the buoyancy of the continental crust in comparison with the oceanic crust, as modelled in experiment 2. Galindo-Zaldívar et al. (Reference Galindo-Zaldívar, Jabaloy, Maldonado and De Galdeano1996) noted that isostatic balance causes significant differences at the boundaries between oceanic and continental crust, with the development of scarps that highlight fault locations. There is ample evidence of tectonic uplift and prominent normal fault scarps in the Bransfield Strait. On Deception Island, Fernández-Ibáñez et al. (Reference Fernández-Ibáñez, Pérz-López, Martínez-Díaz, Paredes, Giner-Robles, Caselli and Ibáñez2005) described uplifted marine terraces and incised fluvial drainage associated with normal NNW–SSE striking faults, which may be due to continental/oceanic plate buoyancy differences. Muñoz-Martín et al. (Reference Muñoz-Martín, Catalán, Martín-Dávila and Carbó2005) in fact identified continental and basic crust north and south of Deception Island, respectively, indicating a high density contrast in this area. Smith Island, on the other hand, may have resulted from uplift that followed a ridge crest-trench collision directly south-west of the Hero Fracture Zone at 5.5 Ma (Maldonado et al. Reference Maldonado, Aldaya, Balanya, Galindo-Zaldívar, Jabaloy, Larter, Rodríguez-Fernández, Rossanov and Sanz de Galdeano1994) or, alternatively, from the subduction of a seamount, as this area is just landward of a seamount chain.
In conclusion, the analogue models of all three experiments suggest that opening of the Bransfield Basin is related to a combination of transtensional stress associated with the north-westward migration of the Scotia Plate, and slow roll-back of the Phoenix Plate, but dominated by the former process. Subduction is here seen as passive instead of active, i.e. induced by sinking of the oceanic plate without spreading at the Phoenix Ridge, which allows the continental crust of the Antarctic Peninsula to expand towards the north-west, creating the Bransfield Basin in the process.
Acknowledgements
We are grateful to Drs John Anderson and Julia Wellner of Rice University, who actively encouraged the present study. The Chilean Ministry of Foreign Affairs and the Chilean Antarctic Institute (INACH) enabled the participation of one of us (MSO) as observer in the RVIB Nathaniel B. Palmer cruise (NBP0203) financed by the National Science Foundation (NSF). The Research Institute for Development of France (IRD) and the Geology Department of the University of Chile allowed the use of their laboratory facilities. Financial support by the Bicentennial Program of Science and Technology, backed by the National Research Corporation of Chile (CONICYT) and the World Bank, as well as INACH, of the project “Geological Connections Between Patagonia and Antarctica” (ARTG04) enabled the successful conclusion of this study. Jaime Martinez of the Chemical Laboratory at the University of Chile calculated the density of the products used in the experiments, and Rodrigo Fernández provided assistance in the field. Work on this paper started while one of us (JPLR) held a Fellowship at the Hanse Institute for Advanced Study in Delmenhorst, Germany. The logistical and financial support of the Institute is gratefully acknowledged.
We thank Marc de Batist and José-Manuel González-Casado for very thorough and instructive reviews, which helped us to improve this paper considerably.