I. INTRODUCTION
Supercapacitors have attracted considerable attention over the past few decades, owing to the high power density, high cycle efficiency, fast charge/discharge ability and a long cycle life compared with secondary batteries and conventional electrolytic capacitors.Reference Conway1, Reference Zhou, Li, Dong, Chen, Han, Xu, Yao, Shang, Liu and Cui2 To develop an advanced supercapacitor device, an active electrode material with high capacity performance is indispensable. Conducting polymers have been considered as electrode materials in supercapacitors due to their ease of synthesis, environmental stability and highly controllable electrical conductivity. However, a low cycle life and poor mechanical properties of conducting polymers resulting from the swelling and shrinkage caused during the doping/dedoping processes usually lead to a decrease in the electrochemical performance.Reference Bleda-Martínez, Morallón and Cazorla-Amorós3–Reference Wang, Li, Gao, Oli, Wu and Wang5 Of late, conducting polymers have been compounded with other fillers such as carbon materials to obtain composites as electrode materials; the cycle stability and capacitance value of carbon-based polymers are improved by synergistic effects between components.Reference Wang, Huang and Wei6–Reference Gnanakan, Rajasekhar and Subramania8
Polyaniline (PANI) is a promising electrode material because of its low cost, easy synthesis, simple acid-doping/base-dedoping process and high capacitance, but its low electronic conductivity and poor cycle stability hinder its wide application in supercapacitors.Reference Zhou, Chen, Luo, Lu, Wei and Kuang9, Reference Wang, Li, Zhao, Ren, Chen, Tan, Wu, Gentle, Lu and Cheng10 Recently, the composites of PANI and carbon material have attracted considerable interest because they possess the properties of individual component with synergistic effect.Reference Wang, Hao, Yang, Lu and Wang11 For instance, porous carbon/PANI,Reference Fan, Hu, Maier, Adelhelm, Smarsly and Antonietti12, Reference Du, Liu, Cai, Mai and Baji13 CNT/PANIReference Sivakkumar, Kim, Choi, MacFarlane, Forsyth and Kim14, Reference Zhou, Wang, Li, Zhang, Weng and Cheng15 and graphene-based PANI compositesReference Zhou, Wang, Li, Zhang, Weng and Cheng15–Reference Zhang, Zhang, Zhao and Wu18 have been reported to improve electrochemical performance of PANI due to the π-π interactions between PANI and carbon material. Graphene has attracted considerable attention since it was discovered in 2004, due to its excellent mechanical, electrical, and thermal properties and large surface-to-volume. The 2D unique structure of graphene offers the possibility of being an excellent filler or substrate for fabricating PANI/graphene nanocomposite.
Electrochemical method, in situ polymerization and interfacial polymerization have been used to synthesize PANI/graphene nanocomposite in reported literature.Reference Hao, Wang, Yang, Lu and Wang16, Reference Zhang, Zhang, Zhao and Wu18 However, PANI/graphene composite prepared by mechanochemical route has not been reported. Recently, we have demonstrated a novel room-temperature mechanochemical route to fabricate PANI/CNTs and PANI/TiO2composites, and found it was an effective method due to reduced pollution, low costs, and simplicity in process and handling. Now, it is widely used for synthesizing the polyaniline type conducting polymers.Reference Zhou, Du, Liu, Ringer and Mai19–Reference Abdiryim, Zhang and Jamal21
Herein, we report the fabrication of PANI/TiO2/G and PANI/G composites via mechanochemical route. And the structure and properties of PANI/TiO2/G was compared with that of PANI/G prepared under the same polymerization conditions. The effects of the TiO2on the structural and physicochemical properties of the resulting composite have been discussed in depth after comparison of the respective Fourier transform infrared (FTIR), ultraviolet-visible (UV-vis), x-ray diffraction (XRD), transmission electron microscopy (TEM) and the electrochemical measurements.
II. EXPERIMENTAL
A. Materials
Graphene nanoplatelets (GNP; Strem Chemicals Incorporated, Newburyport, MA) with thickness of 6–8 nm and width of 25 μm; nano-TiO2 (anatase, hydrophilic) with an average size of 40 nm (Shanghai Aladdin Reagent Company, Shanghai, China) was used as received. Aniline and ammonium peroxydisulfate [(NH4)2S2O8, APS] of analytical reagent grade were obtained from Xi’an Chemical Reagent Company (Xi'an, China), p-toluenesulfonic acid (p-TSA) was obtained from Acros Organics (Geel, Belgium). Aniline was purified by distillation under reduced pressure. All other chemicals and solvents were used as received without further purification.
B. Preparation of PANI/TiO2/G and PANI/G composites
A typical synthesis procedure of PANI/TiO2/G composite was as follows: 25 mg nano-TiO2 and 25 mg GNP were added to 0.5 mL the aniline in the mortar followed by grinding to form a slurry mixture. Then, 0.95 g p-TSA was added to this mixture. After grinding for about 5 min, the mixture became white paste. After that, 0.5 mL deionized water was added to this white paste followed by grinding. Finally, 1.1 g APS was added in two portions to this mixture by further grinding for 30 min until the color of powder changed to black green. The greenish black powder was washed with ethanol and distilled water, respectively, until the filtrate was colorless, and then the powder dried under vacuum at 60 °C for 48 h. For comparison, PANI/G composite was obtained in a similar manner except that it was performed without adding nano-TiO2.
C. Structure characterization
The FTIR spectra of the samples were measured on a Fourier transform infrared spectrometer (FTIR; model BRUKERQEUINOX-55, Aerodyne Research Incorporated, Billerica, MA) at a resolution of 4 cm−1 using the potassium bromide (KBr) technique. UV-Visible spectra of the samples were recorded on a spectrophotometer (UV-Vis; model No. UV4802, Unico, Shanghai, China). X-ray diffraction patterns have been obtained using a diffractometer (XRD; model No. Bruker AXS D8, Karlsruhe, Germany) and the scan range (2θ) was 5–80°, with monochromatic Cu Kαradiation source (λ = 0.15418 nm). Electron microscopy experiments were performed on a transmission electron microscope (TEM; Hitachi model No. 2600, Tokyo, Japan). The samples for TEM measurements were prepared by placing a few drops of products in ethanol suspension on copper supports.
D. Electrochemical tests
The working electrodes were prepared by mixing 85 wt% active materials (3 mg), 10 wt% carbon black and 5 wt% polytetrafluoroethylene (PTFE) to form a slurry, then pressed on a graphite current collector (area: 1 cm2), and dried under vacuum at 60 °C for 24 h. All electrochemical experiments were carried out using a three-electrode system, in which the sample was used as the working electrodes, platinum as the counter electrode, saturated calomel electrode (SCE) as reference electrode and 1 M sulfuric acid (H2SO4) was used as electrolyte. Cyclic voltammetry measurements were performed on (CV; model No.CHI660C) electrochemical working station. Galvanostatic charge–discharge tests and cycle stability were conducted at a Land Battery workstation. CV and Galvanostatic charge–discharge tests were done in the potential window ranging from −0.2 to 0.8 V. Electrochemical impedance spectroscopy was recorded using the spectroscope (EIS; model No. Zennium40084) under the condition: AC voltage amplitude 5 mV, frequency range 105–0.01 Hz, and open circuit potential.
III. RESULTS AND DISCUSSION
Table I lists the mass of reactants and the mass percentage of individual material constituents in the product. The reaction has been performed through grinding aniline salt, TiO2, GNP with APS at ambient temperature. The process is an exothermic reaction, and large-scale reaction could produce excessive heat. To avoid a large increase of temperature, the oxidant must be added progressively to reaction medium.Reference Bekri-Abbes and Srasra22 The content (wt%) of TiO2, GNP, and PANI can be estimated by the formula:
 $${\rm{TiO_2 \,(or \,GNP) \,wt\% = }}{{{\rm{the\, mass \,of \,adding \,TiO_2\, (or\, GNP)}}} \over {{\rm{the\, mass\, of \,sample}}}} \times {\rm{100\% }}\quad{\rm{.}}$$
The composition of PANI/TiO2/G and PANI/G composites.

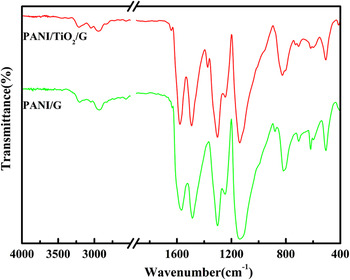
The FTIR spectra of PANI/G and PANI/TiO2/G are shown in Fig. 1.The main characteristic peaks positions in both of them are almost same, the broad band at ∼3205–3300 cm−1 is attributable to the N–H stretching vibration due to the protonation of nitrogen,Reference Palaniappan23, Reference Bhadra, Singha and Khastgir24 ∼3050–3109 cm−1 is assigned to stretching vibration of the aromatic -C–H bond and the characteristic band at 2835–2955 cm−1 can be due to the stretching vibration of methyl group (−CH3). The two bands appearing at ∼1565–1578 cm−1 and ∼1487 –1497 cm−1 correspond to the stretching vibration of quinoid and benzenoid ring, respectively.Reference Palaniappan23–Reference Huang and Lin25 The band at 1297–1311 cm−1 can be assigned to the π-electron delocalization induced in the polymer through protonation or C–N–C stretching vibration, whereas the peak at ∼1246 cm−1 is due to the C–N+ stretching vibration in the polaron structure.Reference Abdiryim, Zhang and Jamal21, Reference Yang, Ishikawa, Itoh and Feng26 The peak at ∼1137–1145 cm−1 is assigned to the plane bending vibration of C–H (modes of N=Q=N, Q=NH+–B and B–NH+–B, Q represents the quinoid ring and B represents the benzenoid ring), which is formed during protonation.Reference He27 The band appearing at ∼815–830 cm−1 is attributed to an aromatic C–H out-of-plane bending vibration.Reference Nagaraja, Pattar, Shashank, Manjanna, Kamada, Rajanna and Mahesh28 The presence of characteristic bands confirms that the conducting emeraldine salt phase of PANI exists in both of the two composites. Moreover, it is found that some bands of PANI/TiO2/G have obvious changes as compared with PANI/G. For example, the band at ∼3205–3300 cm−1 that is attributed to N–H stretching mode, shifts to higher wave number and is enhanced in PANI/TiO2/G composite due to the contribution of O-H stretching mode of TiO2 molecules. In addition, both of the bands at ∼1565–1578 cm−1 and ∼1487–1497 cm−1 shift about 10 cm−1 to higher wave number in PANI/TiO2/G, which correspond to the stretching vibration of quinoid and benzenoid ring of PANI, respectively, this may be due to the π electron interaction existing at the interface of PANI, TiO2 particles and GNP.Reference Li, Wang, Li and Lu29, Reference Xia and Wang30 Due to the addition of nano-TiO2, the oxidation degree of the PANI in PANI/TiO2/G is higher as shown by calculating the ratio (I Q/I B).Reference Katoch, Burkhart, Hwang and Kim31, Reference Bhadra, Chattopadhyay, Singha and Khastgir32 The value is 0.89 for PANI/G, which means that PANI that has been subjected to more reduction exists in it. But the value is 0.98 for PANI/TiO2/G, which is close to 1, indicating that the formation of polyaniline is in its doped emeraldine oxidation state.Reference Bhadra, Chattopadhyay, Singha and Khastgir32 This may have resulted because of the following reason: when TiO2 is excited by the photons of higher energy than the band gap, electron-hole pairs are generated which in turn react with hydroxyl ion producing reactive radicals of •O2− and HO•, and these radicals are extremely strong oxidants.Reference Li, Wang, Cheng, Luo, An and Wang33 In our case, the reaction takes place under the visible light, indicating the possibility of formation of these radicals in reaction system. Thus, it is concluded that with the effects of these radicals, the nano-TiO2 may make PANI/TiO2/G display higher oxidation degree than PANI/G.
FTIR spectra of PANI/G and PANI/TiO2/G composites. (color online)

Figure 2 shows the UV–vis absorption spectra of PANI/G and PANI/TiO2/G in m-cresol solution. As can be seen from Fig. 2, the absorption peak at ∼315–342 nm can be ascribed to π-π* transition of the benzenoid rings, whereas the peak at 405–442 nm can be attributed to polaron-π* transition of PANI.Reference Katoch, Burkhart, Hwang and Kim31, Reference Huang, Moore, Acquaye and Kaner34 The peak at ∼315–342 nm can also be attributed to the leucoemeraldine (fully reduced form) of PANI, whereas the peak at ∼405–442 nm is due to the protonated form of PANI.Reference Huang, Moore, Acquaye and Kaner34 Comparing the peaks at ∼315–342 nm and ∼405–442 nm, one can see that the corresponding peaks of PANI/TiO2/G slightly shifts to higher wave length. This phenomenon can be understood by the results from FTIR studies, which indicates that the PANI/TiO2/G composite has a higher oxidation degree than PANI/G composite. The higher oxidation degree of composite suggests a bigger portion of the quinoid structural units in composites. This will enhance the conjugation degree of the polymer chain, and bring a red shift for respective peaks.
UV–vis absorption spectra of PANI/G and PANI/TiO2/G composites. (color online)

Figure 3 shows typical XRD patterns of GNP, nano-TiO2, PANI/G, and PANI/TiO2/G composites. GNP shows a sharp peak at 2θ = 26.6°, corresponding to d-spacing between single graphene layers (0.34 nm).Reference Tung, Khai, Jeon, Lee, Chung, Bang and Sohn17, Reference Bourdo, Warford and Tito35 From the XRD pattern of TiO2, it is attributed to the anatase phase by comparing with that in Joint Committee on Power Diffraction Standards (JCPDS) file 21–1272. The peaks with a low intensity appeared at 20 and 25° in PANI/G can be associated with the (020) and (200) crystal planes of PANI, respectively,Reference Chaudhari and Kelkar36 and they were considered as a reflections of the periodicity parallel and perpendicular to the polymer chain.Reference Chiou and Epstein37 The XRD patterns of PANI/G and PANI/TiO2/G composites showed that the characteristic diffraction peaks of GNP exist in both of them, whereas the characteristic peaks of TiO2 exist only in PANI/TiO2/G. On comparing with the patterns of PANI/G, no new peaks appear in the patterns of PANI/TiO2/G at 2θ ∼ 8°, 15°, which could have resulted from highly crystalline PANI. Therefore, one can conclude that no additional crystalline order is introduced into the composites. This indicates that the difference between the patterns of composites should mainly arise from the superimposition of peaks of PANI/G and TiO2 at 2θ ∼ 20°, indicating the successful incorporation of TiO2 in PANI/G. However, a close look will reveal that half-height width of the XRD peak at 2θ ∼ 20° in PANI/TiO2/G is higher than that of PANI/G, implying that the incorporation of TiO2 can decrease the crystallinity of the PANI, which may result from the fact that the introduction of the TiO2 hampered the crystallization of the PANI molecular chains by coordination.
XRD patterns of GNP, nano-TiO2, PANI/G and PANI/TiO2/G composites. (color online)

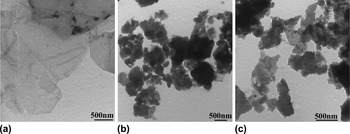
Figure 4 represents the TEM image of GNP(a), PANI/G(b), and PANI/TiO2/G(c) composites. Some corrugations and plate form on the thin smooth surface of graphene nanoplatelet are clearly observed in Fig. 4(a). This is in very good agreement with some references reported.Reference Dhakate, Chauhan, Sharma, Tawale, Singh, Sahare and Mathur38 From Fig. 4(b), GNP is fully covered by uniform PANI particles and the thickness of GNP is thicker so that it is hard to observe the thin smooth surface of GNP. From the TEM image of the PANI/TiO2/G composite in Fig. 4(c), nano-TiO2 particles surrounded by PANI are dispersed on GNP. The bent and flat rough surfaces are as shown in Figs. 4(b) and 4(c); such thin composites reveal adequate utilization of the large specific surface area of graphene nanoplatelet. As for PANI/TiO2/G, the interaction between components avoid grain aggregations and give a good dispersion of the TiO2 nanoparticles, which facilitates the fast and easy penetration of the electrolyte and reduces the diffusion and migration length of the electrolyte ions during the fast charge/discharge process and is the desired property in electrode materials.Reference Su, Wang, Zhang, Song, Mao, Niu, Jin, Wu and Tian39
TEM image of (a) GNP, (b) PANI/G, and (c) PANI/TiO2/G composites.

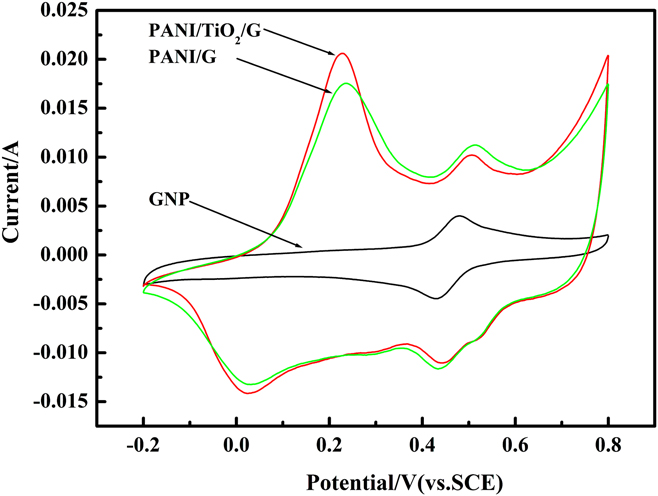
Figure 5 shows the CV curves of GNP, PANI/G, and PANI/TiO2/G composites at the scan rate of 5 mV/s. Positive peaks in Fig. 5 are for oxidation and the negative peaks are for reduction processes. In Fig. 5, in the case of GNP, one pair of strong reversible peaks is observed due to the additives in the as-received GNP. On the other hand, it can be found that there are two couples of redox peaks in PANI/G and PANI/TiO2/G composites, attributed to the redox transition of PANI between a semiconducting state (leucoemeraldine form) and a conducting state (polaronic emeraldine form) which results in the redox capacitanceReference Wang, Li and Xia40 and redox reaction from additives in the GNP (used without further purification). In addition, the larger current density response and larger rectangular areas of PANI/G and PANI/TiO2/G composite electrodes means higher specific capacitance than that of GNP. This may be resulting from synergistic effects between components. On careful examination, it is observed that the PANI/TiO2/G composite has the highest current peak and largest rectangular area, suggesting that the PANI/TiO2/G composite has better electrochemical activity and higher capacitance than GNP and PANI/G.
CV curves of GNP, PANI/G, and PANI/TiO2/G composites at the scan rate of 5 mV/s. (color online)
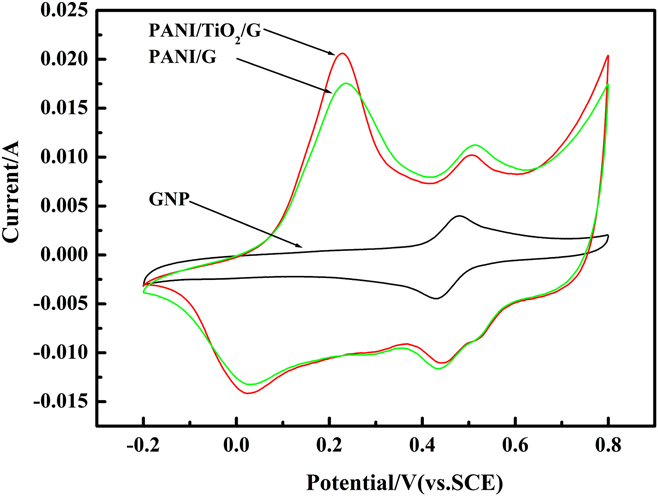
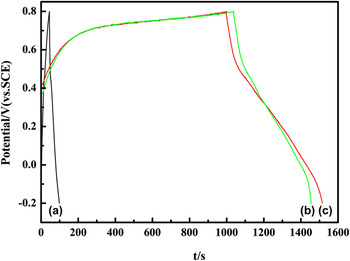
Figure 6 shows the galvanostatic charge-discharge curves of GNP(a), PANI/G(b), and PANI/TiO2/G(c) composites at 3 mA/cm2. The specific capacitance (SC) of the electrode material is calculated by means of SC = (I × Δt)/(ΔV × m),Reference Mi, Zhang, An, Ye and Yang41 where I is charge-discharge current, Δt is the discharge time, ΔV is the electrochemical window (1 V), and m is the mass of active materials within the electrode (3 mg). And the SC of GNP, PANI/G and PANI/TiO2/G composites are 54, 414, 516 F/g, respectively, and this result is consistent with the CV analysis. It should be noted that the SC of PANI/G is higher than PANI/carbon nanotube composites prepared by microwave- assisted synthesisReference Mi, Zhang, An, Ye and Yang41 and in situ polymerization method.Reference Lu, Dou, Yang, Hao, Zhang, Shen, Zhang and Zhang42 This enhanced SC may be resulting from contribution of the bent/flat surface and large surface-to-volume of the GNP, such unique structure as support material can homogeneously disperse the PANI particle which ensures that electrolyte ions are easily accessible to the PANI matrix for faradaic reactions and can improve the capacitance of the PANI with synergistic effect. For PANI/TiO2/G, it has the SC with 516 F/g, which is higher than previous literatureReference Su, Wang, Zhang, Song, Mao, Niu, Jin, Wu and Tian39-reported 430 F/g.
Galvanostatic charge-discharge curves of (a) GNP, (b) PANI/G, and (c) PANI/TiO2/G composites at 3 mA/cm2 in 1 M H2SO4. (color online)

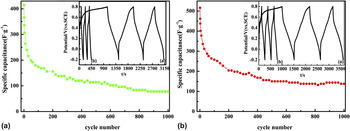
The long-term cycle stability of the PANI/G and PANI/TiO2/G composites was also evaluated by repeating the galvanostatic charge–discharge test at the 3 mA/cm2 for 1000 cycles. The specific capacitance (SC) based on electroactive materials as a function of cycle number is presented in Fig. 7. As shown in Fig. 7(a), the specific capacitance of PANI/G decreases by 63% after 200 cycles, but does not reach the steady state in the subsequent cycles. The capacitance decreases by 81% of initial capacitance after 1000 cycles. However, as shown in Fig. 7(b), the PANI/TiO2/G electrode is found to exhibit excellent stability over the entire range of cycles. After 200 cycles, the specific capacitance decreases by 60% of the initial cycle and the electrode thereafter reaches the steady state. After 1000 cycles, the capacitance decreases only by 73% of initial capacitance. The decrease of specific capacitance could be attributed to the swelling and shrinkage during the long-term charge/discharge processes.Reference Dhawale, Vinu and Lokhande43 The higher capacitance and better cycle stability of PANI/TiO2/G may be resulting from the following reasons: first, the uniform PANI layer coating on the surfaces of the TiO2 greatly improves the dispersion of the PANI phase to ensure electrolyte ions easily accessible to the PANI matrix for faradaic reactions. Second, the PANI/TiO2 can increase the basal spacing between GNP sheets. Therefore, electrolyte ions have better accessibility to the GNP surfaces, leading to a significant enhancement of capacitance. Third, TiO2 is electrochemically active as electrons could be effectively and rapidly conducted back and forth from the TiO2 nanoparticles to the GNP or PANI. Synergistic effect afforded facile electron transport among TiO2 nanoparticles, GNP sheets, and PANI matrix, which is the key to the high capacitance and cycle stability of the PANI/TiO2/G composite.Reference Su, Wang, Zhang, Song, Mao, Niu, Jin, Wu and Tian39, Reference Yan, Wei, Fan, Qian, Zhang, Shen and Wei44
Cycle stability of the (a) PANI/G and (b) PANI/TiO2/G composite; the two insert images show PANI/G and PANI/TiO2/G at (a) 1–3, (b) 998–1000 cycles. (color online)

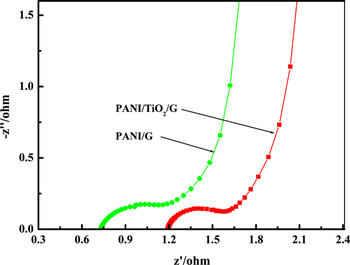
EIS of the PANI/G and PANI/TiO2/G composites is presented in Fig. 8. It could be readily seen that the impedance spectra of both of them are composed of one semicircle at high frequency end followed by a linear part at the low-frequency end. First, the high frequency intercept of the semicircle with the real axis can be used to evaluate the value of internal resistance. Second, the imaginary impedance at low frequency reveals a slightly tilted vertical line of a limiting diffusion process, which is characteristic feature of pure capacitive behavior.Reference Mi, Zhang, Ye and Yang45 The solution resistances (Rs) obtained from the intercept of the semicircle with the real axis are 0.72 and 1.18 Ω for PANI/G and PANI/TiO2/G, respectively. Then, the faradaic charge-transfer resistances (Rct) obtained from the radius of the semicircle are 0.17 and 0.15 Ω for PANI/G and PANI/TiO2/G, respectively. Clearly, the introduction of nano-TiO2 particle increases the Rs but decreases the Rct of the electrode, but the values are small. These results also further confirm that the PANI/TiO2/G has better capacitive behavior and will be more effective as electrode material for supercapacitors.
Electrochemical impedance spectroscopy of PANI/G and PANI/TiO2/G composites. (color online)

IV. CONCLUSIONS
In this study, PANI/TiO2/G and PANI/G composites were synthesized by mechanochemical route forcomparative evaluation. The results showed that the PANI/TiO2/G composite has higher oxidation degree and lower degree of crystallinity than PANI/G due to the addition of nano-TiO2. Morphology studies showed that the bent and flat surfaces of GNP are fully dispersed by nano-TiO2 particles and PANI in the PANI/TiO2/G. The electrochemical tests showed that the PANI/TiO2/G composite displayed a higher electroactivity with specific capacitance of 516 F/g and better cycle stability behavior when compared with PANI/G. GNP was used as support material for deposition of PANI particles and nano-TiO2 as conductive path between the interfaces of PANI particles and GNP, resulting in the improvement of electrochemical performances. The mechanochemical route method might be facile but effective and could be readily used for commercial mass production of the PANI/TiO2/G composite.
ACKNOWLEDGMENTS
We gratefully acknowledge the financial support from National Natural Science Foundation of China (Grant Nos. 20964004 and 21064007) and Xinjiang University- Institution cooperation Project (Grant No. XJDX1108-2012-03).