INTRODUCTION
Size inequality in plant communities arises when a few large individuals suppress the growth of the rest. This outcome depends on the differential acquisition and use of resources by each plant, which is ultimately a function of the type and distribution of the limiting resources (Weiner Reference WEINER1990). For example, depletion of below-ground resources induces competition between large and small plants in proportion to their size (size-symmetric competition; Hikosaka & Hirose Reference HIKOSAKA and HIROSE2001, Schwinning & Weiner Reference SCHWINNING and WEINER1998). In contrast, when competing for light, taller plants have a disproportionate advantage over smaller plants (size-asymmetric competition; Weiner Reference WEINER1990). When size-asymmetric competition is intense, larger trees achieve greater relative growth rates and suppress the growth of smaller trees. Thus, size inequality increases, particularly in high-density stands (Nord-Larsen et al. Reference NORD-LARSEN, DAMGAARD and WEINER2006, Schwinning & Weiner Reference SCHWINNING and WEINER1998).
Maximum height is directly correlated with relative growth rate, survival and reproduction (Falster & Westoby Reference FALSTER and WESTOBY2003, Thomas Reference THOMAS1996, Westoby et al. Reference WESTOBY, FALSTER, MOLES, VESK and WRIGHT2002). Maximum height enhances the capacity of individual trees to pre-empt light, but the limits to maximum height are imposed by water availability at both the local and global scales (Koch et al. Reference KOCH, SILLETT, JENNINGS and DAVIS2004, Moles et al. Reference MOLES, WARTON, WARMAN, SWENSON, LAFFAN, ZANNE, PITMAN, HEMMINGS and LEISHMAN2009, Poorter et al. Reference POORTER, HAWTHORNE, BONGERS and SHEIL2008). Low water availability may constrain height by increasing the risk of hydraulic failure (Niklas & Spatz Reference NIKLAS and SPATZ2004, Ryan & Yoder Reference RYAN and YODER1997) and may reduce the variance in tree size and size inequality, especially in dry environments and during years of low precipitation (Bagchi Reference BAGCHI2007, Wichmann Reference WICHMANN2001).
In this respect, mangroves are interesting ecosystems in which to study the relative influence of size-symmetric and size-asymmetric competition because they are subject to gradients of light, substrate salinity and hydroperiod that depend on their distance from continental vs. seawater input and local geomorphology (López-Hoffman et al. Reference LÓPEZ-HOFFMAN, ANTEN, MARTÍNEZ-RAMOS and ACKERLY2007, López-Portillo & Ezcurra Reference LÓPEZ-PORTILLO and EZCURRA1989, Thom Reference THOM1967, Twilley & Rivera-Monroy Reference TWILLEY, RIVERA-MONROY, Perillo, Wolanski, Cahoon and Brinson2009). Mangrove trees are subject to salinity stress, and this water limitation (due to lower water potential, Naidoo Reference NAIDOO2006) should enhance symmetric size-specific competition with associated reductions in size inequality and maximum size (Bagchi Reference BAGCHI2007, Ryan & Yoder Reference RYAN and YODER1997). However, mangroves are also shade-intolerant species, and every tree competes with its neighbours to reach the canopy (Corlett Reference CORLETT1986, Janzen Reference JANZEN1985). This competition for light is highly intense and asymmetric, thus increasing size inequality and maximum tree height (Falster & Westoby Reference FALSTER and WESTOBY2003, Nord-Larsen et al. Reference NORD-LARSEN, DAMGAARD and WEINER2006).
Because higher salinity constrains plant growth, we hypothesized that (1) maximum tree size and inequality within a forest plot will increase as salinity decreases and (2) the mode of competition will vary from highly size asymmetric in lower-salinity habitats to size symmetric in higher-salinity habitats. The first hypothesis was tested by using the Gini coefficient (G) and the asymptote of a height-diameter allometry model (Thomas Reference THOMAS1996) as response variables, and mangrove habitat as the explanatory variable. The second hypothesis was tested by correlating tree density, basal area and size inequality with groundwater salinity (Nord-Larsen et al. Reference NORD-LARSEN, DAMGAARD and WEINER2006, Schwinning & Weiner Reference SCHWINNING and WEINER1998).
METHODS
Study site and species
Our study was conducted at La Mancha Lagoon, Veracruz, Mexico (19°35′N, 96°23′W, 1200 mm annual precipitation, 25°C mean annual temperature). North trade winds (up to 100 km h−1) are the main disturbance in this area as hurricanes (from 120–300 km h−1) have been absent in the zone for the past 100 y (http://maps.csc.noaa.gov/hurricanes/).
In mangroves, the community size structure is restricted to a limited set of assemblage options by geomorphology (Twilley & Rivera-Monroy Reference TWILLEY, RIVERA-MONROY, Perillo, Wolanski, Cahoon and Brinson2009). These assemblages range from riverine mangroves, characterized by abundant fresh-water input and tall trees, to dwarf mangroves in resource-poor environments such as karstic coasts and dry sites (Lugo & Snedaker Reference LUGO and SNEDAKER1974, Naidoo Reference NAIDOO2006). From a geomorphological point of view, two habitats with highly contrasting characteristics exist at our study site (López-Portillo & Ezcurra Reference LÓPEZ-PORTILLO and EZCURRA1989, Méndez-Linares et al. Reference MÉNDEZ-LINARES, LÓPEZ-PORTILLO, HERNÁNDEZ-SANTANA, ORTIZ-PÉREZ and OROPEZA-OROZCO2007, Thom Reference THOM1967): (1) inactive mudflats (MFs), which are lagoon habitats characterized by periodic tidal flooding followed by a decrease in the water table during the dry season, resulting in fine clay deposits and chronic salt accumulation; and (2) interdistributary basins (IBs), which are habitats flanking rivers and main waterways that drain higher land toward the body of the lagoon. The constant influx of fresh water in this habitat makes it less prone to hyperaccumulation of salt. In the Gulf of Mexico, Avicennia germinans L. (Avicenniaceae) is the dominant species in both habitats, even forming dense and nearly monospecific stands in MFs. In the IBs, A. germinans forms mixed forests with Rhizophora mangle L. (Rhizophoraceae) and Laguncularia racemosa (L.) C.F. Gaertn. (Combretaceae) (Thom Reference THOM1967).
Study plots
We selected twenty 50 × 50-m (0.25 ha) study plots via a survey of 1:10 000 aerial orthocorrected photographs and vegetation maps of La Mancha Lagoon. Ten plots corresponded to MFs and the other ten to IBs (Figure 1). In each plot, the stem diameter at breast height (dbh) and the height of all living trees > 1 cm dbh were measured.
Mangrove habitats in the La Mancha lagoon, Veracruz, Mexico. Circles indicate sampling plots made on mudflats (filled area, open circles) and interdistributary basins (hatched area, filled circles).

Environmental measurements
In June, July, October and December of 2005, we measured salinity of interstitial water extracted from previously installed piezometers (3.2-m long PVC tubes buried 1.6 m below soil level) at the centre of each plot using a handheld YSI-30 salinity meter (YSI Inc., Yellow Springs, Ohio, USA). In May 2011 we measured salinity of interstitial water again and extracted one 30-cm-deep soil core within each plot. We measured soil relative density from samples extracted from the soil core at a soil depth corresponding to 10 cm with a 3-cm3 cylinder, pH and described each soil core with respect to soil texture and relative root abundance. One-way repeated-measures analysis of variance (ANOVA) and the Holm–Sidak post hoc method (Glantz Reference GLANTZ2005) were used for statistical comparisons between habitats across sampling dates. A Student's t-test was used to compare between habitats with respect to soil density.
We also measured the mean percentage cover of each species within each plot using a spherical crown densiometer (Forestry Suppliers Inc., Jackson, MS, USA). We took four measurements, one per cardinal direction. The cover measurements were arcsine transformed, and the average percentage of cover per species was calculated.
Size inequality and mangrove habitats
To assess the effects of habitat on size inequality within mangrove communities, we used Lorenz curves and G (Damgaard & Weiner Reference DAMGAARD and WEINER2000, Weiner & Solbrig Reference WEINER and SOLBRIG1984). Lorenz curves were obtained by plotting the cumulative proportion of sizes (of stem diameter or height) against the cumulative proportion of individuals ranked by size. If all individuals contribute equally to the cumulative proportion of sizes, then the distribution resembles a so-called ‘line of equality’ at a 45° angle. If individuals do not contribute equally to total size, then the line resembles a curve (Weiner & Solbrig Reference WEINER and SOLBRIG1984). G is ‘the ratio between the area enclosed by the line of equality and the Lorenz curve, and the total triangular area under the line of equality’ (Damgaard & Weiner Reference DAMGAARD and WEINER2000). After ordering the data by increasing size (xi′), G was calculated using the following equation:

where G = 0 represents equality, G = 1 indicates maximum inequality, and μ and n refer to the mean and the sample size (Damgaard & Weiner Reference DAMGAARD and WEINER2000).
We calculated Lorenz curves and G using the Mathematica notebooks (Wolfram Research, Inc., Mathematica, Version 5.2, Champaign, IL, USA) developed by Damgaard (LorenzCurve.html and GiniCoefficient.html at http://mathworld.wolfram.com/). Ninety-five per cent confidence intervals were obtained by bootstrapping 1000 estimates of G in each stand. For descriptive purposes, we also constructed frequency histograms using Scott's rule (Scott Reference SCOTT1979), and we inferred the underlying continuous distributions of diameter and height using Kolmogorov–Smirnov goodness-of-fit analyses (Glantz Reference GLANTZ2005).
The mechanism of competition (symmetric vs. asymmetric) was inferred by the correlation between G and density. If the competition is size-symmetric, we expect inequality to decrease as density increases, but under size-asymmetric competition, size inequality should increase with increasing density (Nord-Larsen et al. Reference NORD-LARSEN, DAMGAARD and WEINER2006, Schwinning & Weiner Reference SCHWINNING and WEINER1998). Finally, we correlated G with total basal area and interstitial water salinity. The skewed distribution of G required arcsine transformation. We found that density, basal area and G were intercorrelated, and so instead of analysing them separately we synthesized them by means of principal components analysis (Austin Reference AUSTIN1985, López-Portillo & Ezcurra Reference LÓPEZ-PORTILLO and EZCURRA1989, Méndez-Alonzo et al. Reference MÉNDEZ-ALONZO, LÓPEZ-PORTILLO and RIVERA-MONROY2008).
Height–diameter allometry
To estimate the maximum size that the mangroves attained in each habitat, we fitted a height–diameter (H–D) relationship for each study plot using the following non-linear, allometric function:

where H is height, D is the stem diameter at breast height, Hmax is the asymptotic height and a is an allometric slope constant (Thomas Reference THOMAS1996). We calculated non-linear allometric estimates using the Marquardt–Levenberg least squares algorithm for estimation of parameters using the Sigma Plot 10 curve fitter (Marquardt Reference MARQUARDT1963). We fitted allometric curves for all individuals in the community and for the dominant species, A. germinans.
RESULTS
Interstitial salinity and soil properties
Across all sampling dates, interstitial water salinity was consistently higher in the MFs than in the IBs (34.7‰ ± 1.2‰ vs. 19.1‰ ± 2.4‰). Additionally, multiple comparisons after one-way repeated-measures ANOVA indicated that interstitial water salinity was significantly higher in the MFs than in the IBs on three of the four sampling dates (Figure 2). The soil texture differed between habitats: in the IBs, the soil below the first 10 cm was mostly composed of lime and clay with organic matter; in the MFs, the soil was mostly clay, and there was almost no organic horizon. Accordingly, soil density at 10–20 cm depth was significantly lower in the IB than in the MF (0.69 ± 0.03 vs. 0.84 ± 0.06 g cm−3, t18 = 2.5, P = 0.02). The soil pH was similar between the habitats (IB = 6.74 ± 0.24, MF = 6.74 ± 0.30).
Interstitial water salinity in the mudflat (filled circles) and interdistributary basin (open circles) plots in La Mancha lagoon, Veracruz, Mexico. Asterisks indicate significant differences between habitats on the same date.

Size inequality between habitats
The A. germinans canopy cover was higher in the MFs than in the IBs (MF = 74.0% ± 3.0% vs. IB = 62.6% ± 2.1%, P = 0.01), and this finding was also true for R. mangle (IB = 22.8% ± 3.2% vs. MF = 3.8% ± 2.5%, P < 0.001). The canopy cover corresponding to L. racemosa did not change significantly between the habitats (IB = 8.1% ± 3.9% vs. MF = 10.1% ± 5.4%, P = 0.76). Overall, the canopy cover of the community was relatively high and statistically similar between the habitats (IB = 93.4% ± 4.4% vs. MF = 87.9% ± 5.6%, P = 0.45).
We developed a database containing measurements of 2564 trees in the IBs and 2125 trees in the MFs. Figure 3 shows the mean relative size frequency of A. germinans, L. racemosa and R. mangle trees in both mangrove habitats and their corresponding Lorenz curves and G. The Lorenz curves were closer to the line of equality in the MFs than in the IBs, indicating greater inequality in the latter. For consistency, we compared the G obtained from the stem diameter and height; the inequality was significantly greater in diameter than in height in the IBs but not in the MFs (Table 1). When comparing the two mangrove habitats, the G values were significantly higher in the IBs than in the MFs, both in stem diameter and height (Table 1). The height frequency distribution of A. germinans approaches a log-normal distribution in the MFs (Kolmogorov–Smirnov test = 0.17, P = 0.15) and a bimodal distribution in the IBs with peaks at 4 and 18 m, which differs significantly from a normal or a log-normal distribution (Shapiro–Wilks W test = 0.89, P = 0.01). The bimodal height distribution frequency is log-normal in both mangrove habitats when the added frequencies of the other two species, R. mangle and L. racemosa, are considered (Figure 3b, d; K-S test for MFs = 0.19, P = 0.15; for IBs = 0.16, P = 0.15).
Comparison of Gini coefficients (± SE) obtained from the tree diameters (D) and heights (H), both within and between two mangrove habitats, interdistributary basins (IB) and mudflats (MF) in La Mancha lagoon, Veracruz, Mexico.

Relative frequency histograms of Avicennia germinans (filled bars) and Rhizophora mangle and Laguncularia racemosa (open bars) size categories using dbh (D) and tree height (H) for the mudflat plots (a, b) and the interdistributary basin plots (c, d) in La Mancha lagoon, Veracruz, Mexico. Also shown are Lorenz curves (inset, proportion of accumulated plant size vs. proportion of individuals in each stand) and mean Gini coefficients (G) ± SE.

Height–diameter allometry vs. habitat
The coefficient of determination (R2) for the non-linear allometric model was relatively high (average R2 = 0.85 ± 0.10) for all sites except for two stands in the MFs with a relatively homogeneous height distribution. The Hmax values of A. germinans were significantly higher when compared with those of the whole community (for example, A. germinans = 19.2 ± 0.22 m, community value = 18 ± 0.48 m; Table 2). The slope parameter was statistically similar between habitats and when comparing A. germinans with the mangrove community data (Table 2).
Comparison of estimated maximum tree heights (Hmax, m) and slope parameters (a) obtained from the allometric asymptotic equation H = Hmax (1 − eaD), considering only Avicennia germinans (Ag) or the whole mangrove community (MC = Avicennia germinans, Laguncularia racemosa and Rhizophora mangle), within and between two mangrove habitats, interdistributary basins (IB) and mudflats (MF) in La Mancha lagoon, Mexico.

In the MFs, no clear asymptote was reached, and therefore, the Hmax estimates were highly variable (Hmax = 14.5 ± 1.9 m, CV = 32.5, Figure 4a–b). By contrast, in the IB, most stands showed clear asymptotes for the same H–D equation and a much lower coefficient of variation (Hmax = 18 ± 0.48 m, CV = 7.7, Figure 4c–d). If the ten tallest trees of each habitat were selected, we found that trees from IB attained significantly greater diameter (0.97 ± 0.06 m vs. 0.44 ± 0.02 m; t = 8.38, P < 0.001) and height (21.6 ± 0.3 m vs. 18.9 ± 0.2 m; t = 7.49, P < 0.001) than the trees from the MF.
Scatter plot of tree height vs. diameter at breast height in ten mudflats (a) and ten interdistributary basins (c). The corresponding asymptotic allometric fit for mudflats (b) and interdistributary basins (d) are also shown. Each data point is an individual tree of Avicennia germinans, Rhizophora mangle or Laguncularia racemosa within La Mancha lagoon, Veracruz, Mexico.

Biological variables vs. salinity
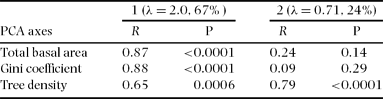
The first and second principal components accounted for 67% and 24% of the total variance in the data, respectively (Table 3). The three biological variables were significantly correlated with the first axis but only tree density was significantly correlated with the second axis, so only the first axis is considered for further analyses. Since the principal components are difficult to interpret directly, the projections of the intervening variables on the first principal axis were calculated instead of using the actual principal component axis values (Figure 5). The three projected variables contributed significantly to the first principal component (P < 0.001; Table 3). The derived biotic axis was regressed against interstitial water salinity; this relationship was negative and statistically significant (R = −0.65, P = 0.003, Figure 5), indicating that size inequality, total basal area and density decrease as salinity increases.
Eigenvalues (λ) and percentage of variance (%) accounted by the first and second principal component axes of the biological data set including total basal area, tree density and the Gini coefficient. The correlation coefficients (R) and significance values (P) between each variable and the first and second principal axes are shown.
Linear regression between a compound axis from a principal component analysis (PCA) summarizing basal area, density and (arcsine transformed) Gini coefficients vs. salinity in mudflats (filled circles) and interdistributary basins (open circles) in La Mancha Lagoon, Veracruz, Mexico. Salinity was measured in May 2011, during the dry season.

DISCUSSION
Size inequality was higher in the IBs than in the MFs. Since greater salinity stress reduces plant water potential (Naidoo Reference NAIDOO2010) we expect a reduced rate of growth of the canopy trees in MFs, which appear to have a homogeneous structure, analogous to the decrease reported for tropical dry forests (Bagchi Reference BAGCHI2007). In contrast, the size structure in IBs seems limited by light due to the taller canopy of A. germinans trees and the additional cover of L. racemosa and Rhizophora mangle trees. Such individuals must reduce the amount of light available to the understorey trees, leading to asymmetric competition and greater size inequality (Bauer et al. Reference BAUER, WYSZOMIRSKI, BERGER, HILDENBRANDT and GRIMM2004).
We found evidence of asymmetric competition in the low-salinity mangroves as G was directly correlated with total basal area and density in the IBs. In addition, in this habitat, the frequency distribution of tree height suggests a two-stratum height structure. One stratum corresponds to the canopy trees, where most of the light is depleted, and a lower stratum consists of growth-suppressed individuals. In the shade, there may be abundant mangrove saplings forced to increase their height and specific leaf area and reduce their mass and crown area (Turner et al. Reference TURNER, GONG, ONG, BUJANG and KOHYAMA1995). At our study site, there were many standing dead trees with such characteristics that likely failed to reach the canopy. In this respect, the effects of light and salinity may deter the growth of saplings (López-Hoffmann et al. 2007, Turner et al. Reference TURNER, GONG, ONG, BUJANG and KOHYAMA1995).
Size-asymmetric competition is expected to be reduced in multispecies forests due to the partitioning of light niches among species (Van Kuijk et al. Reference VAN KUIJK, ANTEN, OOMEN, VAN BENTUM and WERGER2008). In our study, we found that in the IBs A. germinans shows a bimodal height distribution with a ‘valley’ in the middle size categories that is filled by R. mangle and L. racemosa individuals. This valley suggests that size-asymmetric competition plays an important role in the structure and diversity of this mangrove habitat. Furthermore, the canopy is occupied by more individuals competing for space (Huckle et al. Reference HUCKLE, POTTER and MARRS2000, Ryan & Yoder Reference RYAN and YODER1997), as expected in size-asymmetric competition. In the MFs, however, the decreased growth stemming from the higher salinity and lower water potential may explain the lower G. The distribution of biomass likely changes as a function of salinity, from highly skewed in low-salinity, high-basal-area habitats to a nearly equal partition of biomass among individuals in high-salinity, low-basal-area habitats (Weiner & Freckleton Reference WEINER and FRECKLETON2010).
The differences between the two mangrove habitats in this study could be a consequence of different rates of disturbance or reflective of a successional process. On the one hand, IBs receive sediment and nutrients when the rivers that flank them overflow during the rainy season, especially during extraordinary rainfall in the watershed. On the other hand, MFs, especially inactive MFs, are relatively far from sediment sources and thus receive little sediment, and what they do receive is of finer texture. Thus, these habitats are under different successional trajectories (Lugo Reference LUGO1980, Thom Reference THOM1967). Mangroves in inactive MFs form stable communities (Méndez-Linares et al. Reference MÉNDEZ-LINARES, LÓPEZ-PORTILLO, HERNÁNDEZ-SANTANA, ORTIZ-PÉREZ and OROPEZA-OROZCO2007, Thom Reference THOM1967), and there is no evidence that with succession they will increase in diversity and maximum tree size even if small gaps are formed. IBs receive more sediment and fresh water, which might raise the substrate levels and reduce interstitial salinity, especially when the stands are dense (Kumara et al. Reference KUMARA, JAYATISSA, KRAUSS, PHILLIPS and HUXMAN2010). However, they are also subject to soil compaction after small-scale disturbances (Sherman et al. Reference SHERMAN, FAHEY and BATTLES2000), and thus, the net increase in soil level will be lower than expected.
Height–diameter scaling seems to be constrained by salinity. In the IBs, a clear asymptote was found, indicating that IB trees increased in diameter at a higher rate than MF trees, which, after reaching their maximum possible height, significantly reduced their growth in diameter and were therefore unable to reach an H–D asymptote. Although there was no significant difference in tree height between the habitats (except when considering the ten largest trees), the trees in the MFs did not increase their girth by more than 60 cm. According to Leonardo da Vinci's rule, the cross-sectional area of the basal stem is equal to the cross-sectional areas of the terminal branches (Sone et al. Reference SONE, SUZUKI, MIYAZAWA, NOGUCHI and TERASHIMA2009), and thus, the inequality in A. germinans diameters implies that the largest trees in the IBs are able to support more terminal branches than those in the MFs. Indeed, individual crown area scales as a function of diameter to the 4/3 power (West et al. Reference WEST, ENQUIST and BROWN2009), and the trees under shade often reduce their crown exposure (Turner et al. Reference TURNER, GONG, ONG, BUJANG and KOHYAMA1995). The implication is that, in the IBs, most of the canopy area may be covered by a few large trees that suppress the growth of smaller individuals, as reported for herbaceous species (Nagashima et al. Reference NAGASHIMA, TERASHIMA and KHATO1995).
Conclusions
In low-salinity mangrove environments, trees below the canopy are vulnerable to hydraulic failure and carbon starvation and may die from natural causes. One of us has studied the common uses of mangrove wood within La Mancha Lagoon and found that the trees most frequently used by the human population are those with diameters most similar to the growth-suppressed trees (Hernández-Trejo Reference HERNÁNDEZ-TREJO2009). Therefore, mangrove forestry should consider the effects of the abiotic environment: shaded trees within the lower canopy of low-salinity mangroves have a higher probability of death. The results of this study illustrate that, in the mangrove environment, self-thinning rules operate as a function of salinity: lower salinity favours increasing size inequality and maximum potential size of trees, whereas higher salinity promotes homogeneity in tree-size classes.
ACKNOWLEDGEMENTS
This work was funded by the CONACYT-SEMARNAT project 2002-CO1-0126 to J. López-Portillo. R. Méndez-Alonzo (RMA) acknowledges the support of the DGAPA-UNAM post-doctoral programme. The research is presented in partial fulfilment of a Ph.D. degree by RMA at the Instituto de Ecología, A.C. The authors acknowledge the comments and suggestions by U. Berger and H. Paz and the help provided in the field during May 2011 by L. Barradas, A. Kollert and V. Vasquez, who also performed the soil core analyses.