Introduction
Several factors influence the male to female birth ratio (number of male births divided by total births, M/T), which invariably exhibits a slight excess of males (James & Grech, Reference James and Grech2017). Mothers who are in poor condition tend to have a reduction in this male excess, and vice versa. This accords with the Trivers–Willard hypothesis, which states that under favourable conditions male offspring will be able to mate with multiple females, whereas an equivalent female is restricted by pregnancy and lactation. On the other hand, under poor conditions, a male fetus may not survive to term, and if he does, a sickly male may not survive infancy and childhood. If he does, a frail male will not be able to compete with more robust males for mating privileges. Evolution should therefore have favoured the ability to influence M/T based on maternal condition around conception and in pregnancy (Trivers & Willard, Reference Trivers and Willard1973).
Many factors have been shown to influence M/T, and some studies have suggested a positive correlation between M/T and education levels (James, Reference James1987). There are few extant large studies that test for possible associations between these two variables. This study assessed the effect of maternal education on M/T in the entire US population and by racial group.
Methods
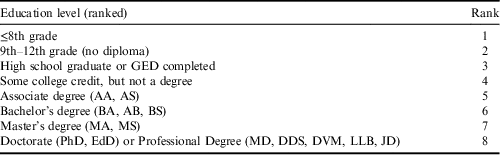
Number of live births by sex of the child and by race and educational level reached by the mother were obtained from the website of the Centres for Disease Control (CDC Wonder; https://wonder.cdc.gov/controller/datarequest/D66) for the period 2007–2015. The educational level of the mother was classified into eight ranks by length of schooling and qualifications achieved (see Table 1).
Ranking of education level reached by women in the US, Centres for Disease Control 2007–2015

GED, General Education Diploma; AA, Associate of Arts; AS, Associate of Science; AB and BA, Bachelor of the Arts; BS, Bachelor of Science; MA, Master of Arts; MS, Master of Science; PhD, Doctor of Philosophy; EdD, Doctor of Education; MD, Doctor of Medicine; DDS, Doctor of Dental Surgery; DVM, Doctor of Veterinary Medicine; LLB, Bachelor of Laws; JD, Doctor of Jurisprudence.
A total of 36,499,163 births were available for analysis in the dataset. Data for 8,230,980 births for which mother’s achieved educational level was stated as ‘excluded’ or ‘unknown/not on certificate’ (22.6% of total births) were excluded from the analysis, leaving a total of 28,268,183 births in the study sample.
Fleiss’ quadratic equations were used to calculate the 95% confidence intervals for M/T ratios (Fleiss, Reference Fleiss1981). Chi-squared tests for trends for annual male and female births were used using the Bio-Med-Stat Excel add-in for contingency tables (Slezák et al., Reference Slezák, Bokes, Námer and Waczulíková2014). Statistical significance was set at p≤0.05.
Results
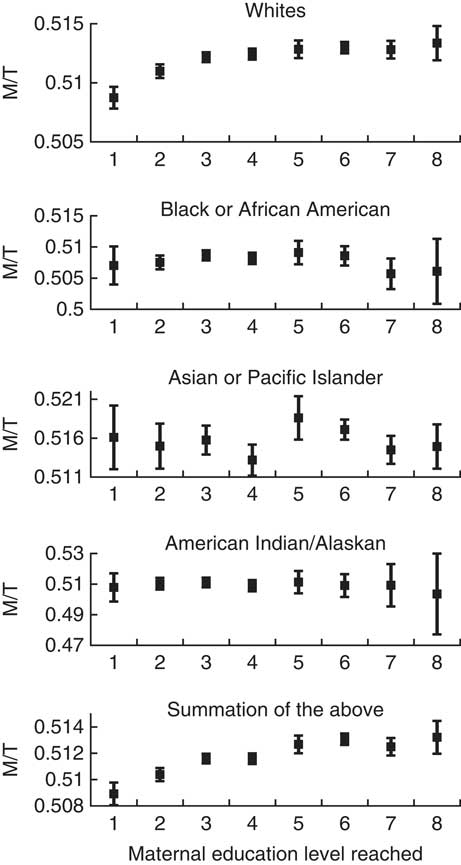
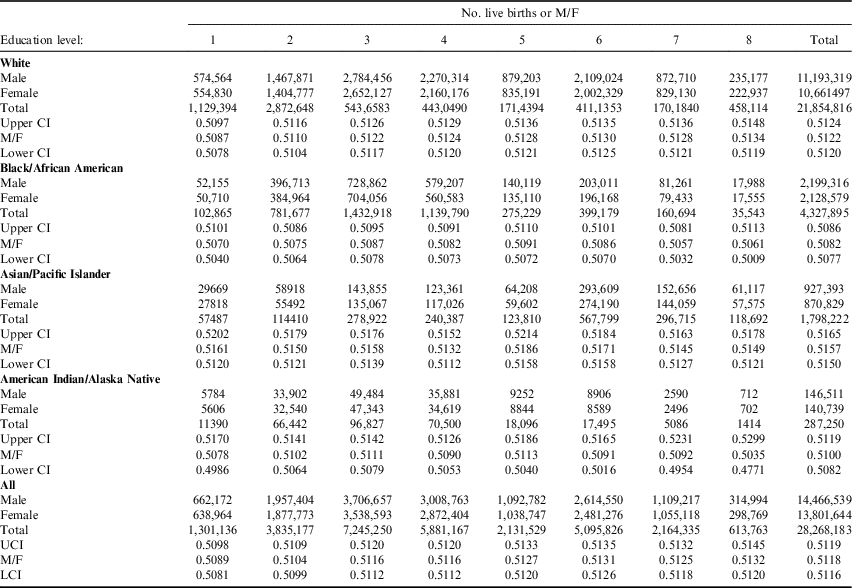
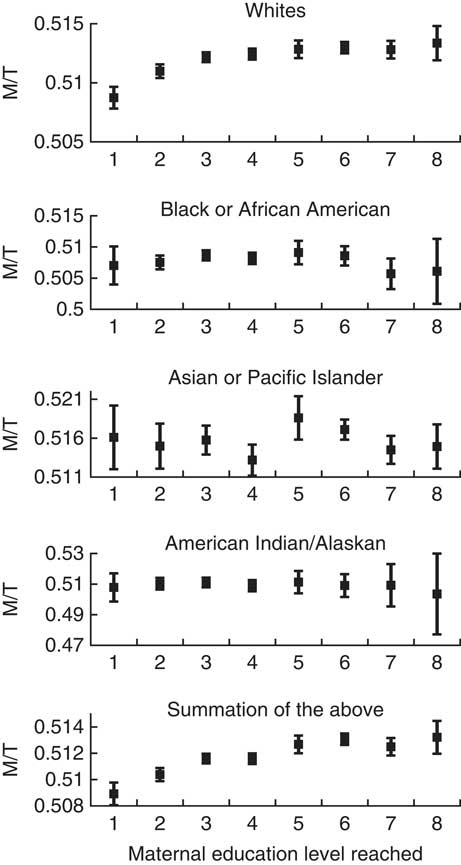
The sample had an overall M/T of 0.5118 (see Table 2). The order of size of M/T by racial group was: Asian/Pacific Islander>White>American Indian/Alaska Native>Black/African American. Overall, for the total sample M/T rose significantly with increasing maternal education level (χ 2=101, p<0.0001; bottom rows of Table 2). Analysis by race showed that M/T rose significantly with increasing maternal education level for White births only (χ 2=59, p<0.0001; Table 2, Fig. 1).
Male, female and total live births by M/T (and 95% CIs) by mother’s educational status and race, 2007–2015. Maternal education level on x-axis is as shown in Table 1.
Number of live births and M/T (and 95% CI) by sex, educational status of mother and race, 2007–2015
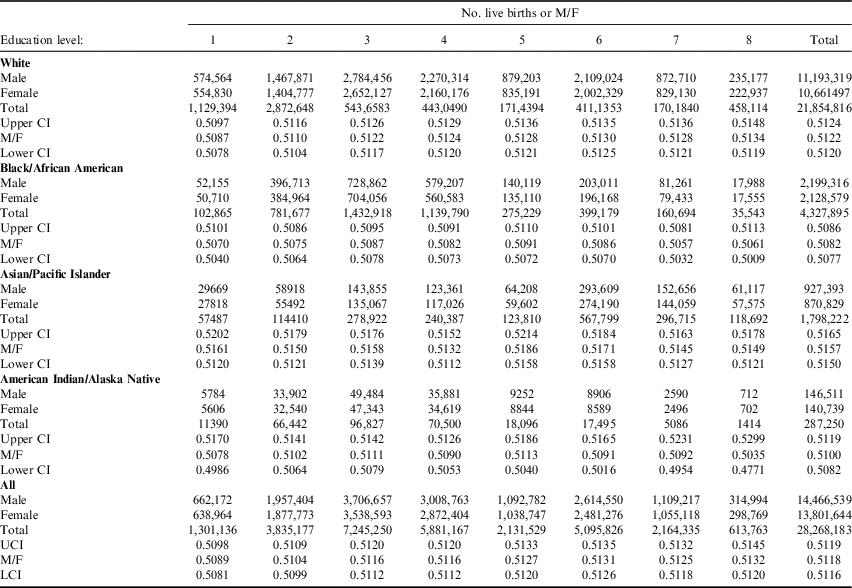
The M/T of Black births rose with increasing education level up to associate degree level (p=ns), then fell significantly with higher education levels (χ 2=4.5, p=0.03). No significant trends were present for Asian/Pacific Islander or American Indian/Alaska Native births.
Discussion
An unavoidable limitation of this study was the lack of availability of individual maternal data, such that logistic regression models could not be employed. For this reason it was not possible to test for the interacting effects of the study variables (Pavic, Reference Pavic2015).
Previous studies have found socioeconomic indicators to be positively correlated with M/T (Winston, Reference Winston1931; Teitelbaum & Mantel, Reference Teitelbaum and Mantel1971). Sewell and Shah (Reference Sewell and Shah1967) showed that higher levels of maternal education were correlated with socioeconomic status, and thus also arguably indirectly associated with M/T, as found in the present study for Whites. Other studies have confirmed this, in that a higher maternal educational status has been found to be associated with an increased M/T, while extreme poverty has been shown to be associated with a decreased M/T (Russell, Reference Russell1936; Chacon‐Puignau & Jaffe, Reference Chacon‐Puignau and Jaffe1996). For example, a study of 48 million births of Caucasian mothers in 1983–2001 by Almond and Edlund (Reference Almond and Edlund2007) found that married, better educated and younger mothers had a higher M/T.
The absence of uniform findings across races in this study may be due to the relatively small number of births in the smaller racial grouping, with consequential loss of statistical power. A possible alternative explanation lies in two other known racial characteristics.
Two particular US races, Blacks and American Indian/Alaska Natives, have been shown to have a persistently depressed M/T, and a novel theory has been proposed which avers that chronic socioeconomic stress in these races may chronically reduce M/T (Grech, Reference Grech2017, Reference Grech2018). The putative innate racial hormonal differences that have been suggested as causing these differences (Ciocco, Reference Ciocco1938; Visaria, Reference Visaria1967) may thus only be the proximate cause of the routinely observed M/T racial disparities in the US, and not the ultimate cause (Grech, Reference Grech2017, Reference Grech2018).
Asian M/T ratios may also be biased since it has been shown that these races continue to practise sex-selective abortion (female feticide) due to male offspring preference, even in the US (Grech, Reference Grech2017).
Overall, these findings confirm that even in recent years, in the US, higher M/T birth ratios are overall positively associated with mothers who have a higher educational achievement – a factor that predisposes them to better socioeconomic status and hence, better ‘condition’, indirectly supporting the Trivers–Willard hypothesis (Trivers & Willard, Reference Trivers and Willard1973).
These findings also accord with studies that continue to indicate that race remains the most significant variable associated with unequal wealth distribution in this country, with entrenched racial inequalities across national social and economic structures (Oliver & Shapiro, Reference Oliver and Shapiro2006). This has also been shown in relation to M/T such that M/T by race in the US is in the order: Asian/Pacific Islander>White>American Indian/Alaska Native>Black/African American (Grech, Reference Grech2017). These inequalities also extend to overall education reached in all women by race. This can be seen in Table 2, which shows that the proportion of Blacks who attain higher education is lower than that of Whites or Asians (Ryan & Bauman, Reference Ryan and Bauman2016). There is clearly more to be done before true racial equality is attained in the US.
Ethical Approval. The author asserts that all procedures contributing to this work comply with the ethical standards of the relevant national and institutional committees on human experimentation and with the Helsinki Declaration of 1975, as revised in 2008.
Conflicts of Interest. The author has no conflicts of interest to declare.
Funding. This research received no specific grant from any funding agency, commercial entity or not-for-profit organization.