The composition of smectites present in bentonite clay deposits depends on the environment of clay formation (e.g. hydrothermal vs. sedimentary) and the type of parent rock (e.g. acidic vs. mafic). Research into such relations has been summarized by Christidis (Reference Christidis2008) and Christidis & Huff (Reference Christidis and Huff2009), and a case study was published by Christidis (Reference Christidis2006).
Variations in the relative proportions of octahedral Al, Fe and Mg determine whether the smectite is predominantly dioctahedral or trioctahedral in character and affect the suitability of bentonite for specific applications. For example, smectites that are rich in Mg and are trioctahedral (full site occupancy) may have some advantages over Al-rich (dioctahedral) smectites in foundry applications because trioctahedral occupancy gives the clay greater thermal stability. Trioctahedral magnesian smectites may also be superior as barrier materials for high-level radioactive waste repositories. This is because Al-rich smectites may convert to trioctahedral smectites at the heater–bentonite interface in large-scale deposition tests (Plötze et al., Reference Plötze, Kahr, Dohrmann and Weber2007; Karnland et al., Reference Karnland, Olsson, Dueck, Birgersson, Nilsson, Hernan-Håkansson, Pedersen, Nilsson, Eriksen and Rosborg2009; Kaufhold et al., Reference Kaufhold, Dohrmann, Sandén, Sellin and Svensson2013, Reference Kaufhold, Dohrmann, Götze and Svensson2017b; Dohrmann & Kaufhold, Reference Dohrmann and Kaufhold2014, Reference Dohrmann and Kaufhold2017; Svensson, Reference Svensson2015).
Magnesian trioctahedral smectites (e.g. saponite) are known to result from cavity mineralization in mafic volcanic rocks (e.g. Lizard Head, Cornwall; www.webminerals.com) and often contain abundant Fe. Although large commercial bentonite deposits generally contain dioctahedral montmorillonite and beidellite, large bentonite mines containing saponite do exist; for example, in the central basin of Spain, within Toledo Province (Vicálvaro deposit, Tolsa – Casal et al., Reference Casal, Merino, Ruiz-Hitzky, Gutierrez and Alvarez1997), as well as in the USA (Ballarat, California – Post, Reference Post1984; Milford, Utah – Cahoon, Reference Cahoon1954; Burro Creek, Arizona – Patterson, Reference Patterson1969).
In Reference Kastritis, Mposkos, Kacandes and Eliopoulos2003, Kastritis et al. published early findings from the Pefkaki and Pilori deposits of palygorskite and smectite in the Ventzia basin, western Macedonia, Greece. The analytical data indicated that both clay minerals are exceptionally rich in octahedral Fe and Mg. In the case of the Ventzia palygorskite, this mixed dioctahedral–trioctahedral character has been investigated thoroughly and quantified by vibrational spectroscopy (Gionis et al., Reference Gionis, Kacandes, Kastritis and Chryssikos2006, Reference Gionis, Kacandes, Kastritis and Chryssikos2007; Chryssikos et al., Reference Chryssikos, Gionis, Kacandes, Stathopoulou, Suárez, García-Romero and Sánchez del Río2009; Stathopoulou et al., Reference Stathopoulou, Suárez, García-Romero, del Río M., Kacandes, Gionis and Chryssikos2011). However, the Ventzia smectite has been studied to a lesser extent so far. In previous work, XRD analysis of smectite-rich samples from the area showed a d 060 reflection near 1.51–1.52 Å and an infrared (IR) signature indicating the presence of Fe(Mg)-rich dioctahedral smectite (Kastritis et al., Reference Kastritis, Mposkos, Kacandes and Eliopoulos2003; Christidis et al., Reference Christidis, Katsiki, Pratikakis and Kacandes2010). However, a study of another smectite sample from the same basin suggested the presence of trioctahedral smectite (i.e. an Fe-rich saponite; Nikolopoulou et al., 2009).
In this work, we attempt a thorough mineralogical study of three additional smectite-rich samples representing the major smectitic horizons of the Pilori and Velanida deposits of the Ventzia basin. Given the chemical and mineralogical complexity of the samples, characterization was particularly challenging and required data obtained via many experimental techniques.
Geology of the clay deposits
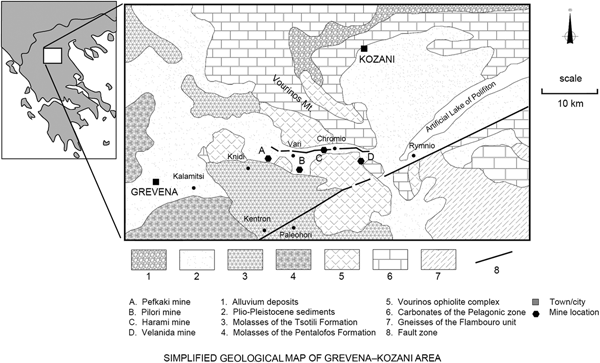
The geological setting of the Ventzia basin in Macedonia, Greece, was previously summarized by Kastritis et al. (Reference Kastritis, Mposkos, Kacandes and Eliopoulos2003). The basin is found northeast of the city of Grevena. It covers an area of ~70 km2 and is elongate with a maximum width of 6 km and a length of 22 km. Within the basin, there is a series of four sub-basins (Fig. 1). During the Plio-Pleistocene, these basins were interconnected as part of a fluvial lake system and were sites of intense tectonically driven clastic sedimentation. The two main sources of the clastic sediments were the ultramafics of the Vourinos ophiolite complex in the north (already partially weathered to smectite-bearing saprolite) and the molassic sediments of the Mesohellenic trench in the south. These were deposited to thicknesses of up to 200 m, and the diagenetic alteration in the lacustrine basin under semitropical Plio-Pleistocene conditions resulted in the formation of thick sequences of palygorskite and smectite clay. Four deposits are presently known and named (from west to east): Pefkaki, Pilori, Harami and Velanida (Fig. 1). The bulk clays in these deposits are ubiquitously rich in Mg and Fe due to the predominance of the ultramafic clastic source. However, the (Mg + Fe)/Al ratios show a progressive decrease in the deposits further from the Vourinos and closer to the molasse clastic source (e.g. Pilori deposit).
Geological and geographical setting of the Ventzia basin and the smectite deposits.

Palygorskite and smectite occur in both relatively pure forms and in mixtures. Thicknesses of smectite-rich beds range from 10 to 50 m, whereas thicknesses of palygorskite-rich beds range from 2 to 6 m, with a maximum thickness of 30 m identified in one deposit (Harami). The smectite generally occurs in the deeper parts and at the periphery of the deposits, whereas the palygorskite occurs at the centre and near the surface. Mixtures of both minerals occur in transitional zones. It was suggested previously that this diagenetic pattern has probably resulted from a transformation of smectite to palygorskite, which was partially controlled by the particle size of the detritus, with the finer detritus being more conducive to palygorskite formation (Kastritis et al., Reference Kastritis, Mposkos, Kacandes and Eliopoulos2003). This pattern is interrupted by gravel and sand beds that were produced by seasonal fluvial processes and the creation of spillways that transferred detritus and pre-existing clays from one sub-basin to the other.
Other minerals commonly present with the aforementioned clays were quartz, serpentine, pyroxene, feldspars, and other remnants. Carbonates were absent from some deposits, but present in the deposits closer to the molasse. Sulfur and chloride mineralization was essentially absent.
Materials and methods
Three representative samples (Supplementary Fig. S1, available online) were taken from the Pilori and Velanida deposits (Fig. 1). Sample B63 represents a very thick (~10 m) layer of smectite-rich clay in the Pilori deposit. Samples B64 and B65 represent the upper and lower smectite-rich layers of the bowl-shaped Velanida deposit, respectively. The two layers are separated by a thick, bowl-shaped palygorskite layer.
The samples were dried at 60°C for 1 week, milled in a hammer mill and studied as bulk powders. Na- and Li-saturated fractions of the bulk fraction were also produced after carbonate removal and repeated washing with NaCl and LiCl, respectively, followed by dialysis. The <2 µm fractions were produced for measuring oriented mounts by XRD and the decarbonated material was used to produce the <0.2 µm fraction, which was prepared to allow the determination of structural formulae. The purity of this material was checked by XRD using randomly oriented mounts in order to be able to apply Rietveld refinement for the quantification of the minor components, which is almost impossible with oriented mounts. All of the samples were treated in the same way.
The chemical composition of bulk powder samples was determined by X-ray fluorescence (XRF) using a PANalytical Axios spectrometer in wavelength-dispersive mode (WD-XRF). The analyses were conducted on fused glass beads prepared with lithium metaborate flux (lithium metaborate Spectroflux No. 100A, Alfa Aesar).
Loss on ignition (LOI) was determined on 1000 mg samples after heating to 1030°C for 10 min (air).
Total carbon (TC) content was measured using a LECO CS-444 analyser on bulk samples (170–180 mg) dried at 105°C. Total organic carbon (TOC) content was determined by IR analysis of the CO2 evolved upon heating the samples to 1800–2000°C in an oxygen atmosphere. In preparation for TOC analysis, any carbonates present were removed by treating the samples several times with HCl at 80°C until no further gas evolution could be observed. Total inorganic carbon was calculated from the difference between TC and TOC.
Mineralogical composition was determined by XRD using a PANalytical X'Pert PRO MPD θ–θ diffractometer (Co-Kα radiation generated at 40 kV and 40 mA) equipped with a variable-divergence slit (20 mm irradiated length), primary and secondary Soller diffracted beam monochromator and a point detector. Air-dried, randomly oriented powder mounts of the bulk and <0.2 µm fraction were prepared using the back-loading technique and investigated from 2° to 90°2θ with a step of 0.03°2θ and a measuring time of 12 s/step. Patterns were refined using the Rietveld code BGMN to obtain quantitative mineralogical data.
The d 00l-oriented clay mounts of the <2 µm fraction (sample density: 15 mg/cm2) were prepared by vacuum filtering 1.5 mL of clay suspension on a porous ceramic tile (2.4 cm diameter × 3 mm thick). The air-dried, oriented mounts were measured from 1° to 40°2θ with a step size of 0.03°2θ and a measuring time of 6 s/step. The samples were also analysed after ethylene glycol solvation (60°C, overnight) to examine the clay's swelling behaviour.
Mid-IR spectra were measured on a Fourier-transform instrument (Equinox 55S, Bruker Optics) equipped with a single-reflection diamond attenuated total reflection (ATR) accessory (DuraSamplIR2 by SENSIR). A few drops of clay (bulk, Li form) in H2O suspension were deposited on the ATR crystal and purge-dried by N2 to produce a thin, oriented film in good contact with the diamond. A homemade environmental cell was employed for this purpose and also for exchanging H2O with D2O in situ as in Bukas et al. (Reference Bukas, Tsampodimou, Gionis and Chryssikos2013). For near-IR (NIR) spectroscopy, a Fourier-transform instrument was employed (Vector 22, Bruker Optics), equipped with an optical fibre bundle probe suitable for the diffuse reflectance measurement of powdered samples. Both ATR and NIR spectra were measured at a resolution of 4 cm–1 (Δν = 2 cm–1) and represent averages of at least 100 scans. Spectra are reported in absorbance (‘ATR-corrected’ for the wavelength dependence of the penetration depth) or as second derivatives, calculated according to the Savitzky–Golay algorithm. All spectra were measured at ambient temperature. Additionally, NIR measurements were performed at variable temperature (30–130°C) by fitting the powder probe to a temperature-controlled stage (Linkam 600).
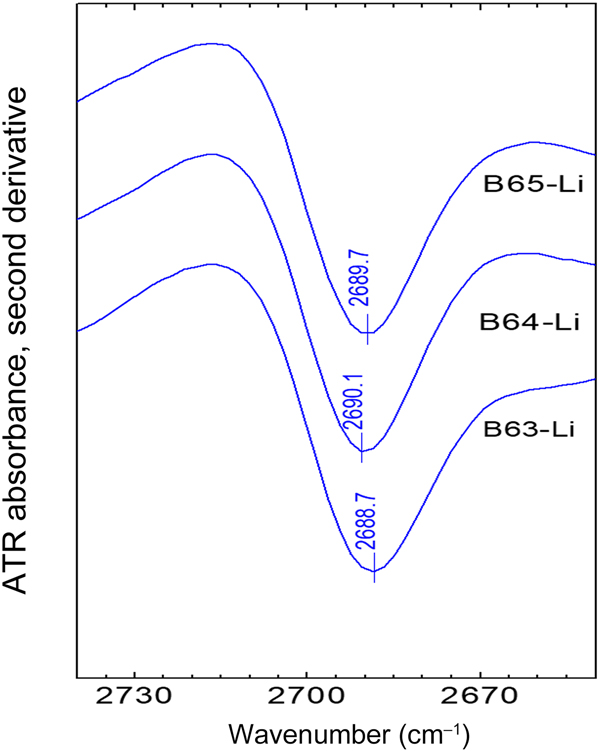
The O-D (oxygen-deuterium) method for determining layer charge density (LCD) (Kuligiewicz et al., Reference Kuligiewicz, Derkowski, Emmerich, Christidis, Tsiantos, Gionis and Chryssikos2015b) was employed. This method requires the interlayer D2O/H2O exchange of the samples in their Li or Na form and involves the precise determination of the position of a sharp, IR-active D2O stretching mode, νO-D in the 2700–2686 cm–1 range by ATR spectroscopy and second derivatives. This band is attributed to ‘dangling’ O-D bonds of D2O pointing away from the interlayer and towards the siloxane surface, the charge density of which determines the energy of their stretching via weak H-bonding interactions (Szczerba et al., Reference Szczerba, Kuligiewicz, Derkowski, Gionis, Chryssikos and Kalinichev2016). The use of the O-D method for determining the LCD of bulk, non-purified bentonite has been demonstrated recently (Tsiantos et al., Reference Tsiantos, Gionis and Chryssikos2018).
Specific surface area was determined by N2 adsorption using a five-point Brunauer–Emmet–Teller (BET) method. Measurements were performed using a Micromeritics Gemini III 2375 surface area analyser with ~300 mg bulk sample mass after degassing for 24 h at 150°C in vacuum.
The cation-exchange capacity (CEC) of the bulk samples was measured using the Cu-triethylenetetramine (Cu-trien) 5×calcite method (Cu5×cc; Dohrmann & Kaufhold, Reference Dohrmann and Kaufhold2009), which is based on Meier & Kahr (Reference Meier and Kahr1999). Exchangeable cations were determined by inductively coupled plasma atomic emission spectroscopy (ICP-AES). Two different sample masses were used. Identical values obtained with two different sample masses indicate that both measurements were in the optimum solid/liquid region.
The structural formulae of the smectites were determined by two different methods. First, the <0.2 µm fraction was separated by centrifugation, investigated by quantitative XRD (Rietveld code BGMN) to correct for minor impurities and finally investigated by XRF to obtain the chemical composition. Alternatively, the bulk samples were Cu-trien saturated, washed, dispersed in water and allowed to settle slowly. After formation of the sediment, the aqueous phase was evaporated and its top was examined by scanning electron microscopy (SEM) and analysed by energy-dispersive X-ray spectroscopy (EDX). The SEM-EDX instrument (ESEM FEI Quanta 600 FEG) is routinely used for automatic mineralogy using ‘mineral liberation analysis’, which is continuously calibrated against various heavy and ore minerals such as chalcopyrite. The Cu data were used to derive the LCD of exchangeable sites. In this manner, no assumption is required regarding the sum of octahedral cations (e.g. 2.0/FU). The resulting LCD values were expected to be intermediate between alkylammonium- and structural formula-derived data (LCDAAM and LCDSFM, respectively) because fixed cations were not exchanged by the Cu-trien, but Cu-trien may have adsorbed to variable charges (Kaufhold et al., Reference Kaufhold, Dohrmann, Stucki and Anastácio2011).
The water uptake capacity of the samples was measured using a modification of the Enslin–Neff principle introduced by Dieng (Reference Dieng2005, Reference Dieng2006) and Kaufhold & Dohrmann (Reference Kaufhold and Dohrmann2008). Briefly, 0.5 g of sample in dry powder form (60°C, 72 h) was weighed and the water uptake was expressed as weight percentage.
The predominant type of layer charge (octahedral vs. tetrahedral) was determined by Li exchange and fixation by heating (Hofmann & Klemen, Reference Hofmann and Klemen1950). For this purpose, 0.5 g of each sample (the Na form of the bulk sample was used because subsequent exchange by Li is easier) was subjected to a 2 M LiCl solution (500 mL), resulting in a 1000-fold excess of Li over Na. After stirring for 24 h and centrifugation, another 500 mL of 2 M LiCl was added and again stirred for 24 h. The samples were centrifuged, dialysed, dried at 60°C and ground using a mortar mill for homogenization (for ~5 min to avoid amorphization). The samples were then heated at 250°C for 4 h and their CEC was determined by the Cu-trien method (Meier & Kahr, Reference Meier and Kahr1999; Kaufhold & Dohrmann, Reference Kaufhold and Dohrmann2003). Alternatively, they were heated at 140°C for 24 h and their layer charge was measured by the O-D method (Kuligiewicz et al., Reference Kuligiewicz, Derkowski, Emmerich, Christidis, Tsiantos, Gionis and Chryssikos2015b). The percentage decrease of CEC or LCD upon Li treatment/heating represents semi-quantitatively the fraction of octahedral charge that is neutralized by Li migration (Hofmann & Klemen, Reference Hofmann and Klemen1950; Kaufhold et al. Reference Kaufhold, Stucki, Finck, Steininger, Zimina, Dohrmann, Ufer, Pentrák and Pentráková2017a, Reference Kaufhold, Kremleva, Krüger, Rösch, Emmerich and Dohrmann2017c). Pure tetrahedrally charged smectites (i.e. beidellite) are not expected to show a reduction of CEC upon Li treatment.
Results
Chemical composition
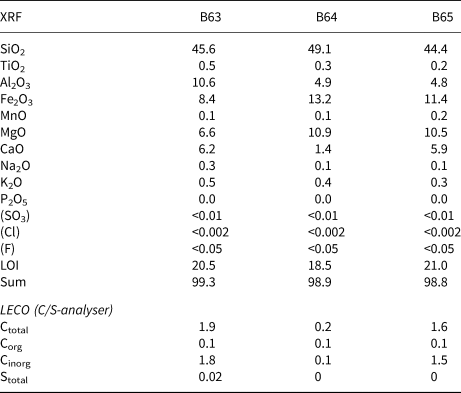
The chemical composition of the raw bulk samples was analysed by both XRF and C/S-analyser (based on IR detection after vaporization). The results are listed in Table 1. The organic carbon content of all samples was ~0.1 mass% and the S content was negligible, pointing towards the absence of pyrite and/or gypsum. Samples B63 and B65 contain carbonates. Based on LECO device data (Table 1), the carbonate content of these samples ranges between 10 and 15 mass% (expressed as CaCO3). The carbonate content of sample B64, on the other hand, is much lower. Based on the C content, ~0.5 mass% carbonates (as CaCO3) was calculated. This value was then compared with the CaO content, which was larger than the amount corresponding to 0.5 mass% Ca carbonate. Excess CaO, therefore, may be present as exchangeable cations and/or in feldspars (or other admixtures). Apart from the different carbonate content, samples B64 and B65 are similar to each other as indicated by their Al/Fe/Mg atom ratios (1.0/1.6/2.7 and 1.0/1.4/2.6, respectively, instead of 1.0/0.5/1.7 for B63). The somewhat larger SiO2 content of B64 points towards a larger quartz content. Sample B63, in contrast to the others, has a larger Al and a lower Mg content.
Bulk chemical composition of the three samples, expressed as mass% oxides (bulk samples).

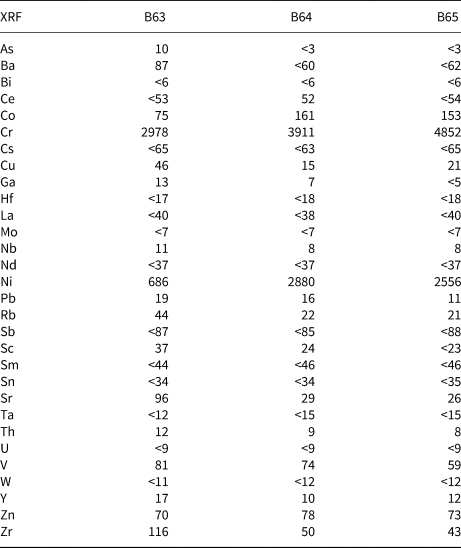
The trace element composition is given in Table 2. Comparably large Cr and Ni contents were observed and attributed to the ultramafic precursor of the clays (sediments from the Vourinos ophiolite complex; Kastritis et al., Reference Kastritis, Mposkos, Kacandes and Eliopoulos2003).
Trace-element composition of the three samples, expressed as mg/kg (bulk samples).

X-ray diffraction
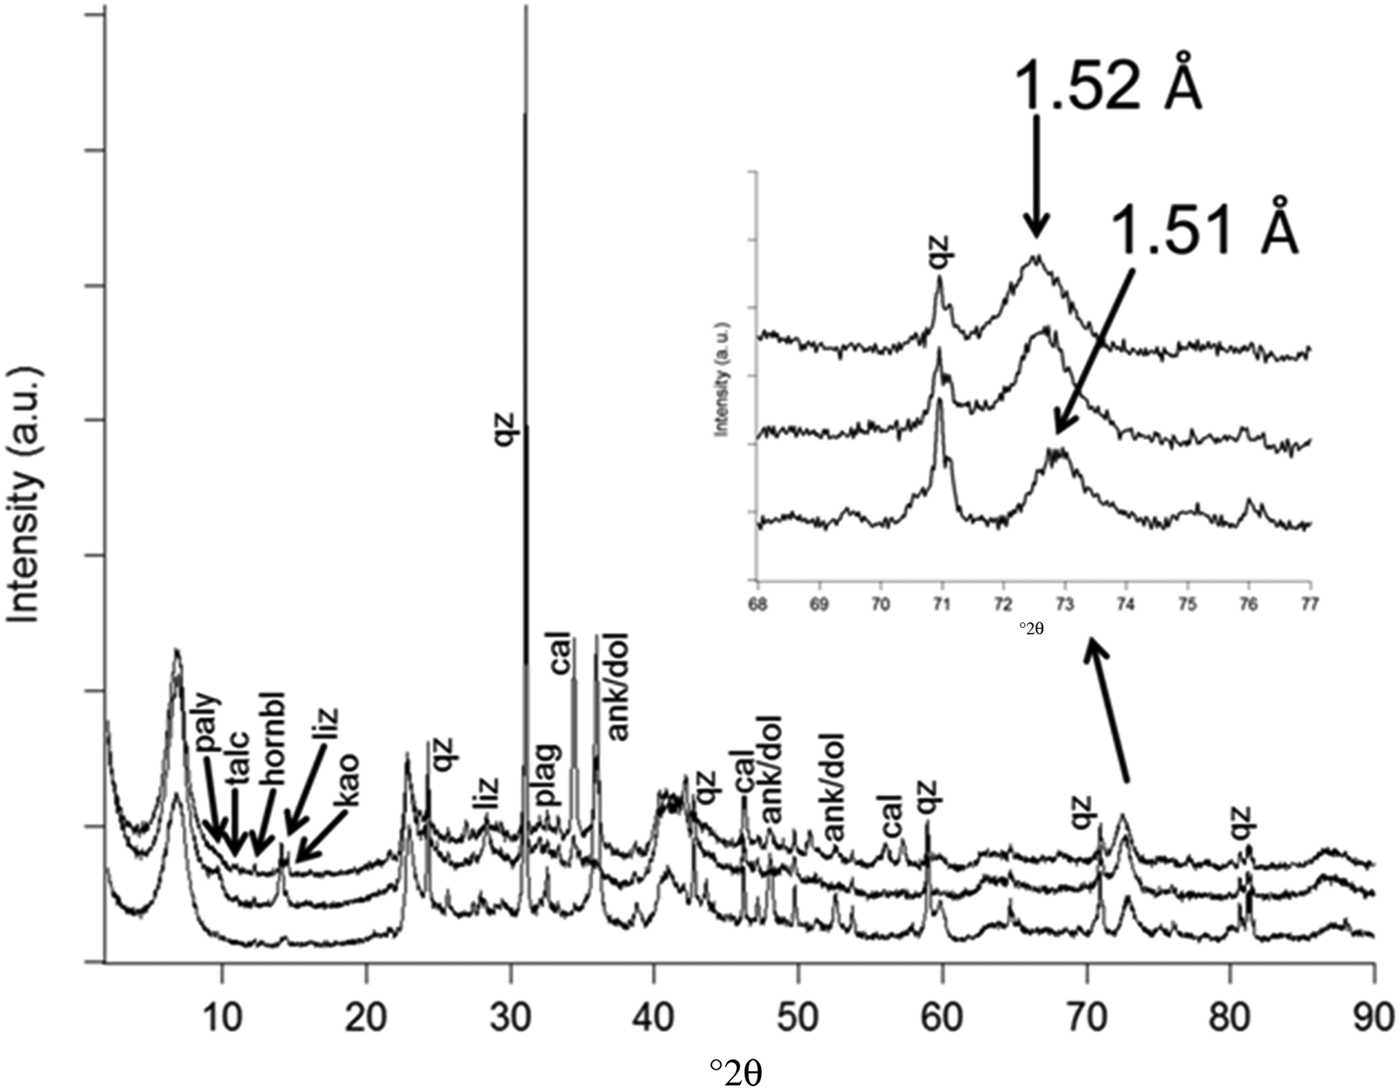
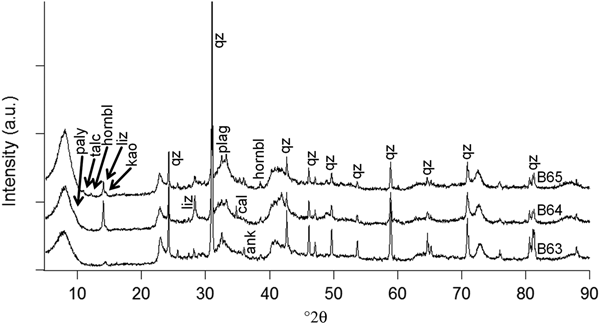
The Rietveld method is applicable for bentonites (Ufer et al., Reference Ufer, Stanjek, Roth, Dohrmann, Kleeberg and Kaufhold2008), but its accuracy depends on how well the phases actually present in the samples are represented by the structural models available. The present samples may contain clay minerals with atypical or variable compositions and structures that are difficult to quantify. For example, no structural model was available for smectite and palygorskite with mixed dioctahedral–trioctahedral character. As a result, the estimates of percentage of smectite and palygorskite in Table 3 should be treated with caution. Powder XRD of the bulk fraction (Fig. 2, Table 3) confirmed the dominance of smectites (~60–65 mass%) in all samples. In addition, hornblende, plagioclase and quartz were detected in all of the samples (Fig. 2). All of the samples showed a weak ~7 Å intensity that could be attributed to kaolinite (mainly in B63, 7.1 Å) and/or a serpentine mineral (in B64 and B65, 7.3 Å). Significant differences were observed with respect to the carbonate nature and abundance in the samples (Rietveld analysis). The highest carbonate content (~15 mass%) was detected in B63 and assigned to ankerite/dolomite (which is difficult to distinguish by XRD). Both ankerite/dolomite and calcite were found in B65. By contrast, the carbonate content of sample B64 was very low (~1 mass% calcite). Significant differences were also observed with respect to the palygorskite content (Table 3). Much less palygorskite was found in the <0.2 µm fraction (Fig. 3, Table 3); other admixtures, such as quartz and feldspar, however, had particle diameters of <0.2 µm and hence were still abundant in the <0.2 µm fraction. Only a few percentage points of ankerite/dolomite persisted after the chemical carbonate removal, and calcite was completely dissolved. A serpentine mineral (probably lizardite based on XRD) was also predominantly in the <0.2 µm fraction. The values are higher than would be explicable by the fine-particle enrichment, but possibly can be explained by the preferred orientation in the fine-fraction XRD measurements. These values therefore have to be treated with caution.
Powder XRD patterns of all three raw bulk samples (Co-Kα radiation; lower pattern = B63; middle pattern = B64; upper pattern = B65).

Powder XRD pattern of the <0.2 µm fractions of the three samples.

Quantitative mineralogical composition as determined by Rietveld refinement (‘0’ = <0.5 but present) (bulk samples and <0.2 µm fraction).

a Approximate values due to the lack of proper reference patterns.
The expected 060 intensity of the trioctahedral minerals at ~1.54 Å (Christidis et al., Reference Christidis, Katsiki, Pratikakis and Kacandes2010; Baron & Petit, Reference Baron and Petit2016) is masked by a quartz reflection. The measured d 060 value varied between 1.51 and 1.52 Å and did not show any peak splitting. These values are in agreement with Kastritis et al. (Reference Kastritis, Mposkos, Kacandes and Eliopoulos2003) and Christidis et al. (Reference Christidis, Katsiki, Pratikakis and Kacandes2010). Such values of d 060 are intermediate between the typical values for dioctahedral (~1.49 Å) and trioctahedral (~1.54 Å) clay minerals and may therefore indicate the presence of a mixture of dioctahedral and trioctahedral components. However, a peak shift from 1.49 to 1.52 Å can also be explained by exclusively dioctahedral structures as a result of increasing Fe content (i.e. from montmorillonite and/or beidellite towards nontronite; Moore & Reynolds, Reference Moore and Reynolds1997; Köster et al., Reference Köster, Ehrlicher, Gilg, Jordan, Murad and Onnich1999). As a result, the measured value of d 060 can be explained either by the presence of nontronite or trioctahedral clay minerals, or both.
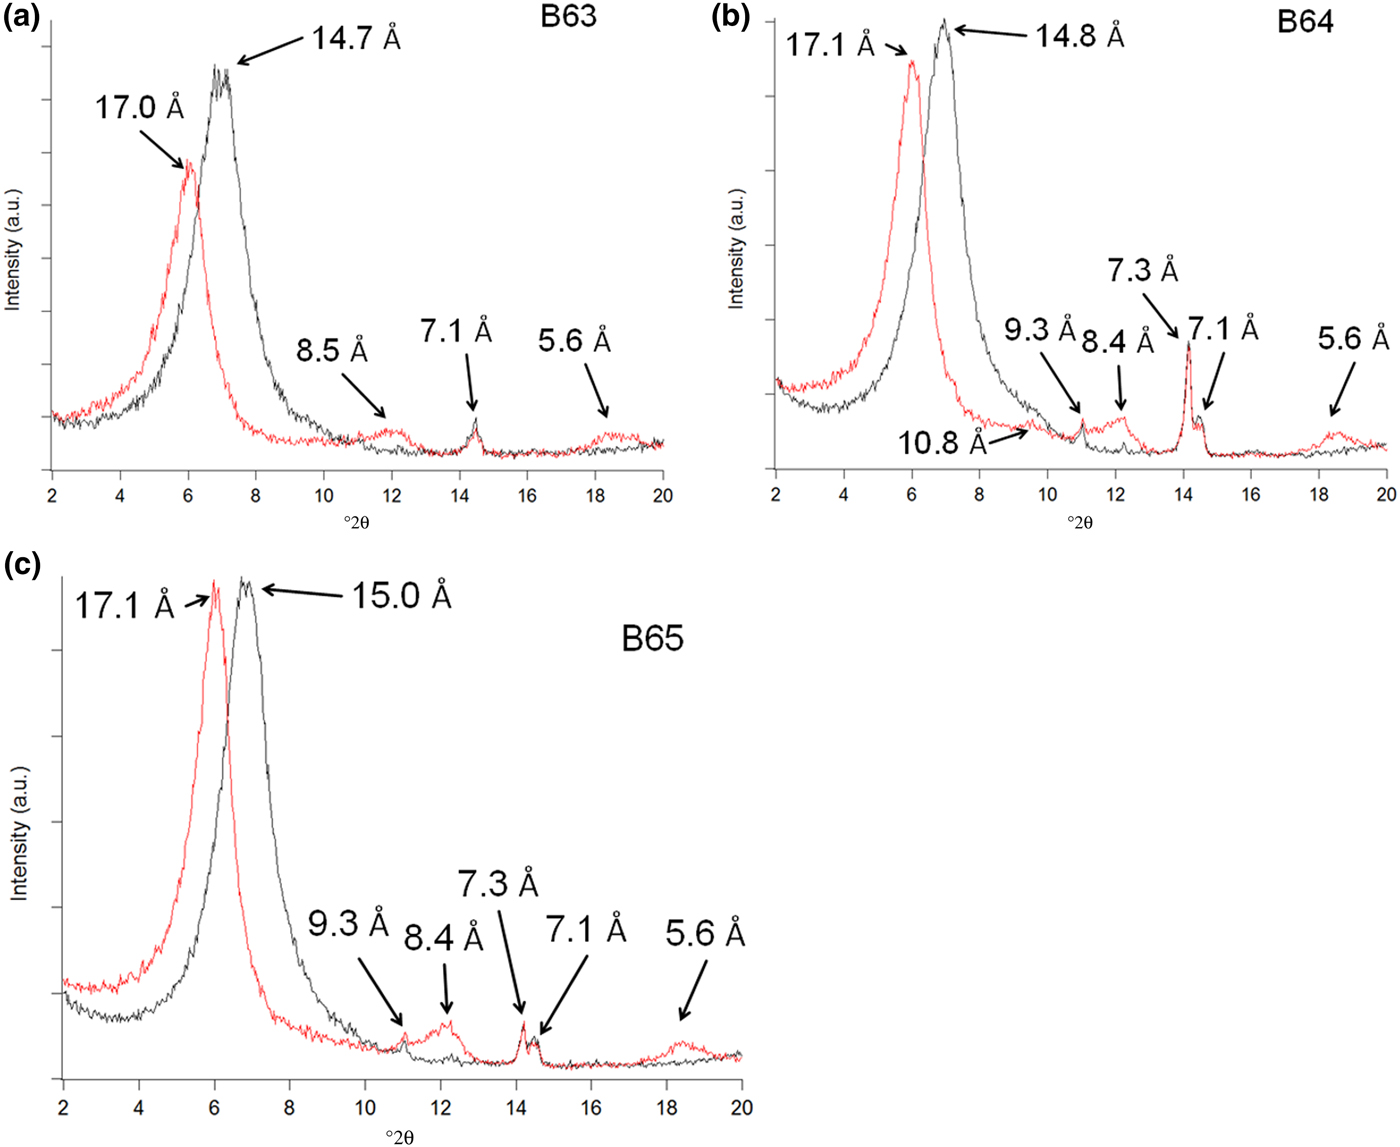
A more detailed analysis is afforded by examining the patterns of oriented and glycolated mounts (<2 µm fraction, natural cation occupation; Fig. 4) (Szczerba & Ufer, Reference Szczerba and Ufer2018). All three samples are dominated by smectite (expansion to ~17 Å with ethylene glycol) and all contain a small amount of hornblende (8.4–8.5 Å). The 7.1 Å reflection of sample B63 is sharp and symmetric and hence is tentatively assigned to kaolinite. The shoulder at ~10 Å became a clear peak with a maximum at 10.8 Å after solvation with ethylene glycol and hence points towards the presence of palygorskite. No indication for the presence of illite was found. Samples B64 and B65 showed two sharp peaks at ~7 Å, which point towards the presence of both kaolinite and a serpentine mineral (e.g. lizardite at ~7.3 Å). The same samples also showed a peak at 9.3 Å that does not change upon solvation with ethylene glycol and hence can be assigned to talc. In addition, sample B64 was found to exhibit a ~14 Å shoulder upon solvation that can be attributed to a trace of chlorite or vermiculite.
XRD patterns based on oriented mounts of the three samples (B63 (a): smectite, kaolinite; B64 (b): smectite, chlorite (?), palygorskite, talc, lizardite, kaolinite; B65 (c): smectite, talc, lizardite, kaolinite). Black: air-dried; red: ethylene glycol.

Infrared spectroscopy
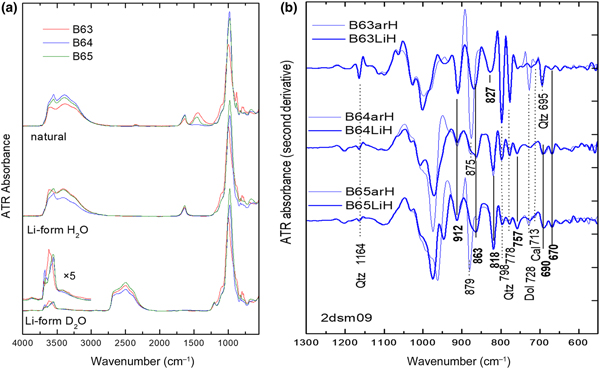
The presence and type of carbonates are evident in the ATR spectra of the bulk samples via the characteristic ν3 envelope at 1500–1400 cm–1 and the sharp ν2 and ν4 modes at 890–870 and 730–715 cm–1, respectively (Fig. 5a). The latter bands are best observed in the second-derivative spectra (Fig. 5b).
(a) ATR spectra of all bulk samples in natural and Li-saturated state, as well as after D2O/H2O exchange. (b) Spectral detail of the second-derivative ATR spectra of the samples in natural (thin lines) and Li forms (thick lines), the latter after carbonate removal.

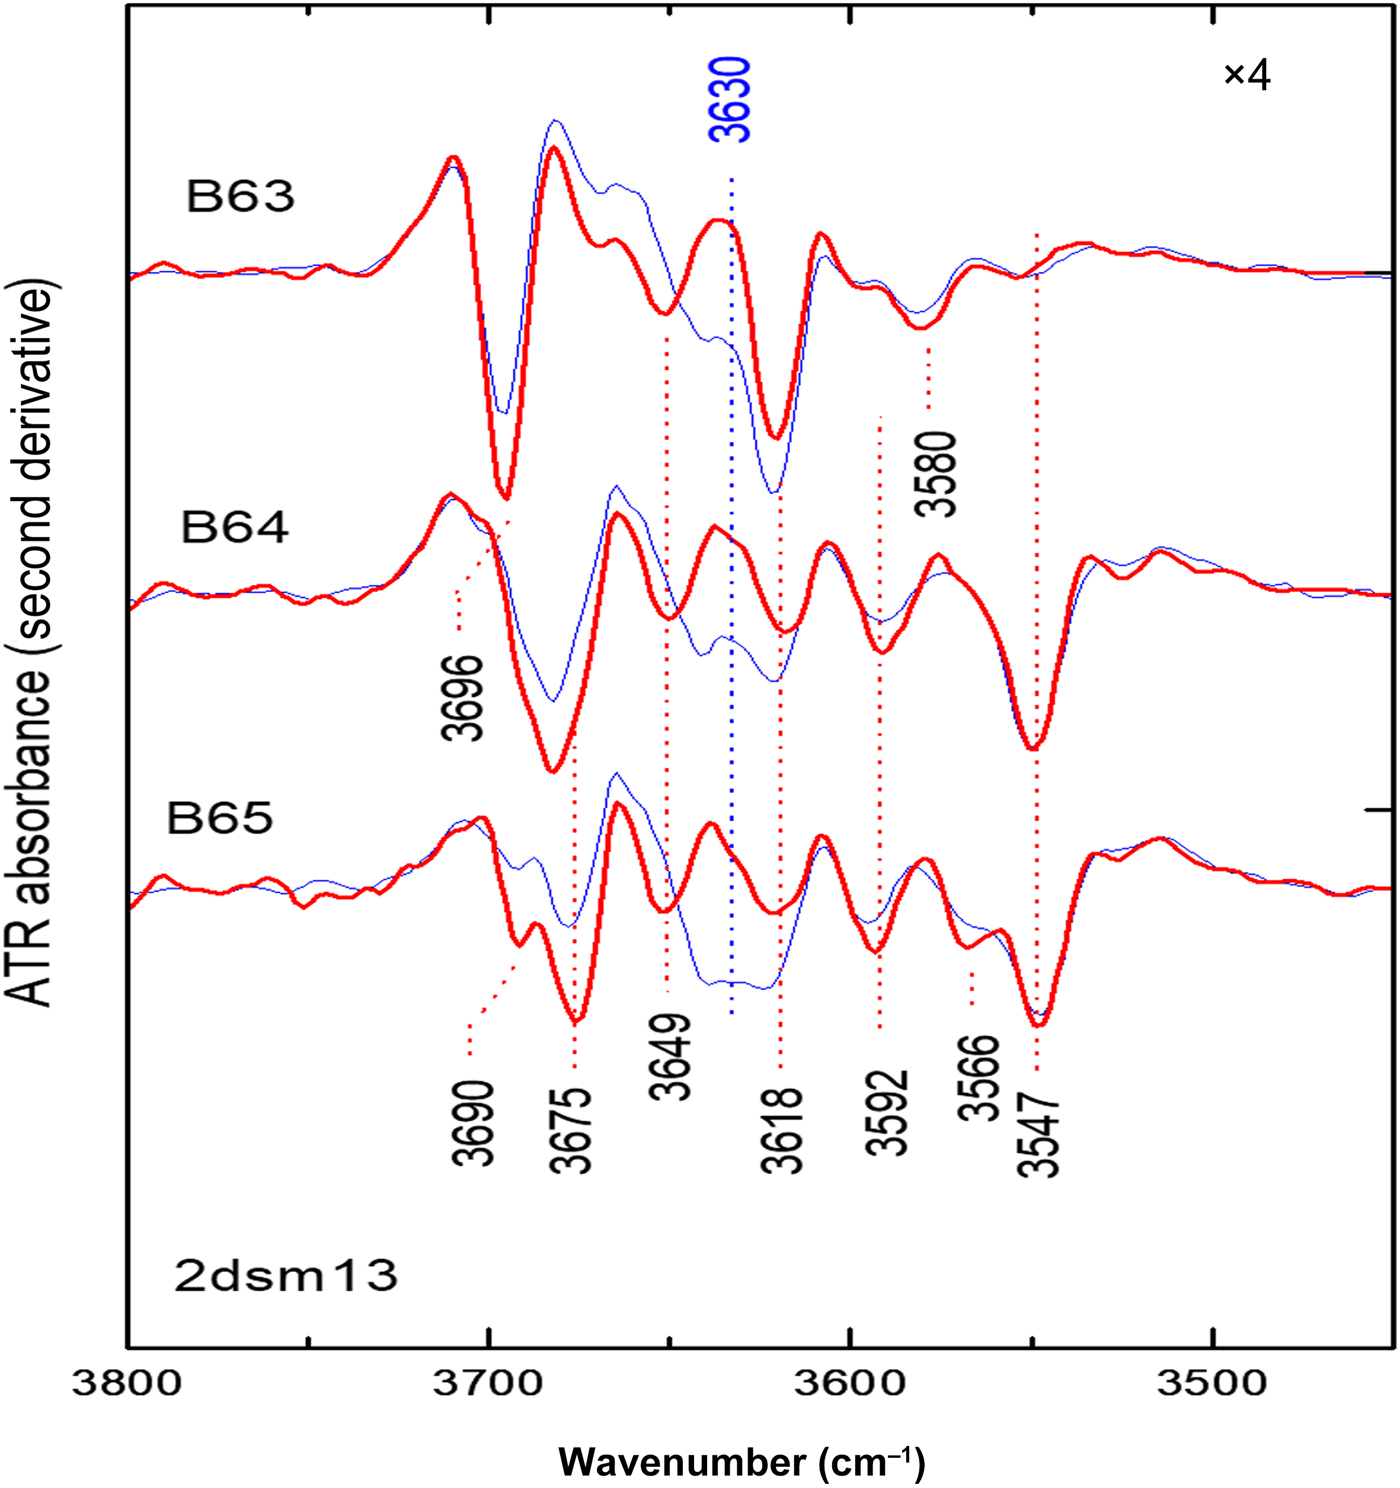
Based on the exact position and intensity of these modes, abundant dolomite/ankerite is detected in B63 (875, 728 cm–1) and mixed dolomite/calcite is present in B65 (additional ν4 band at 713 cm–1), whereas B64 contains only trace carbonate. All of the carbonate bands vanish upon sample purification prior to cation exchange and are not observed in the respective Li forms (Fig. 5). In addition, quartz is detected by a number of diagnostic sharp derivative minima at 1164, 798, 778 and 695 cm–1. Based on the intensity of this signature (which persists quantitatively in the spectra of the purified Li forms), the quartz content is greatest in B63 and considerably lower in B64 and B65, in agreement with XRD (Table 3). The removal of carbonates in the purified samples facilitates comparisons in the diagnostic 950–650 cm–1 range of structural O–H bending modes (δΟΗs). Samples B64 and B65 are similar to each other with sharp bands at 912 and 818 cm–1, a broader band at 863 cm–1 with a shoulder at ~875 cm–1 and a number of weaker features at 757, 690 and 670 cm–1 (Fig. 5). Sample B63 exhibits a different relative intensity of the 912 and ~865 cm–1 bands. The strong signature of quartz in this sample may result in a positive bias in the position of the band observed at 827 cm–1 and masks the spectrum in the vicinity of 700 cm–1. These δΟΗs spectra should be analysed in parallel with the corresponding O–H stretching modes (Fig. 6), especially after D2O exchange to remove the sharp νO–Hw stretching contribution of interlayer H2O in smectite at ~3630 cm–1 (Kuligiewicz et al., Reference Kuligiewicz, Derkowski, Sczerba, Gionis and Chryssikos2015a) and possibly the tunnel H2O of palygorskite (Bukas et al., Reference Bukas, Tsampodimou, Gionis and Chryssikos2013).
Detail of the second-derivative ATR spectra of the Li forms equilibrated by H2O (thin blue lines) and D2O (thick red lines). Note the effect of D2O exchange in removing a H2O stretching feature at ~3630 cm–1.

Dioctahedral hydrous phyllosilicates exhibit δΟΗs modes in the 950–750 cm–1 range, depending on octahedral arrangement: AlAlOH at ~935–910 cm–1, AlFeIIIOH at ~890–870 cm–1, AlMgOH at ~870–830 cm–1, FeIIIFeIIIOH at ~845–815 cm–1 and FeMgOH at ~800–750 cm–1 (e.g. Madejová et al., Reference Madejová, Keckes, Palkova and Komadel2002; Gates, Reference Gates and Kloprogge2005, Reference Gates2008). The corresponding νΟΗs modes are more difficult to distinguish, but occur in the 3650–3540 cm–1 range, with the exception of pyrophyllite- and kaolinite-type materials, which exhibit sharp peaks in the vicinity of 3675–3700 cm–1 (e.g. Zviagina et al., Reference Zviagina, McCarty, Środón and Drits2004). In trioctahedral magnesian phyllosilicates, the δΟΗs modes are observed at lower frequencies than their dioctahedral counterparts (700–650 cm–1) and the νΟΗs modes are observed at higher frequencies, such as Mg3OH at ~3680–3670 cm–1 (e.g. Russell & Fraser, Reference Russell, Fraser and Wilson1994). Due to the chemical and mineralogical complexity of the samples, a detailed assignment of the observed IR bands will be attempted after the presentation of the NIR spectra (Figs 7, 8).
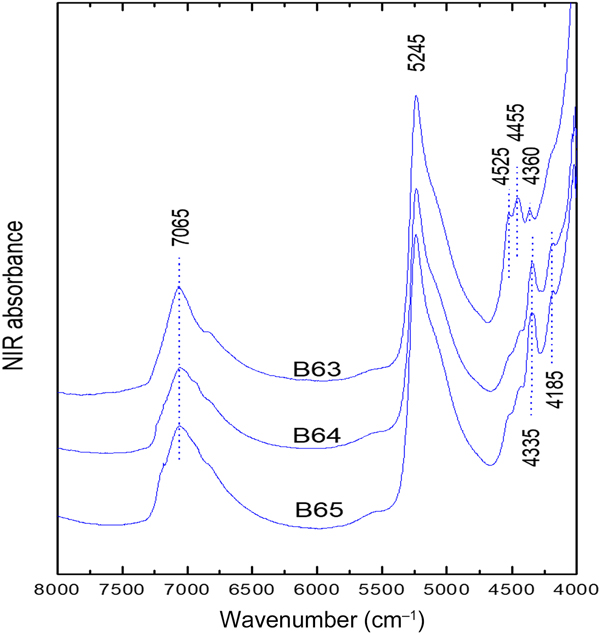
Overview of the NIR spectra of the natural samples B63–B65. The positions of the main bands are approximate.

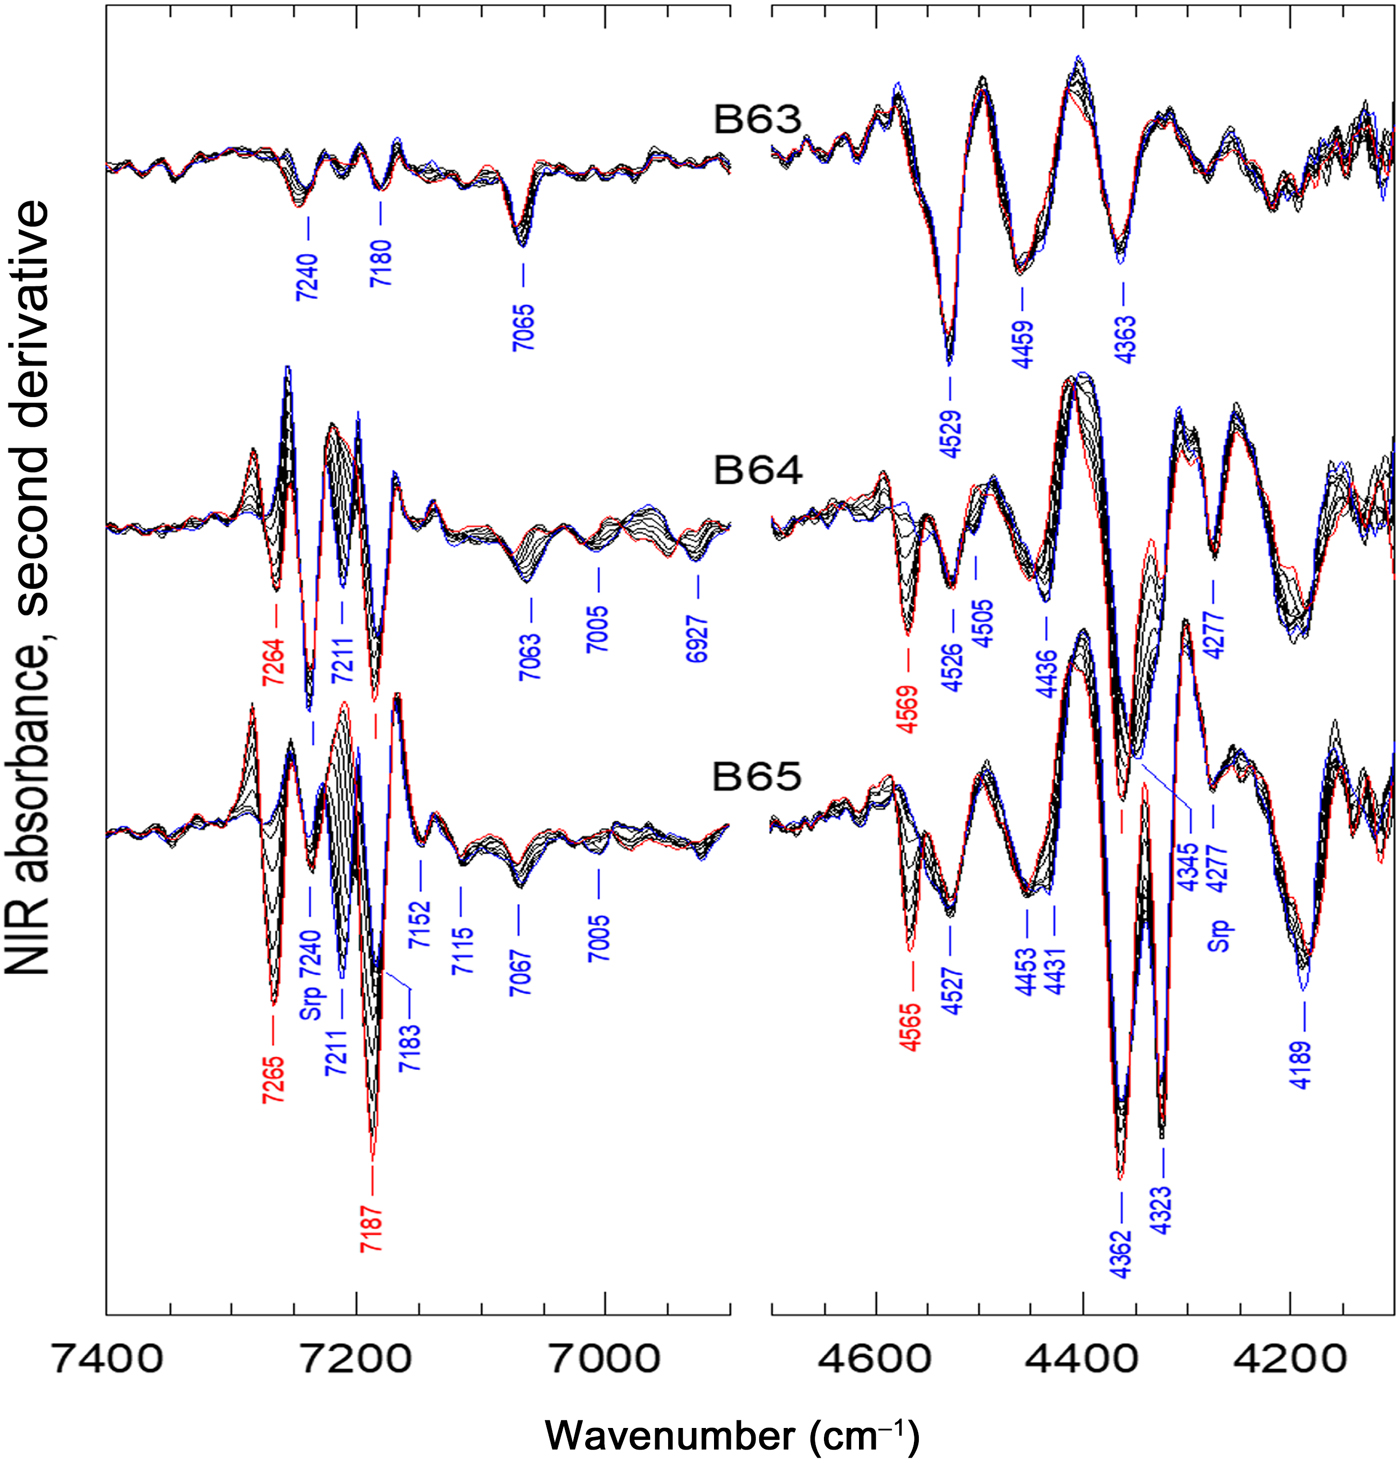
Details of the second-derivative NIR spectra upon heating from 30°C to 130°C (red lines) every 10°C.

The sharp 7240 and 4277 cm–1 bands observed in the NIR spectra of B64 and B65 (intensity trend: B64 > B65 >> B63; Fig. 8) are clearly due to the serpentine (lizardite) that is commonly found in the Ventzia deposits and has been reported previously by Gionis et al. (Reference Gionis, Kacandes, Kastritis and Chryssikos2007). These are the strongest bands of this mineral, belonging to the 2ν and ν + δ Μg3OH ranges of this 1:1 phyllosilicate. The sharpest ν and δ fundamental modes of this mineral were observed at 3684 cm–1 and 625, 605 cm–1, respectively (for detailed assignments, see Baron & Petit, Reference Baron and Petit2016). Only the ν mode was evident in the ATR spectrum of B64 (Fig. 5). Instead of the serpentine present in B64 and B65, kaolinite is clearly observed in B63 by its sharp ν, ν + δ and 2ν components at 3696, 3621, 4527 and 7065 cm–1. In fact, the full second-derivative ATR signature of sample B63 above 3600 cm–1 is essentially due to kaolinite (e.g. Madejová & Komadel, Reference Madejová and Komadel2001). In the presence of serpentine, the presence of kaolinite in samples B64 and B65 is less certain, but is suggested by the shoulder at ~3690 cm–1 (Fig. 7). Samples B64 and B65 undergo very significant changes in their 2ν and ν + δ NIR spectra upon drying (<130°C; Fig. 8). These changes involve the growth of sharp bands at ~7265 and 4565 cm–1, the disappearance of the 7211 cm–1 band, the appearance of enhanced intensity at 7187 cm–1 (i.e. in addition to that of a band at 7183 cm–1) and several other minor band shifts. This is the typical signature of clay minerals such as palygorskite/sepiolite that distinguishes them from the other common non-modulated phyllosilicates (Gionis et al., Reference Gionis, Kacandes, Kastritis and Chryssikos2006; Stathopoulou et al., Reference Stathopoulou, Suárez, García-Romero, del Río M., Kacandes, Gionis and Chryssikos2011; Bukas et al., Reference Bukas, Tsampodimou, Gionis and Chryssikos2013; Tsampodimou et al., Reference Tsampodimou, Bukas, Stathopoulou, Gionis and Chryssikos2015). The ~7265 and 4565 cm–1 bands appearing upon drying are assigned to the 2ν, ν + δ modes of the abundant silanol (SiOH) termination groups that decorate the outer surface of the laths. The 7211 cm–1 band, switching to 7187 cm–1 upon drying, is the clear signature of a fully trioctahedral palygorskite, Mg5Si8O20(OH)2, or sepiolite, Mg8Si12O30(OH)4. The two minerals have similar compositions and structures (they differ only in the periodicity of their layer modulation) and cannot be distinguished by chemical analysis or vibrational spectroscopy (Stathopoulou et al., Reference Stathopoulou, Suárez, García-Romero, del Río M., Kacandes, Gionis and Chryssikos2011). Palygorskite of the Ventzia basin is known to exhibit high FeIII for Al octahedral substitution and a variable trioctahedral character, expressed by the following chemical formula:
 $$\eqalign{&y{\rm M}{\rm g}_5{\rm S}{\rm i}_8{\rm O}_{20}\lpar {{\rm OH}} \rpar_2 \cr &\quad \cdot \lpar {1{\rm} - y} \rpar [{x{\rm M}{\rm g}_2{\rm F}{\rm e}_2 \cdot \lpar {1{\rm} - x} \rpar {\rm M}{\rm g}_2{\rm A}{\rm l}_2}] {\rm S}{\rm i}_8{\rm O}_{20}\lpar {{\rm OH}} \rpar_2,}$$
with 0 < y < 0.5 and 0.4 < x < 0.7 (Chryssikos et al., Reference Chryssikos, Gionis, Kacandes, Stathopoulou, Suárez, García-Romero and Sánchez del Río2009). The presence of a weak dioctahedral palygorskite component is evident in sample B64 (and to a lesser extent in sample B65) by the broad 2ν bands at 7063, 7005 and 6927 cm–1 (AlAlOH, AlFeIIIOH and FeIIIFeIIIOH, respectively) and the sharper ν + δ combination modes at 4505, 4436 and 4345 cm–1, blue-shifting by 10–20 cm–1 upon drying (Gionis et al., Reference Gionis, Kacandes, Kastritis and Chryssikos2006, 2007; Stathopoulou et al., Reference Stathopoulou, Suárez, García-Romero, del Río M., Kacandes, Gionis and Chryssikos2011). Gionis et al. (Reference Gionis, Kacandes, Kastritis and Chryssikos2007) have developed a NIR spectroscopic tool for quantifying the total palygorskite content (sum of dioctahedral and trioctahedral components) of the Ventzia clays on the basis of band intensities calibrated against XRD data. According to their analysis, the palygorskite content in samples B64 and B65 is ~10 mass%. In both samples, palygorskite exhibits an FeIII-rich dioctahedral component and an exceptionally strong trioctahedral fraction (y > 0.5 in B65). By contrast to samples B64 and B65, the NIR spectrum of sample B63 shows neither band shifts nor an evolution of SiOH modes upon drying. Hence, sample B63 contains no detectable palygorskite.
Besides serpentine and (trioctahedral-rich) palygorskite, the NIR spectra of samples B64 and B65 exhibit the signature of additional trioctahedral species with a NIR band at 7184 cm–1, followed by weaker features at 7153 and 7115 cm–1. The 7184 cm–1 band is assigned to the 2ν Mg3OH mode of a trioctahedral clay component and, as such, must be related to the sharp ν + δ combination bands at 4323 and ~4190 cm–1 (Fig. 8). The corresponding fundamental stretching modes at 3683 cm–1 (B64) or 3675 cm–1 (B65) are not fully diagnostic because they overlap with the aforementioned 3684 cm–1 ν Mg3OH mode of serpentine (Fig. 6). The bending modes are observed weakly at ~690 and 670 cm–1 (Fig. 5). The assignment of these bands to a specific trioctahedral mineral in B64 and B65 is not straightforward. Based on the positions of the main sharp bands, talc (Wilkins & Ito, Reference Wilkins and Ito1967; Petit et al., Reference Petit, Martin, Wiewora, de Parseval and Decarreau2004; Zhang et al., Reference Zhang, Redfern, Salje, Carpenter and Wang2010), chlorite (Ferrage et al., Reference Ferrage, Martin, Micoud, Petit, de Parseval, Beziat and Ferret2003) or trioctahedral smectite, such as saponite (Cuevas et al., Reference Cuevas, De la Villa, Ramirez, Petit, Meunier and Leguey2003; Pelletier et al., Reference Pelletier, Michot, Humbert, Barrès, D'Espinose de la Caillerie and Robert2003) or hectorite (Madejová & Komadel, Reference Madejová and Komadel2001) are possible candidates. Among these possibilities, we note that the bands of the trioctahedral components in B64 and B65 are as sharp and as well defined as those of the talc that was observed in B64 and B65 by XRD (Fig. 4, Table 3). The NIR spectra (Fig. 8) provided further evidence for significant FeII for Mg octahedral substitution in talc, based on the intensity of the 7153 and 7115 cm–1 trioctahedral substitution bands (2ν Mg2FeIIOH and MgFeII2OH, respectively; Petit et al., Reference Petit, Martin, Wiewora, de Parseval and Decarreau2004).
Following the assignment of the trioctahedral component in B64 and B65 to serpentine, trioctahedral-rich palygorskite and talc, all unassigned ATR and NIR bands constitute a dioctahedral triplet signature at ν = 3618, 3592 and 3550 cm–1 (Fig. 6), δ = 912, ~865 and 818 cm–1 (Fig. 5b) and ν + δ = 4527, ~4455 and 4363 cm–1 (Figs 7, 8) that is common to all three samples. Despite interference with kaolinite, talc or palygorskite, this signature is safely assigned to the AlAlOH, AlFeIIIOH and FeIIIFeIIIOH fundamental and combination modes of a ferruginous smectite or nontronite (e.g. Post & Noble, Reference Post and Noble1993; Madejová et al., Reference Madejová, Komadel and Cicel1994; Bishop et al., Reference Bishop, Madejová, Komadel and Fröschl2002; Petit et al., Reference Petit, Caillaud, Righi, Madejová, Elsass and Köster2002, Reference Petit, Decarreau, Gates, Andrieux and Grauby2015; Gates, Reference Gates and Kloprogge2005, Reference Gates2008).
Cation-exchange capacity, specific surface area and water-uptake capacity
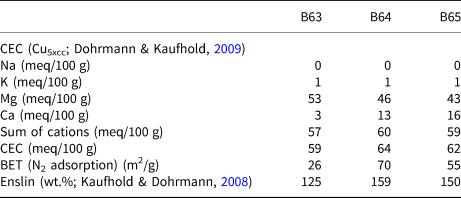
The interlayers of the smectites from all of the samples was dominated by Mg2+, with exchangeable Ca2+ making up only a third to a tenth of the interlayer cations (Table 4). None of the samples contained any detectable exchangeable Na+, and exchangeable K+ was also negligible (Table 4). Dissolution of carbonates is not supposed to affect the data because the Cu5×cc method introduced by Dohrmann & Kaufhold (Reference Dohrmann and Kaufhold2009) was used. No differences were observed for two different sample masses. Therefore, the sum of exchangeable cations should be equal to or be only slightly greater than the CEC. The sum of the exchangeable cations was slightly lower than the CEC. This discrepancy could be explained by the presence of exchangeable cations that were not measured (e.g. Fe3+, Al3+, H+, etc.) or, more likely, by the unsystematic scatter of the method used. The error (±3σ) of the values determined using the Cu5×cc method for bentonites (Dohrmann & Kaufhold, Reference Dohrmann and Kaufhold2009) was lowest for K+ (±0.3 meq/100 g), followed by Mg2+ (±0.8 meq/100 g), Ca2+ (±0.8 meq/100 g), Na+ (±1.9 meq/100 g) and the CEC (±3.1 meq/100 g). The bulk CEC scales with the smectite content of the bulk sample determined by Rietveld analysis (Table 3) suggesting that the smectite in all three samples has a uniform CEC of ~100 meq/100 g. The specific surface areas (BET, ~25–70 m2/g) and Enslin–Neff water-uptake capacities (~125–160 mass%) of the bulk samples were also measured (Table 4).
CEC, exchangeable cations, specific surface area (BET), pH and Enslin–Neff water-uptake capacity (bulk samples).

Determination of structural formulae
The structural formula is commonly determined based on the chemical composition of the pure smectite that is either produced by size fractionation (<0.2 µm fraction) or measured by electron microbeam techniques. Both methods were applied in the present study. The XRD traces of the <0.2 µm fraction (Fig. 3) proved that this fraction was not pure smectite. The <0.2 µm fraction of sample B63 contained quartz, feldspar, kaolinite and hornblende. In addition, serpentine was found in sample B65 and palygorskite in sample B64. Correction of the chemical data for the aforementioned non-smectite minerals, as determined by Rietveld analysis, was performed prior to the determination of the structural formulae given in Table 5.
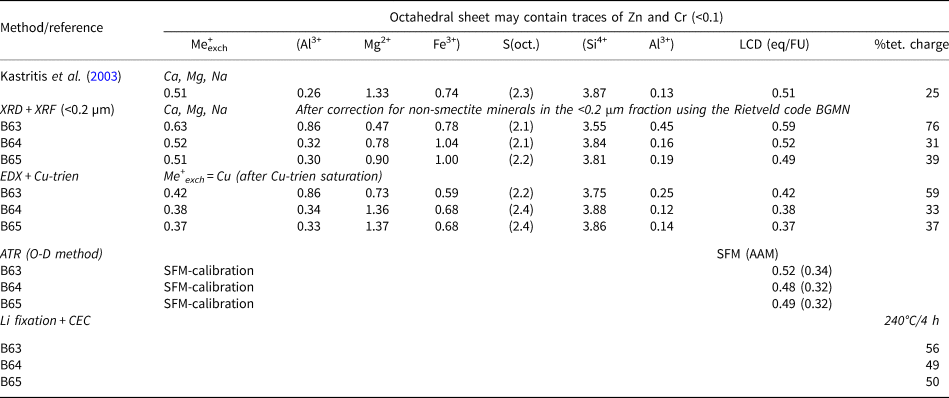
Comparison of the structural formulae and layer charge-related information derived from various methods. %tet. charge = percentage of tetrahedral charge.

Alternatively, structural formulae were also determined by SEM-EDX spot measurements using Cu-trien-saturated samples. All exchangeable sites in smectite were assumed to be fully exchanged by Cu-trien. Any residual Na+ or Ca2+ was assumed to be either fixed in the smectite or in a separate phase. Hence, the Cu content could be used to estimate the number of exchange sites. Despite washing, some NaCl and possibly some KCl are indicated by EDX (Supplementary Fig. S2), but these were not considered for the calculation of the structural formulae. Some of the measured spots contained Ca in amounts that correlated qualitatively with the presence of carbonates. A quantitative measurement of carbonate content was not attempted due to the possible interference from carbon in the sample holder. Ideally, the as-determined spot compositions are attributed to the smectite. It is assumed that other clay minerals, such as kaolinite and palygorskite, could be distinguished from smectites in SEM by their platy or lath-like appearance and so can be avoided. The presence of illite/smectite would have been more problematic because of their similar appearance in SEM, but illite/smectite minerals were not detected by XRD. Finely grained talc and serpentine, on the other hand, would be difficult to identify when intimately intergrown with smectite. This would increase the MgO content. However, only smectitic particles could be identified in the SEM images (Supplementary Fig. S2), but the possibility of an effect of finely grained talc and/or serpentine cannot be excluded. Data from several spots per sample were analysed by EDX and averaged (Supplementary Fig. S2). The ratios of the structural cations were used to calculate the structural formulae that are given in Table 5.
Discussion
Mineralogical composition, specific surface area, CEC and water uptake
The mineralogical composition was determined by both XRD and vibrational spectroscopy. The two techniques provided complementary and mostly consistent qualitative information regarding the presence of several clay minerals in the samples. Among these minerals, smectite dominates the XRD data, whereas kaolinite, serpentine (lizardite), talc and trioctahedral-rich palygorskite are very prominent in the IR spectra due to their narrow bandshapes and/or characteristic dependence on drying.
Quantitative aspects are rigorously provided by XRD and Rietveld analysis (Table 3). These values, however, have to be treated with caution due to the absence of suitable structural models (particularly for mixed di- and tri-smectites) and a possible effect of preferred orientation (e.g. of serpentine, which probably resulted in the high lizardite content of the <0.2 µm fraction). Supporting quantitative data may be obtained from IR spectra on the basis of band intensities. Quantitative analysis of palygorskite may be conducted more rigorously using NIR spectroscopy than XRD (~10 mass% in both samples B64 and B65 vs. 17 and 9 mass% by XRD, respectively) because a dedicated NIR calibration study is available for palygorskite from the same deposit (Gionis et al., Reference Gionis, Kacandes, Kastritis and Chryssikos2007). Semi-quantitative estimates might also be obtained for talc or serpentine in samples B64 and B65 by comparing the observed intensity of their sharp 2ν Mg3OH NIR bands (amplitude of the second derivative) to those of pure minerals measured under the same experimental conditions. Thus, NIR spectroscopy would identify some 5–7 mass% of talc (compared to 3–4 mass% by XRD; Table 3) in samples B64 and B65, or 5–10 mass% of serpentine (compared to 1–2 mass% by XRD).
The complementarity of XRD and vibrational data is best demonstrated when discussing the chemical composition of the various clay minerals present in the samples. For example, vibrational spectroscopy provided evidence for the presence of ferruginous smectite or nontronite based on the identification of the full set of AlAlOH, AlFeIIIOH and FeIIIFeIIIOH fundamental and combination modes. This assignment is in agreement with the analysis of a Ventzia basin smectite by Christidis et al. (Reference Christidis, Katsiki, Pratikakis and Kacandes2010). Some Mg substitution in the octahedral sheet of the smectite cannot be excluded, especially in B65, based on the assignment of a ~3570 cm–1 shoulder (Fig. 5) to FeIIIMgOH (Petit et al., Reference Petit, Caillaud, Righi, Madejová, Elsass and Köster2002). In addition, the presence of trioctahedral smectite layers or domains (e.g. saponitic, hectoritic) cannot be fully excluded. Should such layers be present in the samples, their vibrational signatures would be completely masked by the relatively intense serpentine, trioctahedral-rich palygorskite and talc bands. Similarly, vibrational spectroscopy was instrumental in identifying the exceptionally trioctahedral and Fe-rich nature of the palygorskite in B64 and B65, as well as some Fe for Mg substitution in talc (sample B65).
Quantitative information may also be gained from the chemical composition. As an example, the C contents determined by LECO were compared with Rietveld data, and they corresponded well to the carbonate mineralogy, indicating the quality of the Rietveld fit, at least of the non-clay minerals. The comparison of the chemical composition with the overall mineralogical composition, however, was more difficult because of the presence of various phases with unknown, variable and similar (Fe, Mg) chemical compositions. This relates to not only the smectite, but also the palygorskite. Using the various structural formulae that will be presented later results in significant differences. Calculating the mineralogical composition based on the chemical composition was therefore not thought to provide further important information about the samples. On the other hand, a good correspondence between CEC values and smectite contents was observed, which indicates the quality of the Rietveld fits. The palygorskite and serpentine values, on the other hand, have to be treated with caution.
The specific surface areas determined by N2 adsorption using the BET method ranged from 26 to 70 m2/g. The values reflect the microporosity rather than the real surface area (Kaufhold et al., Reference Kaufhold, Dohrmann, Klinkenberg, Siegesmund and Ufer2010). The largest value was found for the material with the largest CEC (B64). This sample, however, contains appreciable amounts of palygorskite, which has an even larger surface area/microporosity compared to smectites and hence is supposed to be responsible for the microporosity corresponding to ~20 m2/g. Hence, the specific surface area is determined by both smectite and palygorskite. Enslin water-uptake values ranged from 125 to 160 mass%, which are typical of Ca/Mg bentonites. These values, however, are also affected by the water-uptake capacity of palygorskite and hence not only reflect a bentonite property.
Structural formulae
Structural formulae were calculated either from XRF analysis of the <0.2 µm samples (after correction for the non-smectitic phases present; Fig. 3) or from the Cu-saturated sedimented SEM-EDX samples (Supplementary Fig. S2). The results of these calculations are included in Table 5. In both cases, it was assumed that all Fe existed in the trivalent state, which is reasonable because bentonites commonly form under oxic conditions and the measured Fe2+/Fe3+ ratios in common bentonites are low (mostly <10%; Kaufhold et al., Reference Kaufhold, Dohrmann, Stucki and Anastácio2011). The structural formulae determined by the two methods differ mostly with respect to the ratio of octahedral Mg and Fe. The SEM-EDX data indicate compositions that are richer in Mg, whereas the analysis of the <0.2 µm fraction points towards clays that are richer in Fe. These differences originate from the assumptions underlying each method. As the <0.2 µm fraction was not purely smectitic (Fig. 3), a Rietveld-based correction for non-smectite minerals was necessary. This was necessarily based on ideal and not real compositions of the non-smectitic clay minerals. The larger Fe content may therefore be explained by the fact that no Fe contents were available for serpentine, palygorskite, kaolinite and talc, for example. As a result, too little Fe was subtracted from the <0.2 µm fraction. In addition, amorphous Fe phases may have been present, which may have increased the Fe content of the <0.2 µm fraction but were not considered in the correction. Reductive dissolution of Fe-oxides prior to <0.2 µm separation was not performed because structural Fe may also be reduced and hence affected, causing additional artefacts. On the other hand, the SEM-EDX-based formulae may yield excessive Mg because of a possible effect of the trioctahedral, non-smectitic minerals (e.g. serpentine, palygorskite and talc), which might be intimately intergrown with the measured smectites and hence affect the EDX data. The latter explanation is regarded as being less probable because fibrous minerals were not detected by SEM and because the structural formulae of samples B64 and B65 derived by SEM-EDX were similar to that published by Kastritis et al. (Reference Kastritis, Mposkos, Kacandes and Eliopoulos2003), except for the LCD, which is discussed later. Sample B63 contains more octahedral Al than samples B64 and B65 and the sample described by Kastritis et al. (Reference Kastritis, Mposkos, Kacandes and Eliopoulos2003) and less Mg, whereas the Fe contents are about the same. An effect of finely dispersed talc or similar phases could not be excluded. The smectites of the samples investigated in the present study have an average octahedral occupancy of 2.1–2.2 (<0.2 µm fraction) or 2.2–2.4 (SEM-EDX sample). Given that dioctahedral and trioctahedral smectites have ideal octahedral occupancies of 2.0 and 3.0, respectively, the structural formulae indicate that the smectites in samples B63–B65 are mostly dioctahedral with a possible minor trioctahedral contribution, presumably in the form of a separate ‘saponitic’ mineral or trioctahedral domains.
The structural formulae were all based on the assumption of the dominance of Fe3+, which is a reasonable assumption because saprolitic weathering is commonly associated with oxic conditions. Increasing the Fe2+/Fe3+ ratio (e.g. to 30%) does not change the LCD, which is determined by the exchangeable cations, but this does reduce the portion of tetrahedral charge from 38% to 30%. The tetrahedral charge values resulting from the structural formula calculation may vary depending on the Fe2+/Fe3+ ratio.
Layer charge density
The LCD of smectites is determined either based on the structural formula or measured using the alkylammonium method (AAM). Both methods were discussed in detail by Kaufhold et al. (Reference Kaufhold, Dohrmann, Stucki and Anastácio2011). Other LCD methods were calibrated against either the structural formula method (SFM) or AAM. Recently, Kuligiewicz et al. (Reference Kuligiewicz, Derkowski, Emmerich, Christidis, Tsiantos, Gionis and Chryssikos2015b) reported on the possibility of determining the LCD by IR spectroscopy of D2O-saturated samples. The so-called νΟ-D method was validated against LCDs determined independently by either the SFM or the AAM on natural and charge-reduced dioctahedral smectites. More recently, the νΟ-D method was tested successfully on non-purified bentonites (Tsiantos et al., Reference Tsiantos, Gionis and Chryssikos2018).
Various sets of LCD values calculated by the SFM and νΟ-D are compiled in Table 5. The main difference between SFM and νΟ-D determinations is that they are based on extensive vs. intensive measurements, respectively. The SFM requires the rationing of a LCD-related compositional parameter (e.g. number of interlayer cations or charge-generating substitutions) against the mass of smectite. As such, it can become problematic if the composition of pure smectite cannot be calculated accurately. On the other hand, the νΟ-D method is based on the exact positions (and not intensities) of D2O in the wettable interlayers of smectite. Thus, νΟ-D may be preferable compared to the SFM in measuring the LCD of the Ventzia smectite without interference from the non-smectitic phases. All three smectites studied by the νΟ-D method (Fig. 9) have LCD(SFM) ≈ 0.5 eq/FU and LCD(AAM) ≈ 0.33 eq/FU, with B63 being slightly more charged than B64 and B65 (Table 5). The charges derived by XRF from the <0.2 µm samples of B64 and B65 are nearly identical to the SFM predictions of νO-D, but the corresponding charge for B63 is higher, which might be explained by inaccurate quantitative analysis of the <0.2 µm fraction affecting the corrected chemical composition. The SEM-EDX-derived LCD values were intermediate to the SFM and AAM predictions of the νΟ-D method. This can be explained, at least in part, by the difference between exchangeable and total (i.e. exchangeable plus fixed) interlayer cations and the effect of cations adsorbed at particle edges (Kaufhold et al., Reference Kaufhold, Dohrmann, Stucki and Anastácio2011). The SFM, or methods calibrated against the SFM, provides LCD values that correspond to all permanent charges that are neutralized by both fixed and exchangeable cations. On the other hand, the AAM, or methods calibrated against the AAM, provides LCD values that correspond to the permanent charges with actually exchangeable cations. The Cu-SEM-EDX values determined in the present study reflect these sites with actually exchangeable cations without covering fixed cations (not exchangeable against Cu-trien). Some additional Cu-trien is presumably bound to edge sites (Kaufhold et al., Reference Kaufhold, Dohrmann, Stucki and Anastácio2011), which, however, only explains part of the difference.
Second-derivative νO-D signatures of samples B63–B65 in Li form. For details regarding the calculation of the LCD from the position of the νO-D bands, see Kuligiewicz et al. (Reference Kuligiewicz, Derkowski, Emmerich, Christidis, Tsiantos, Gionis and Chryssikos2015b).

All structural formulae in Table 5 suggest that the LCD of the Ventzia smectites has a significant tetrahedral fraction, which is higher in B63 than in B64 and B65. Charge-reduction experiments by Li fixation and subsequent CEC measurement indicated that ~50–55% of the charge persists after heating at 240°C for 24 h (Table 5) and may be of tetrahedral origin. Tetrahedral charge values determined by the SFM (<0.2 µm and SEM) show a larger range (30–76%) and much higher values for B63 compared to the other samples. As explained above, tetrahedral charge values determined by the SFM may be affected by the presence of Fe2+.
Summary and conclusions
All three bulk clays from the Ventzia basin are Fe- and Mg-rich and contain ~60–65 mass% smectite. Their bulk CEC ranges between 59 and 64 meq/100 g, with Mg2+ as the predominant interlayer cation. The samples can be distinguished according to their origin (Pilori vs. Velanida deposits) based on differences in their complex mineralogical compositions that involve both clay and non-clay accessory minerals. In all aspects of this study, samples B64 and B65 (Velanida) are very similar to each other, despite their stratigraphic and, presumably, environmental separation. The XRD and IR techniques, complemented by XRF/LECO, identified trace kaolinite predominantly in sample B63, as well as minor amounts of palygorskite (with exceptionally high trioctahedral character), serpentine (lizardite) and talc in samples B64 and B65 (Velanida deposit). Full separation of the smectite from the other clay mineral admixtures was not possible even at the level of the <0.2 µm fraction. In addition to clay minerals, all bulk samples contain quartz, hornblende and plagioclase, whereas samples B63 and B65 also contained dolomite/ankerite and/or calcite.
The identification of the predominant smectite species and its composition is strongly dependent on the ability of each experimental technique to isolate and subtract the contribution of the accessory phases present in the clay fraction. Vibrational spectroscopic analysis enabled the identification of the full suite of AlAlOH, AlFeOH and FeFeOH stretching, bending and combination triplets, suggesting the dioctahedral ferruginous character of the smectite. The strong and sharp vibrational signatures of the non-smectitic clay accessories precluded the identification by IR spectroscopy of minor trioctahedral smectite admixtures, should they be present. The predominantly dioctahedral nature of the Ventzia smectite is in agreement with the structural formulae and XRD data. None of the techniques used was able to unambiguously detect whether separate trioctahedral smectite or trioctahedral domains with predominantly dioctahedral smectites are present.
Due to the difficulty in isolating the smectite within the mineralogically complex clay fraction, the most suitable method for deducing the average permanent LCD of the smectite is the IR-based O-D method, yielding SFM- and AAM-type charges of 0.48–0.52 and 0.32–0.34 eq/FU, respectively. Instead, CEC and SEM-EDX structural formulae yielded intermediate values of 0.37–0.42 eq/FU. Li exchange and fixation by heating resulted in relatively moderate reductions of CEC, suggesting that the tetrahedral charge is significant.
Acknowledgements
The authors thank Kostas Vythoulkas and Manos Drossos of Geohellas for useful discussions and help with clay sample selection. Kostas Tsiantos (NHRF) is thanked for measuring the infrared spectra. Research at NHRF was supported with income from the Applied Spectroscopy Laboratory, a provider of industrial research services at TPCI.