Introduction
Ceramics based on the rare-earth compounds have extensive potential and unique features and have been applied in numerous uses such as the optical, magnetic, electrical, catalytic, chemical, and structural materials [Reference Navrotsky, Lee, Mielewczyk-Gryn, Ushakov, Anderko, Wu and Riman1]. Yttrium niobate Y3NbO7 crystallizes in the defect fluorite (CaF2) cubic structure (space group no. 225,  $Fm\bar{3}m$) and is one of many niobates widely investigated for various phenomena observed in these materials, e.g., luminescence [Reference Kim, Veillere, Chung, Jubera and Heintz2, Reference Walasek, Zych, Zhang and Wang3] or ionic transport [Reference Norberg, Ahmed, Hull, Marrocchelli and Madden4]. The fluorite unit cell of MO2 oxides contains
 ${\rm{M}}_4^{4 + }{{\rm{O}}_8}$. If the four tetravalent metal ions are replaced by three trivalent ions (RE) and one pentavalent M5+ ion, one oxygen vacancy per unit cell is formed. As a result of the substantial differences in ionic radii between the RE3+ and M5+ ions, cation ordering occurs on the metal sites and the oxygen-vacancy orders on the anion sites [Reference Hinatsu and Doi5].
It has been shown that Y3NbO7 is an oxygen ion conductor in a wide range of oxygen partial pressure [Reference Lee, Yashima and Yoshimura6] but also exhibits proton conductivity [Reference Winiarz, Mielewczyk-Gryń, Wachowski, Jasiński, Witkowska and Gazda7, Reference Chesnaud, Braida, Estradé, Peiró, Tarancón, Morata and Dezanneau8] remaining stable at high temperature under both oxidizing and reducing atmospheres [Reference Lõpez-Conesa, Rebled, Chambrier, Boulahya, González-Calbet, Braida, Dezanneau, Estradé and Peirõ9]. Additionally, at low oxygen partial pressures, the n-type conductivity is observed, giving a significant contribution to total conductivity [Reference Irvine, Fagg, Labrincha and Marques10]. Materials exhibiting ion conductivity are currently the subject of wide research activity, driven by their technological applications within solid oxide fuel cells (SOFCs), oxygen separation membranes, and gas sensors. The previous studies have shown that in the case of most rare-earth niobates the ionic conductivity occurs, both oxygen ion and protonic one [Reference Lee, Yashima, Kakihana and Yoshimura11, Reference Chesnaud, Braida, Estradé, Peiró, Tarancón, Morata and Dezanneau12]. Because of the high crystal structure symmetry, yttrium niobate is one of the most interesting materials as possible electrolyte in electrochemical devices. However, the total conductivity reported in the studies was not high enough; therefore, the possible enhancement by substitution has to be considered. One of the ways of increasing ionic conductivity of an oxide is to dope in such a way that a part of the host cations (e.g., niobium) is replaced by elements of a lower valence (e.g., titanium) resulting in anion vacancies formation. The charge compensating vacancies formed in the anion sublattice become mobile at elevated temperatures or/and are prone to form protonic defects. Therefore, the introduction of tetravalent elements such as titanium into niobium sublattice of Y3NbO7 influences the total conductivity by enhancing the ionic component [Reference Winiarz, Mielewczyk-Gryń, Wachowski, Jasiński, Witkowska and Gazda7]. In the case of ionic conductivity, it may be expected that higher symmetry of the lattice leads to the higher mobility of the defects. Thus, materials retaining the cubic fluorite structure are of particular interest. In our previous study, we analyzed the influence of titanium substitution on electric conductivity of yttrium niobate, which has showed considerable protonic contribution [Reference Winiarz, Mielewczyk-Gryń, Wachowski, Jasiński, Witkowska and Gazda7]. However, some questions concerning the titanium influence on other properties remain unanswered.
As for many systems interesting from the view of their electrical conductivity, there is a knowledge gap on thermal properties of all rare-earth niobates including yttrium niobates system. And this gap is needed to be filled before one understands the governing principles of all possible phenomena occurring in such systems. The analysis of possible phase transitions induced by substitution or changes in thermal expansion is necessary to predict behavior of such structures in operating devices, e.g., fuel cells. Therefore, this works attempts to address these issues for titanium substitution in yttrium niobate fluorite structure.
The possibility of the high solubility of titanium in Y3NbO7 structure was postulated in view of the energetics of formation of yttrium niobates and titanates [Reference Mielewczyk-Gryn and Navrotsky13]. The exchange reaction between rare earth niobates and titanates based on charge balance Nb5+ + Y3+ = 2Ti4+ is favorable with an enthalpy of exchange equal −1.60 ± 4.15 kJ/mol (far less exothermic than the one calculated for, e.g., zirconium exchange); hence, from the thermodynamic point of view substitution of Ti4+ is favorable [Reference Mielewczyk-Gryn and Navrotsky13].
In this work, we report the results of high-temperature X-ray diffraction (XRD) as well as thermogravimetric and dilatometry measurements of titanium-substituted yttrium niobates, Y3Nb1−xTixO7−δ (x ≤ 0.15). The influence of titanium content on chemical expansion, thermal expansion, as well as protonic defects concentration were studied and discussed.
Results and discussion
Thermal expansion
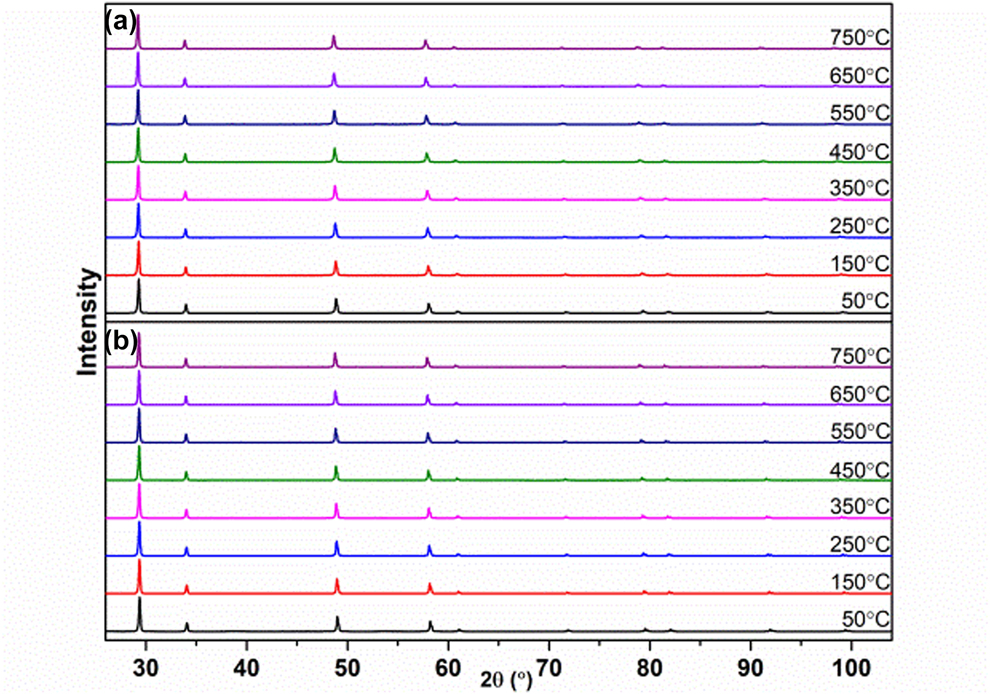
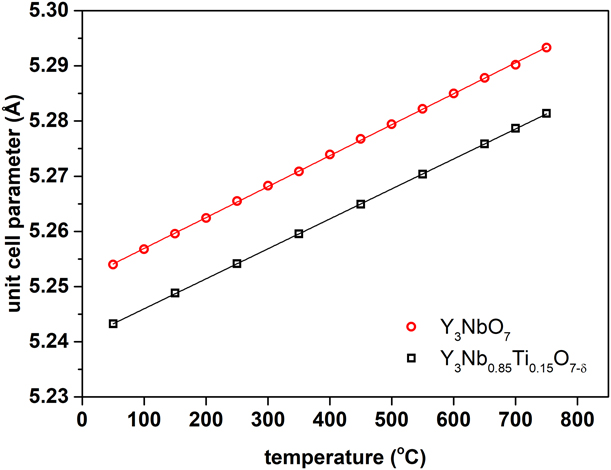
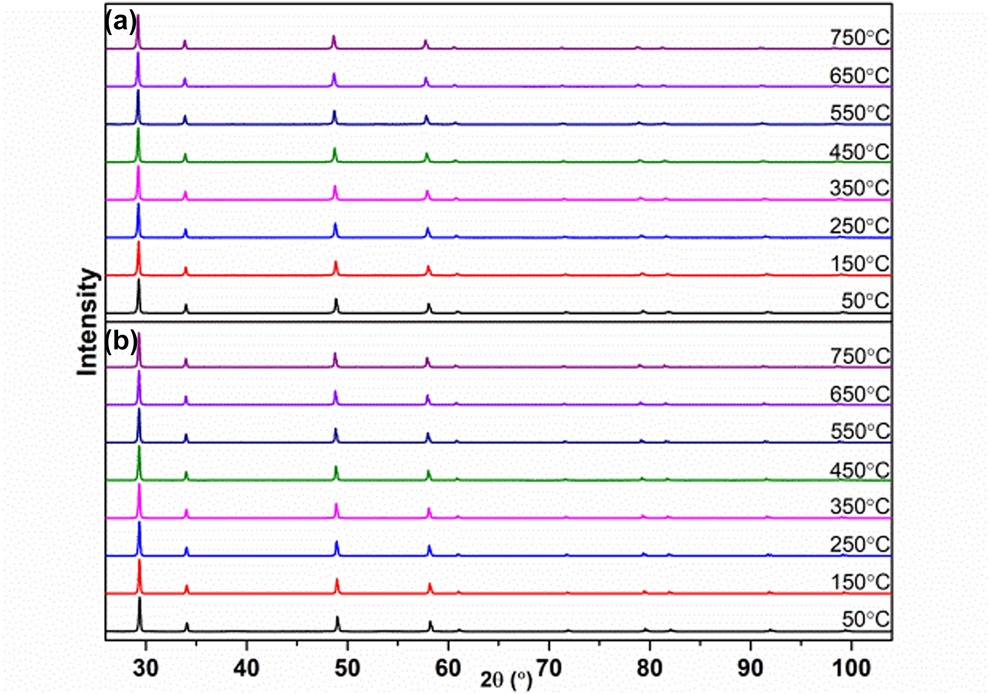
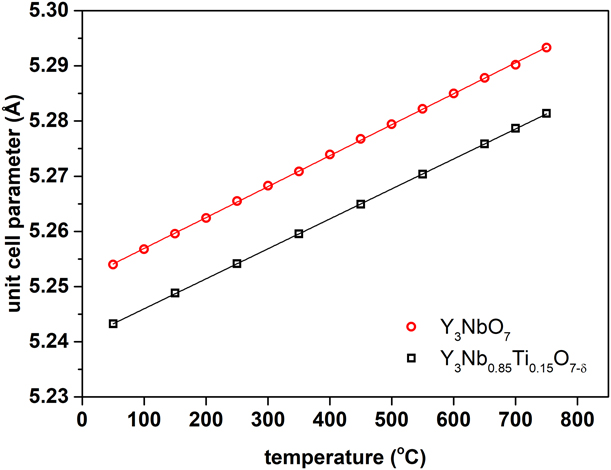
All synthesized samples were single-phase yttrium niobate with defect fluorite structure, all diffraction reflections being indexed within the  $Fm\bar{3}m$ phase, as described in our previous work [Reference Winiarz, Mielewczyk-Gryń, Wachowski, Jasiński, Witkowska and Gazda7]. The single-phase yttrium niobate substituted with 0 and 15 mol % of titanium in niobium sublattice was analyzed by the means of high-temperature X-ray diffraction (HT-XRD). High-temperature XRD patterns obtained for these samples in a temperature range between 50 and 750 °C are presented in Fig. 1. As it was expected, the high symmetry fluorite phase of yttrium niobate sustained stable up to 750 °C with no structural phase transition. The unit cell parameters were calculated using the Rietveld refinement method. The unit cell parameter for unsubstituted material matches the one obtained by other authors [Reference Cai and Nino14]. Figure 2 presents the unit cell parameters as a function of temperature. The results show a linear increase of unit cell parameters with increasing temperature reflecting the unit cell thermal expansion. On the basis of the thermal evolution of unit cell parameters, the lattice thermal expansion coefficient (TEC) was calculated yielding values of 10.69(1) and 10.39(1) × 10−6 1/K for Y3NbO7 and Y3Nb0.8Ti0.15O7−δ, respectively. Similar values of the TEC show that the substitution does not significantly influence the thermal expansion of crystal lattice.
High-temperature X-ray diffractograms for (a) Y3NbO7 and (b) Y3Nb1−xTixO7−δ.
Unit cell parameter as a function temperature for Y3NbO7 and Y3Nb1−xTixO7−δ (lines represent the least squares approximation, R 2 = 0.99).
Dilatometry studies of all of the synthesized samples were performed to compare the TEC of the polycrystalline materials with the crystal lattice expansion derived from the structural data. The proper match of TECs of different components of high-temperature devices such as SOFCs or electrolyzers is one of the biggest issues in this technology. Even the best performing electrolyte or electrode materials cannot be applied in a device without other elements (i.e., electrodes, electrolytes, sealing, or interconnectors) matching its expansion. Løken et al. [Reference Løken, Ricote and Wachowski15] provided a detailed analysis of importance of thermal and chemical expansion mismatch on performance and durability of electrochemical cells. The authors argue that safety limit for a difference of TECs between layers of the device (i.e., electrolyte and electrode) should not be larger than 50%. Otherwise the TEC values mismatch between elements or changes in TECs value upon heating/cooling may lead to delamination and in the end the failure of devices. Some promising electrolyte materials such as lanthanum orthoniobate cannot be used because of the TEC mismatch, without modifications, in operating devices, because of TEC values changes [Reference Norby and Magrasó16, Reference Mielewczyk-Gryn, Gdula-Kasica, Kusz and Gazda17]. Therefore, the thermal expansion is one of the key features, which should be analyzed while taking any materials into consideration as possible application in SOFCs.
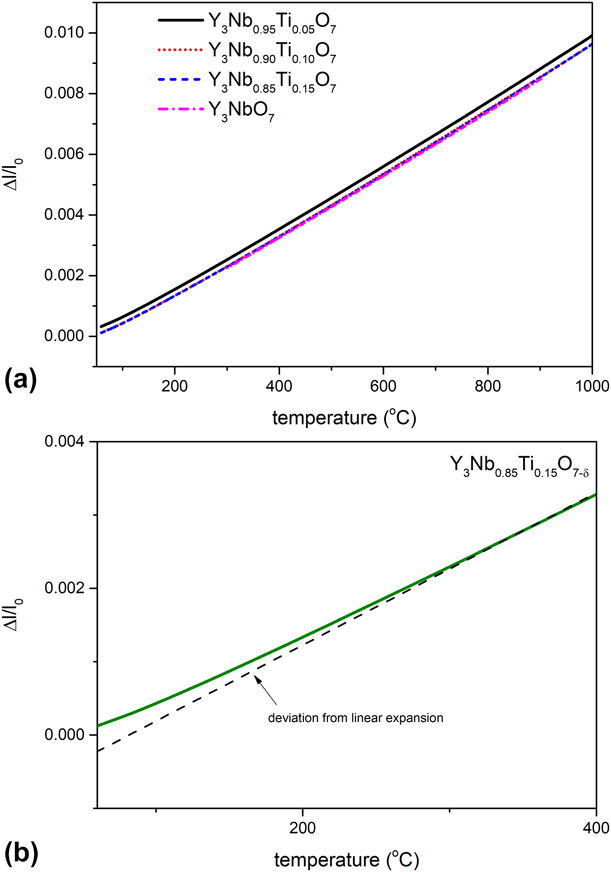
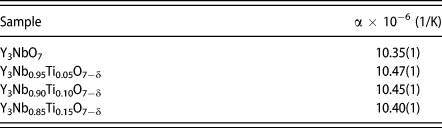
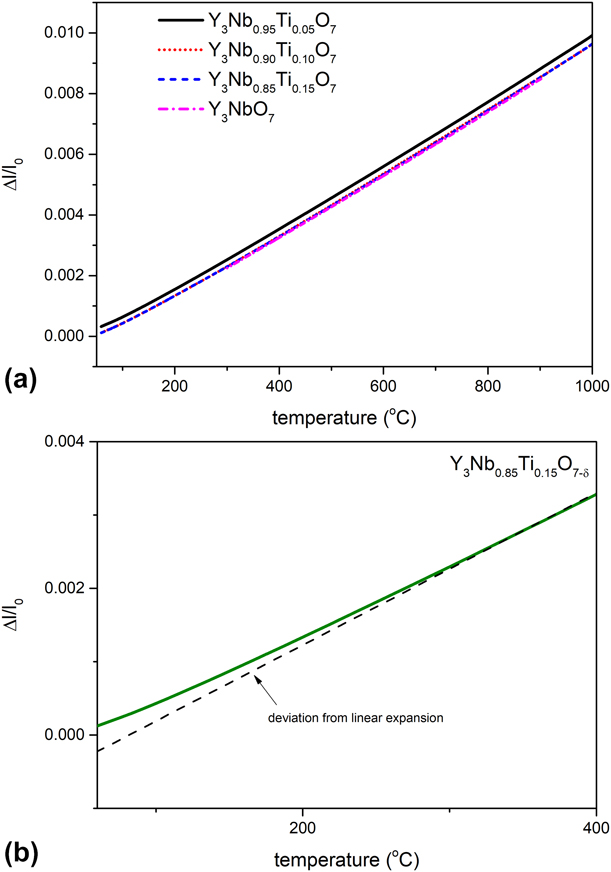
The relative elongation as a function of temperature is depicted in Fig. 3(a). Above 200 °C, the linear dependence of relative length versus temperature is visible, confirming the absence of the phase transition for all measured samples. For rare-earth niobates with lower symmetry at room temperature, such a transition can be observed, which is, in particular, visible for Sm3NbO7 [Reference Chen, Wu, Song and Feng18]. The average (technical) linear TEC was calculated above 200 °C and the values are summarized in Table I. The values of TECs calculated from the dilatometry are in a similar range as the one obtained from X-ray data, 10.65(1) × 10−6 1/K and 10.40(1) × 10−6 1/K for Y3NbO7 and Y3Nb0.85Ti0.15O7−δ, respectively. This shows that the TEC of the crystal lattice in investigated yttrium niobates is isotropic, as it would be assumed for cubic crystal structure. It should be noted, as it is presented in Fig. 3(b), that at a temperature below 200 °C, a deviation from a linear thermal expansion may be observed. Similar behavior was reported by Chen et al. in other RE3NbO7 materials [Reference Chen, Wu, Song and Feng18]. The temperature range (RT-200 °C) in which the nonlinearity occurs may suggest that surface phenomena as gas (e.g., water vapor) desorption influences the thermal expansion linearity or even the structural water incorporation. The abnormal behavior and even negative TEC have been previously reported for materials, which can retain water within their structure, e.g., A2M3O12 family or Zr1−xHfxMo2−yWyO8 [Reference Lind19]. Thermal expansion of Y3NbO7 as a proton conductor may be affected by water incorporation to some extent. However, this does not seem to be an intrinsic material property because lattice thermal expansion is linear in the whole studied temperature range.
(a) Relative elongation as a function of temperature (b) deviation from linearity for the temperature range below 300 °C.
Linear thermal expansion coefficients.

Both the high-temperature structural analysis and dilatometry results gave almost identical thermal coefficients of expansion for all titanium-substituted samples. Generally speaking, the temperature expansion coefficient of a solid depends on the characteristics of bonds between ions. Therefore, it may be influenced in either a direct or indirect way by valence states of ions, their ionic radii, as well as by structural defects and the disorder introduced by doping. Cubic structures, with all atoms in special positions, can be described in terms of one variable, the cation–anion distance, which is geometrically related to the lattice parameter. Therefore, in these structures, the bond-length TEC determines the macroscopic linear coefficient. The similar values of TECs for all investigated samples show that substitution does not influence the Pauling valence of investigated samples while assuming the relation between TEC and Pauling valence can be described following Megaw as α = q 2 (where α is TEC value and q Pauling valence) [Reference Megaw and Megaw20]. It is also known that TECs tend to increase with the decreasing crystal lattice energy. Moreover, in fluorite-type ceramics, crystal lattice energy decreases with the decreasing crystal structural order, which has been observed in other RE3NbO7 materials [Reference Chen, Wu, Song and Feng18]. So, the absence of influence of the 15 mol% of titanium on TEC suggests that titanium does not introduce significant lattice disorder.
In a context of the future application of a constant TEC in a wide range of temperature seems to be one the important factors [Reference Løken, Ricote and Wachowski15]. The values of TEC obtained for the investigated system are similar to the one obtained by other groups and for other rare-earth niobates with defected fluorite structure [Reference Chen, Hu, Wu, Song and Feng21].
Summing up, thermal expansion properties of the Y3Nb1−xTixO7−δ materials are consistent with their structural properties, however, to fully understand the influence of substitution in yttrium niobate system on interatomic bonds and atoms coordination; further diffraction (neutron, synchrotron X-ray) and spectroscopic studies (e.g., X-ray absorption) are necessary.
Chemical expansion
Besides thermal expansion, one may also analyze the effect of doping on the change in the lattice volume induced by doping, i.e., chemical (stoichiometric) expansion. Chemical expansion refers to the spatial dilation of a material that occurs upon changes in its composition. This makes a challenge for materials for solid-state electrochemical devices stemming from chemical expansion because of its significant contribution to the total strain of ceramics as components in such devices [Reference Frade22].
To analyze the expansion caused by stoichiometry change, one can describe the relation showing the formation of defects in the analyzed system. The reaction of the formation of Ti-doped yttrium niobate is as follows:
 $$\eqalign{{3 \over 2}{{\rm{Y}}_2}{{\rm{O}}_3} + x{\rm{Ti}}{{\rm{O}}_2} + {{1 - x} \over 2}{\rm{N}}{{\rm{b}}_2}{{\rm{O}}_5} = 3{\rm{Y}}_{\rm{Y}}^x + x{\rm{Ti}}_{{\rm{Nb}}}^\prime \cr+ \left( {1 - x} \right){\rm{Nb}}_{{\rm{Nb}}}^x + {x \over 2}{\rm{v}}_{\rm{O}}^{{\rm{ \bullet \bullet }}} + \left( {7 - {x \over 2}} \right){\rm{O}}_{\rm{O}}^x\quad .$$
The reaction is written with an assumption that Ti is at 4+ oxidation state, which was confirmed by previous results obtained by the XPS method [Reference Winiarz, Mielewczyk-Gryń, Wachowski, Jasiński, Witkowska and Gazda7].
From (1), one sees that the dopant introduction leads to a formation of  ${\rm{Ti}}_{{\rm{Nb}}}^\prime$ and
 ${\rm{v}}_{\rm{O}}^{{\rm{ \bullet \bullet }}}$, which leads to a simplified electroneutrality equation in dry conditions given as
 $2\left[ {{\rm{v}}_{\rm{O}}^{{\rm{ \bullet \bullet }}}} \right] = \left[ {{\rm{Ti}}_{{\rm{Nb}}}^\prime } \right]$. Kobayashi et al. [Reference Kobayashi, Ogino, Mori, Yamamura and Mitamura23] have shown that in this material oxygen vacancies concentration is constant over a wide range of temperatures. Therefore, the contributions from intrinsic defects may be neglected as the concentration of intrinsic vacancies originating from Schottky or anti-Frenkel disorder is usually much smaller than the ones introduced by doping. On this basis, one may formulate formula for the net lattice effect of chemical expansion caused by doping as [Reference Løken, Ricote and Wachowski15]
 $${\beta _{{\rm{doping}}}} = {\beta _{{\rm{Ti}}_{{\rm{Nb}}}^\prime }} + {1 \over 2}{\beta _{{\rm{v}}_{\rm{O}}^{{\rm{ \bullet \bullet }}}}}\quad .$$
Note that 1/2 factor in (2) stems from the imposed electroneutrality condition, where each acceptor is compensated by 1/2  ${\rm{v}}_{\rm{O}}^{{\rm{ \bullet \bullet }}}$. Equation (2) represents a combined effect of two competitive processes of chemical expansion: one stemming from the formation of negatively charged dopant site and the other from oxygen vacancy. These two terms cannot be separated without additional studies of local effects (i.e., X-ray absorption studies) or computer simulations (e.g., DFT). However, the βdoping may be calculated from experimental data by the use of the following:
 $${\beta _{{\rm{doping}}}} = {1 \over x}\left( {{{{V_x} - {V_0}} \over {{V_0}}}} \right)\quad ,$$
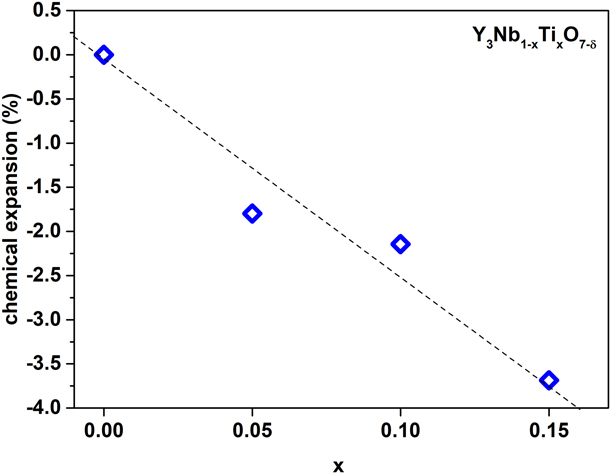
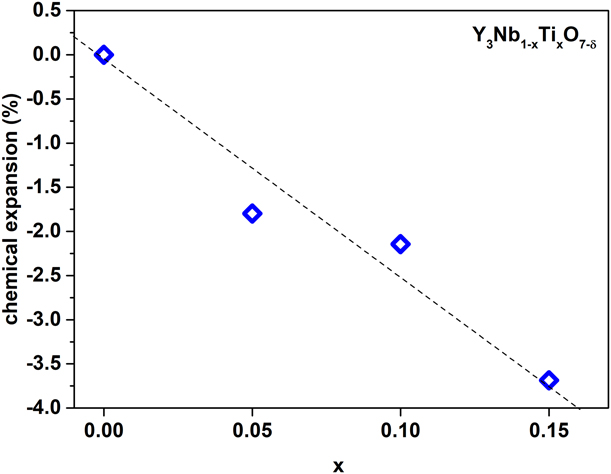
where x is a molar fraction of titanium in Y3Nb1−xTixO7−δ, and V x, V 0 are volumes of the unit cell with x and 0 Ti, respectively. The values were calculated and plotted as a function of x in Fig. 4. As can be seen in the figure, the chemical expansion is negative, which means that the overall effect of doping is a contraction of a unit cell. The value of chemical expansion for fluorites has been previously attributed to the difference in ionic radii between the substituent and native ion [Reference Marrocchelli, Perry and Bishop24]. Since the ionic radii of titanium 4+ and niobium 5+ in 8-fold coordination is identical (0.74 Å [Reference Shannon25]), this suggests that in the case of yttrium niobate substituted with titanium, titanium does not sustain 8-fold coordination. The ionic radius of Ti4+ with lower than 8 coordination number is 0.605 Å or less. The smaller ionic radius is probably the cause of the lattice contraction. This has been reported before for other systems, e.g., perovskites [Reference Jedvik, Lindman, Benediktsson and Wahnström26]. It should be also noted that chemical expansion is not constant, but decreases with increasing x. This means that the unit cell upon doping shows a nonlinear decrease in that range of titanium content. This is consistent with our previous report on structural properties of Ti-doped yttrium niobate [Reference Winiarz, Mielewczyk-Gryń, Wachowski, Jasiński, Witkowska and Gazda7].
Chemical expansion coefficients for Y3Nb1−xTixO7−δ samples with x = 0.05, 0.10, and 0.15.
Water uptake analysis
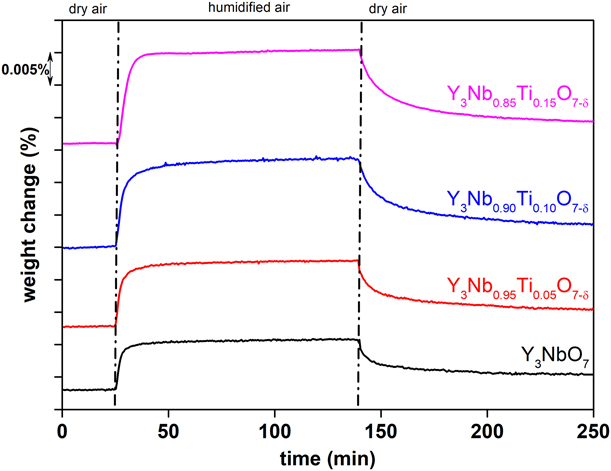
In our previous work concerning titanium-substituted yttrium niobate, the electrical measurements’ results showed that this system exhibits mixed oxygen-ion and proton conductivity with proton conductivity dominating in the low-temperature range in humid atmospheres [Reference Winiarz, Mielewczyk-Gryń, Wachowski, Jasiński, Witkowska and Gazda7]. However, there have been no studies on protons concentration in this system. To examine that, the thermogravimetric studies have been undertaken. The isothermal switches at 300 °C between dry and humidified air were performed to analyze the samples water uptake. To ensure minimal surface water contribution to the total mass gain, all tests were undertaken at 300 °C on coarsened powders with total Brunauer–Emmett–Teller (BET) surface area ∼1 m2/g. The BET measurements shown no differences, within the error, between surface areas for all investigated samples. The thermogravimetric data are presented in Fig. 5. For all analyzed samples, the water uptake was detected, and the total value of the weight change increased with titanium content. This is in agreement with increasing oxygen vacancies concentration due to niobium substitution with titanium occurring as in reaction (1). Assuming the vast majority of titanium present in the niobium sublattice is at 4 + oxidation state, then the total oxygen non-stoichiometry (δ) resulting from such a substitution is equal to 0.025, 0.05, and 0.075 for 5, 10, and 15 mol% titanium content, respectively. On this basis, one may calculate that 0.36, 0.7, and 1% oxygen sites are empty. The hydration reaction for the analyzed system can be written as (4); thus, it can be stated that the oxygen vacancy concentration increase induced by doping leads also to an increase of proton concentration in the material [Fig. 4(b)],
 $${\rm{O}}_{\rm{O}}^{\rm{X}} + {\rm{v}}_{\rm{O}}^{{\rm{ \bullet \bullet }}} + {{\rm{H}}_2}{{\rm{O}}_{\left( {\rm{g}} \right)}} = 2{\rm{OH}}_{\rm{O}}^{\rm{ \bullet }}\quad .$$
TGA for Y3Nb1−xTixO7−δ samples for x = 0, 0.05, 0.10, and 0.15.
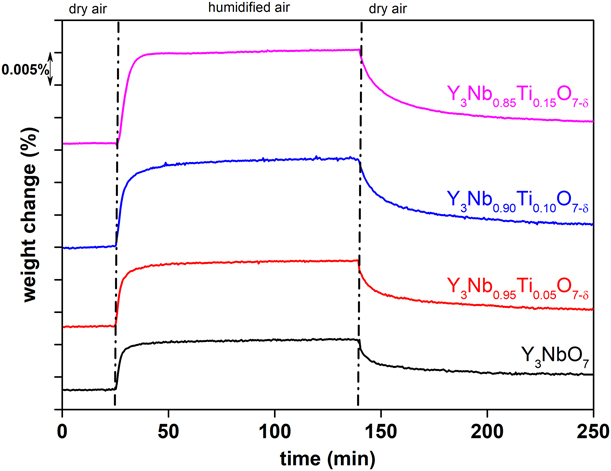
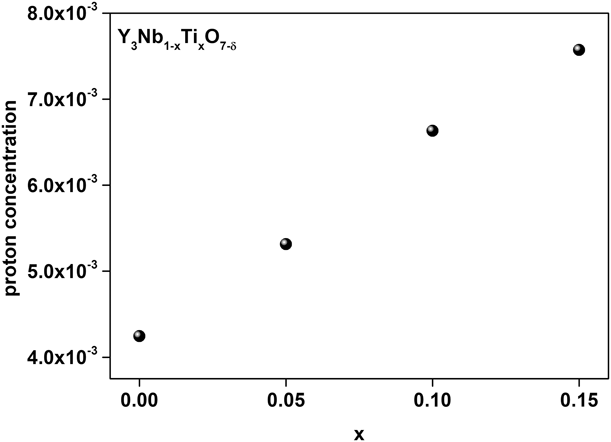
According to reaction (4) for each mole of water incorporated, one may expect two moles of protonic defects in the structure. However, the total proton concentration in the structure is at least one order of magnitude lower than it would be suggested by total oxygen non-stoichiometry yielding from titanium content. Since, as it was reported by Kobayashi et al. [Reference Kobayashi, Ogino, Mori, Yamamura and Mitamura23], the oxygen vacancy concentration is constant in a wide range of temperatures and the hydration reaction is exothermic, therefore at temperatures higher than 300 °C protonation level should be even smaller. Therefore, only a small fraction of oxygen vacancies may be hydrated (0.1%). The proton concentration (Fig. 6) obtained in our work is of the same order of magnitude as the one measured by Chesnaud et al. for unsubstituted Y3NbO7 [Reference Chesnaud, Braida, Estradé, Peiró, Tarancón, Morata and Dezanneau8]. However, the values obtained by us are approximately two to three times lower than theirs. We suppose this is caused by the differences in methodology. In the case of work by Chesnaud et al., the isobaric approach, with helium as a purge gas, was conducted, which may lead to overestimation of the total water uptake. In the case of isothermal switches applied in our work, the total weight gain may be attributed solely to water uptake whereas in the case of isobaric studies the changing temperature can influence both oxidation and hydration. And since the water uptake should depend on oxygen non-stoichiometry, the varying oxygen content influences the results quite substantially. Moreover, the difference in the pO2 in the carrier (purge) gas can also significantly change the achieved data. In the case of using synthetic air as a carrier gas, we ensure reaching the similar water vapor partial pressure as the one in electrical measurements undertaken in our previous studies [Reference Winiarz, Mielewczyk-Gryń, Wachowski, Jasiński, Witkowska and Gazda7].
Protonic defects concentration for Y3Nb1−xTixO7−δ samples with x = 0, 0.05, 0.10, and 0.15.

It should be noted that the increasing proton concentration with increasing Ti content is in a qualitative agreement with our previously reported electrical measurements. Moreover, low concentration of protonic defects in the Y3Nb1−xTixO7−δ materials may explain a relatively small difference between electrical conductivity values observed in dry and wet atmospheres, which has been reported by us full proof [Reference Winiarz, Mielewczyk-Gryń, Wachowski, Jasiński, Witkowska and Gazda7]. For instance, conductivity at 450 °C in wet air of Y3NbO7 and Y3Nb0.85Ti0.15O7−δ is approximately three and two times larger than that in dry air. Such behavior of yttrium niobate system is in contrast to what is observed for example in lanthanum orthoniobate where even lower proton concentration results in much higher protonic conductivity [Reference Mielewczyk-Gryń, Wachowski, Prześniak-Welenc, Dzierzgowski, Regoutz, Payne and Gazda27]. It was previously reported by López-Conesa et al. that in the case of yttrium niobate system the ordering of oxygen vacancies may occur [Reference Lõpez-Conesa, Rebled, Chambrier, Boulahya, González-Calbet, Braida, Dezanneau, Estradé and Peirõ9]. This effect through the stabilization of a rigid system of oxygen vacancies may influence both protonic defects concentration and their mobility. This has been postulated as a limiting factor for conductivity for investigated yttrium niobates [Reference Winiarz, Mielewczyk-Gryń, Wachowski, Jasiński, Witkowska and Gazda7].
Conclusions
Titanium-substituted yttrium niobate materials, Y3Nb1−xTixO7−δ, have been analyzed by the means of thermal analysis methods, including high-temperature XRD, dilatometry, and thermogravimetry.
It was found that TECs did not depend on the titanium content and were of the order of 10−5 1/K. Analysis of the chemical expansion coefficients showed that the unit cell contracts as a result of the substitution of niobium with titanium. It was proposed that titanium valence state in yttrium niobate is 4+, but its coordination number is lower than 8. It was also suggested that the titanium presence does not introduce significant lattice disorder.
The ordering of oxygen vacancies, suggested by previous studies, probably stabilizes the oxygen vacancy sites leading to very small incorporation of protons and consequently to a limited proton conductivity. To fully understand the nature of protonation in this group of compounds, further thermogravimetry analysis in various temperatures and water vapor partial pressures should be performed.
Experimental
Titanium-substituted yttrium niobate samples Y3Nb1−xTixO7−δ (where x = 0, 0.05, 0.10, and 0.15) have been synthesized by the means of the solid-state reaction method. Stoichiometric amounts of reagents (Y2O3 Alfa Aesar, Thermo Fisher GmbH, Kandel, Germany 99.99%; Nb2O5 Alfa Aesar 99.9985%; TiO2 VWR Prolabo min 99%) were ground in an agate mortar. The resultant powder was uniaxially pressed in a 12 mm die using the pressure of 520 MPa. The pellets were heat-treated in three steps. They were heated at 1350 °C for 8 h, then in the second step, the heat treatment was performed at 1400 °C for 12 h, and the final sintering was undertaken at 1500 °C for 14 h. Between each of the heat treatment steps, the pellets were ground in an agate mortar and re-pelletized. The heating rate of each stage was 3 °C/min. The phase content of synthesized samples has been checked by the means of XRD method. The structural characterization of the samples was performed using the Philips X’pert Pro MPD system (Almelo, The Netherlands) with the CuKα radiation. The HT-XRD data were collected up to 750 °C in static air using Anton Paar HTK-1200 camera (Graz, Austria). The sintered samples were ground to obtain powder and then measured by HT-XRD. The diffractograms were analyzed by the Rietveld refinement method using FullProf Suite [Reference Rodríguez-Carvajal28]. As an initial point of the analysis, unit cell parameters of the defect fluorite  $\left( {Fm\bar{3}m} \right)$ Y3NbO7 were utilized (109064-ICSD). Specific surface area measurements by the means of BET theory and water sorption studies have been performed using Quantachrome iQ Autosorb System (Quantachrome, Boynton Beach, Florida).
Measurements of the TEC of the ceramic samples were conducted with a dilatometer (DIL 402C, Netzsch Gmbh, Selb, Germany) in synthetic air (N2/O2 80/20) from room temperature to 1000 °C and back down with the ramp rate of 2 °C/min. The TEC was calculated from Eq. (5), where L 1 is the initial length of the sample, L 2 length of the sample after testing, and T 1 and T 2 are the initial and test temperature of measurement, respectively,
 $$\alpha = {{{L_2} - {L_1}} \over {{L_1}\left( {{T_1} - {T_2}} \right)}}\quad .$$
Thermogravimetric analysis (TGA) was performed using a Netzsch Jupiter® 449 F1 (Netzsch Gmbh, Selb, Germany) on sample powders of the weight of approximately 2 g. The as-prepared powders were heated to 1000 °C and held at this temperature for 0.5 h under dry air (N2/O2 80/20) to remove residual water and possible surface carbon dioxide. The samples after drying were cooled to 300 °C in dry gas. After 2 h of stabilization, the dry purge gas was switched to the humidified gas  $\left( {{P_{{{\rm{H}}_2}{\rm{O}}}} = 0.023\;{\rm{atm}}{\rm{.}}} \right)$; then after additional 2 h, the purge gas was switched back to the dry gas.
Acknowledgments
A.M.G. acknowledges support from the Ministry of Science and Higher Education, Poland (Iuventus Plus scheme) Grant No. IP2015 051374.