Introduction
Violent events among adults with mental illness are multidetermined and occur in complex social and interpersonal systems (Swanson et al. Reference Swanson, Swartz, Van Dorn, Elbogen, Wagner, Rosenheck, Stroup, McEvoy and Lieberman2006b ). As a result, valid empirical and thus clinically useful evidence is lacking regarding how risk factors effect subsequent change, which limits the effectiveness of violence risk management strategies. What is known about violence and mental illness has been informed, in the main, through examinations of perpetration in community and in-patient settings, the findings of which are limited in important ways.
Much of the community-based research has been cross-sectional and research that has modeled longitudinal data often does not lag independent and dependent variables (Silver et al. Reference Silver, Piquero, Jennings, Piquero and Leiber2011; Van Dorn et al. Reference Van Dorn, Volavka and Johnson2012). Not lagging a clinically relevant indicator means that the factor is either concomitant or consequent to the outcome. It has been argued that when temporality between independent and dependent variables cannot be established, then the ‘independent variable’ under study should not even be considered a ‘risk factor’ (Kraemer et al. Reference Kraemer, Kazdin, Offord, Kessler, Jensen and Kupfer1997). However, even when temporality is established between variables, the length of time between observations is often longer than desired, which decreases spatio-temporal contiguity (Van Dorn et al. Reference Van Dorn, Volavka and Johnson2012). Also, when effects are lagged, research is still modeling low base rate outcomes, often with small samples, which both constrains the number of effects that can be analysed and results in biased point estimates and wide confidence intervals (Peduzzi et al. Reference Peduzzi, Concato, Kemper, Holford and Feinstein1996), which decreases the validity of findings. Consequently, there is limited clinical utility associated with much of the extant community-based violence research.
Research from in-patient settings has limited generalizability to community settings, due to reliance on data from exacerbated patients, a truncated time-frame for violence, and closed environments that artificially increase medication compliance beyond levels seen in community settings. In in-patient studies, psychiatric symptoms have been identified as increasing violence risk (Nolan et al. Reference Nolan, Volavka, Czobor, Sheitman, Lindenmayer, Citrome, McEvoy and Lieberman2005), but significant relationships between symptoms and violence are infrequent in lagged community research (Swanson et al. Reference Swanson, Swartz, Van Dorn, Volavka, Monahan, Stroup, McEvoy, Wagner, Elbogen and Lieberman2008). Also, beyond periods of substance use detoxification, violence risk associated with drug and alcohol intoxication must necessarily approach zero in in-patient settings (Dack et al. Reference Dack, Ross, Papadopoulos, Stewart and Bowers2013), whereas community research suggests that substance use is a key driver of violence risk (Fazel et al. Reference Fazel, Långström, Hjern, Grann and Lichtenstein2009).
A limitation that cross-cuts both community and in-patient violence research is that it is often conducted with small, non-representative and homogeneous samples. In the main, these samples lack statistical power to reliably identify antecedents and consequences of violence. Data integration is one solution to overcoming these limitations.
While data integration is not a new research strategy (Oxman et al. Reference Oxman, Clarke and Stewart1995), it remains largely unfamiliar to many in the behavioral sciences generally, including psychiatry and psychology specifically (Curran & Hussong, Reference Curran and Hussong2009). Briefly, data integration can be viewed as an approach to research synthesis, where meta-analysis (Glass, Reference Glass1976; Smith & Glass, Reference Smith and Glass1977) has been the dominant analytic approach. As an approach to research synthesis, data integration has advantages and disadvantages compared with meta-analysis. First, the major difference is the data to be analysed. In data integration, raw data from a collection of studies are analysed whereas reported statistics, such as effect sizes, from published and unpublished papers are analysed in meta-analyses. Thus, the first limitation of data integration is the need to obtain data from each study, which can limit generalizability compared with meta-analysis, as often fewer datasets are integrated than are analysed using meta-analysis. Second, for data integration, data must be scaled to a common unit of measurement, which may not be possible across multiple studies; this can limit the number of studies included, which further limits generalizability.
However, there are benefits associated with data integration compared with meta-analysis. For example, researchers can decide on the appropriate statistical model, covariates, and other factors to answer research questions because the data are in-hand. Integrated data also afford statistical power to examine subgroup effects rarely evaluated in individual studies. Scaling data to a common metric also allows for comparison of unstandardized effects, which generalize across studies. Finally, researchers can account for design features, which is important in longitudinal studies where the number and timing of assessments and spacing of observations vary across studies.
For the current paper, then, we integrated data from four community studies in order to assess violent events among adults with mental illness, within a dynamic and clinically focused framework. Our integrated data result in a heterogeneous sample of adults with mental illness, which aligns with the National Institute of Mental Health's (NIMH) Research Domain Criteria (RDoC); that is, we are able to both focus on dimensions of functioning that cross-cut disorders, while still being able to evaluate the impact of patient characteristics at multiple stages. To that end, we set out to answer the following questions: (1) Are the effects of violent events, psychiatric symptoms, substance use, homelessness and in-patient treatment stable? (2) What is the relationship between violent events, psychiatric symptoms, alcohol and drug use, homelessness and in-patient treatment over time? (3) What are the most robust leading indicators of violent events? (4) Do leading indicators vary across patient characteristics? The term leading indicator is used to indicate the nature of subsequent changes and not to infer causality. With regards to our autoregressive cross-lag (ACL) model, which is described below, knowledge of a person's score on a leading indicator provides information about the person's subsequent score on the same (autoregressive effect) or other variables (cross-lagged effect).
Method
Participants
Studies included broad inclusion and minimal exclusion criteria and enrolled a range of participants, all of whom gave written informed consent. The study protocol was approved by institutional review boards from RTI International, Arizona State University and North Carolina State University.
Studies
The Facilitated Psychiatric Advance Directive (F-PAD) Study (Swanson et al. Reference Swanson, Swartz, Elbogen, Van Dorn, Ferron, Wagner, McCauley and Kim2006a ) included participants (n = 469) from two mental health systems in North Carolina. Inclusion criteria were: (a) 18–65 years of age; (b) schizophrenia-spectrum or major mood disorder; and (c) currently in treatment. Data were collected between 2003 and 2007. Assessments were conducted at baseline, and at 1, 6, 12 and 24 months. Sample attrition was 21% over the first 6 months, 9% between 6 and 12 months, and 25% between 12 and 24 months.
The MacArthur Mental Disorder and Violence Risk (MacRisk) Study (Steadman et al. Reference Steadman, Mulvey, Monahan, Robbins, Appelbaum, Grisso, Roth and Silver1998) included participants (n = 1136) recruited from three sites: Pittsburgh, PA, Kansas City, MO, and Worcester, MA. Inclusion criteria were: (a) English-speaking Caucasian, African American or Hispanic patients; (b) 18–40 years of age; and (c) schizophrenia-spectrum, depression, mania, brief reactive psychosis, delusional disorder, ‘other’ psychotic disorder, substance abuse/dependence or personality disorder. Data were collected between 1992 and 1995. Assessments were conducted at baseline and every 10 weeks for a total of five follow-up assessments. At least one follow-up interview was obtained for 84% of subjects; 72% completed three or more; 50% completed all five.
The Schizophrenia Care and Assessment Program (SCAP) (Swanson et al. Reference Swanson, Swartz and Elbogen2004) included participants (n = 404) recruited from treatment facilities across North Carolina. Inclusion criteria were: (a) 18–65 years of age; (b) schizophrenia; and (c) current service use. Data were collected between 1997 and 2002. Assessments were conducted at baseline and every 6 months for 36 months. Participant retention never dropped below 90%.
The Clinical Antipsychotic Trials of Intervention Effectiveness (CATIE) Study (Lieberman et al. Reference Lieberman, Stroup, McEvoy, Swartz, Rosenheck, Perkins, Keefe, Davis, Davis and Lebowitz2005) included participants (n = 1460) recruited from 57 sites across the USA. Inclusion criteria were: (a) 18–65 years of age; (b) schizophrenia; and (c) ability to take oral antipsychotics. Data were collected between 2001 and 2004. Violence and victimization were assessed at baseline and every 6 months for up to 18 months. Substance use and psychiatric symptoms were assessed at baseline, and at 1, 3, 6, 9, 12, 15 and 18 months. Almost 73% of subjects discontinued their original study medication. Of these, 607 were reassigned to subsequent study phases.
These four studies (n = 3473) were integrated for the current analyses. A fifth study, the MacArthur Mandated Community Treatment (MacMandate) Study (Monahan et al. Reference Monahan, Redlich, Swanson, Robbins, Appelbaum, Petrila, Steadman, Swartz, Angell and McNiel2005), which was cross-sectional, was used, in addition to the four longitudinal studies, in the factor analysis and factor score calculation for psychiatric symptoms and violent events, as described below. The MacMandate included participants (n = 1011) recruited from five sites: Chicago, IL; Durham, NC; San Francisco, CA; Tampa, FL, and Worcester, MA. Inclusion criteria were: (a) 18–65 years of age; (b) English- or Spanish-speaking; (c) current out-patient treatment; and (d) first service occurred at least 6 months prior. Data were collected between 2002 and 2003.
Variables
Violent events were assessed using the MacArthur Community Violence Screening Instrument (Steadman et al. Reference Steadman, Mulvey, Monahan, Robbins, Appelbaum, Grisso, Roth and Silver1998). For each of eight items, participants were asked first if someone did this to them in the past 6 months at baseline or since the last assessment (victimization), then if they did this to someone else during the same period (violence). Factor scores reflect violent event prevalence and severity.
The Brief Psychiatric Rating Scale (BPRS) (Overall, Reference Overall and Olivier-Martin1974) and the Positive and Negative Syndrome Scale (PANSS) (Kay et al. Reference Kay, Flszbein and Opfer1987) were used to assess psychiatric symptoms. Both use an anchored seven-point scale indicating presence and severity of symptoms. The PANSS includes the 18-item BPRS and 12 additional items from the Psychopathology Rating Schedule (Singh & Kay, Reference Singh and Kay1975). The 30-item PANSS was used in the CATIE and SCAP. The 18-item BPRS was used in the F-PAD, MacMandate and MacRisk. Item responses were examined and certain response categories were combined due to low response frequency. For example, if less than 1% of the sample responded in category 7, then categories 6 and 7 were combined. Approximately three-quarters (76%) of data were complete for the 30 items. Items had responses from approximately 41 or 100% of the total sample due to study; thus, data were essentially incomplete by design (McArdle, Reference McArdle1994).
The CAGE (Cut down, Annoyed, Guilty, Eye opener; Mayfield et al. Reference Mayfield, McLeod and Hall1974), the Alcohol and Drug Use Scales (Drake et al. Reference Drake, Osher, Noordsy, Hurlbut, Teague and Beaudett1990), urine drug screens, self-report and the Structured Clinical Interview for DSM-IV (First et al. Reference First, Spitzer, Gibbon and Williams1996) were used to indicate abstinence, non-problematic, and problematic alcohol and drug use. Homelessness (self-report) and in-patient treatment (self-report and medical records) during the recall period were harmonized across studies. For these variables, all available items and their respective response scales were examined to create comparable scores using the information provided by each study.
Data analysis
Violence, victimization and psychiatric symptom variables were created with split-half methods; exploratory factor analysis was conducted on a random subsample of data and confirmatory factor analysis on the remaining data. Analyses confirmed that violence and victimization were represented by single-factor models (Michie & Cooke, Reference Michie and Cooke2006). Psychiatric symptom data, which were modeled as ordinal, using the weighted least squares with means and variance adjustment estimator (Tueller et al. Reference Tueller, Johnson, Grimm, Desmarais, Sellers and Van Dorn2016), were represented by four factors that retained all 30 items. The affective factor consisted of anxiety, depression, guilt feelings, somatic concern, hostility and poor impulse control. The positive factor consisted of delusions, suspiciousness/persecution, grandiosity, hallucinatory behavior, unusual thought content, and lack of judgment and insight. The negative factor consisted of active social avoidance, passive/apathetic social withdrawal, blunted affect, emotional withdrawal, motor retardation, lack of spontaneity and flow of conversation, disorientation, difficulty in abstract thinking, and poor rapport. The disorganized cognitive processing factor consisted of poor impulse control, disorientation, difficulty in abstract thinking, poor rapport, excitement, conceptual disorganization, poor attention, mannerisms and posturing, tension, preoccupation, stereotyped thinking, uncooperativeness and disturbance of volition. The factors were invariant (i.e. configural, metric, scalar) across diagnosis, sex, race/ethnicity, age and baseline hospitalization status (Van Dorn et al. Reference Van Dorn, Desmarais, Grimm, Tueller, Johnson, Sellers and Swartz2016).
Factor scores were estimated using expected a posteriori (EAP) estimates. EAP estimates were calculated as the mean of the posterior predicted distribution of scores. Factor scores accounted for incomplete data and were based on the items to which the participant responded. Factor scores were estimated separately for each factor and were created for each participant at each assessment.
An ACL model was fit so that each variable was predicted by itself (i.e. autoregressive) and all remaining variables (i.e. cross-lag) from the previous occasion. Parameters were constrained to be equal across time and the ACL model had a time lag of 1 month. Thus, all effects represent the association between a leading indicator and a subsequent effect over a 1-month period. If a study had a longer lag, latent variables (Grimm & Ram, Reference Grimm and Ram2009) were included so that the lag between variables was 1 month. That is, the effects of a 1-month interval are different from those from a 6-month interval (e.g. if the 1-month effect is β, then the 6-month effect is β 6). To evaluate whether each variable was a leading indicator of changes in other variables, sensitivity analyses were conducted where each variable's cross-lag effects were set to 0. The fit of these analyses was compared to determine if setting the cross-lag parameters to 0 harmed model fit. All effects within the ACL model and within each sensitivity analysis are estimated simultaneously. Because of the number of effects, we used a Benjamini and Hochberg adjustment, which is a false discovery rate adjustment for p values, and is more appropriate than, for example, family-wise error rate adjustments (Glickman et al. Reference Glickman, Rao and Schultz2014).
Sensitivity analyses via multiple group ACL models were fit with sex, age (median split), race (white, non-white) and diagnosis (schizophrenia, all other diagnoses) to determine whether effects were similar across groups. We reduced the number of variables in these analyses ensuring that each group had observed data on each variable. For each grouping variable, the analysis was conducted twice. First, autoregressive and cross-lag parameters were constrained to be equal across groups; second, parameters were estimated freely for each group. −2 Times the log likelihood (−2LL) and Bayesian and Akaike's information criteria were used to determine the effect of relaxing the equality constraint.
In the integrated data, missingness was due primarily to study, reflecting both missing completely at random (MCAR) and missing at random (MAR) processes – MCAR attributable to different study designs, including variation in assessments, and MAR attributable to attrition. To assess whether the MAR assumption was reasonable, we regressed counts of missing data on other available variables. No clinical variables were related to missingness. Of the demographic variables, race was related to missingness, but was found to be invariant in prior analyses, supporting the MAR assumption (Van Dorn et al. Reference Van Dorn, Desmarais, Grimm, Tueller, Johnson, Sellers and Swartz2016).
Results
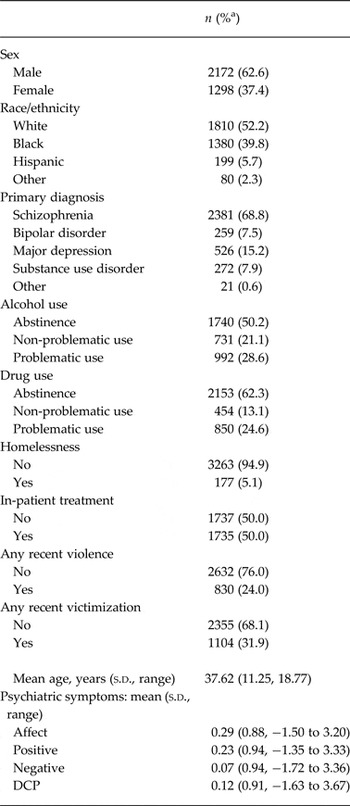
Participants’ baseline characteristics are presented in Table 1. Unstandardized ACL effects are displayed in Table 2 and the corresponding standardized effects (i.e. partial correlations as an indicator of effect size) are presented in online Supplementary Table S1. Online Supplementary Tables S2–S5 display results from the multiple group models based on sex, race, diagnosis and age, respectively.
Participant characteristics at baseline (n = 3473)

s.d., Standard deviation; DCP, disorganized cognitive processing.
a Valid percentage.
Unstandardized autoregressive cross-lagged results organized by outcome a

s.e., Standard error.
a The autoregressive effect (i.e. the effect of an indicator on its subsequent self) is the first indicator presented, followed by the cross-lagged effects (i.e. all remaining leading indicators on the subsequent outcome).
b p Values are Benjamini–Hochberg adjusted.
The unstandardized effects, as they generalize across the pooled data, are described below and ordered by outcome. The first effect listed under each outcome is the autoregressive effect followed by all cross-lagged effects. Only effects with a Benjamini and Hochberg-adjusted p value less than 0.05 are considered statistically significant.
Leading indicators of violent events
Violence perpetration was positively indicated by both itself and violent victimization. Affective symptoms and drug use increased the likelihood of subsequent violence perpetration, while disorganized cognitive processing symptoms decreased the likelihood of subsequent violence perpetration. Violent victimization was positively indicated by itself and violence perpetration, in addition to affective symptoms and alcohol use. Disorganized cognitive processing and negative symptoms were associated with a decreased likelihood of subsequent violent victimization.
Leading indicators of psychiatric symptoms
Positive symptoms and in-patient treatment were associated with subsequent affective symptoms whereas disorganized cognitive processing symptoms had an inverse relationship with later affective symptoms. Negative and disorganized cognitive processing symptoms were associated with experiencing subsequent positive symptoms whereas victimization and alcohol use were associated with fewer positive symptoms during the next assessment period. Positive and disorganized cognitive processing symptoms and in-patient treatment were associated with experiencing subsequent negative symptoms while victimization, affective symptoms and homelessness were inversely related to later negative symptoms. Positive and negative symptoms increased subsequent disorganized cognitive processing symptoms, while victimization, affective symptoms and alcohol use were inversely related to subsequent disorganized cognitive processing symptoms. All symptom factors in one period were associated with the same symptom factors in subsequent periods.
Leading indicators of substance use
Any substance use (i.e. alcohol or drug use) in one period was associated with substance use in the next time period. Being violently victimized or experiencing affective symptoms also increased one's subsequent use of alcohol whereas perpetrating violence or being homeless increased the likelihood of subsequent drug use. No psychiatric symptoms increased either alcohol use or drug use.
Leading indicators of homelessness and in-patient treatment
Violent victimization, alcohol or drug use, or an in-patient hospitalization increased the likelihood of subsequent homelessness. Only negative symptoms were associated with a decreased risk of homelessness. The likelihood of subsequent in-patient hospitalization was increased by affective and negative symptoms and homelessness. As with all other effects, homelessness and in-patient treatment were associated with both outcomes at the next assessment.
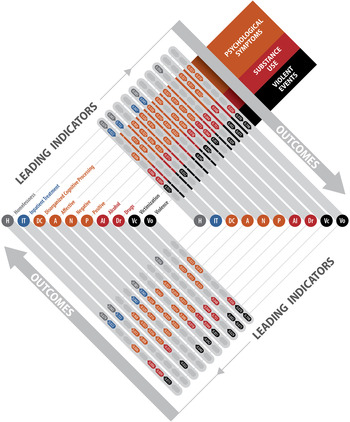
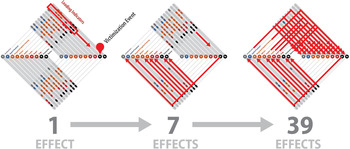
Fig. 1 displays the significant effects from Table 2. Fig. 2 presents a cumulative depiction of violent victimization as an outcome, then a leading indicator itself, then finally part of a recursive model over time. In Fig. 2, six leading indicators are shown to affect the likelihood of experiencing violent victimization (panel 1); from there, violent victimization affects the likelihood of seven outcomes (panel 2); these seven factors subsequently affect the likelihood of 39 outcomes (panel 3).
Graphical depiction of leading indicators and outcomes of violent events over time among adults with mental illness. β Values shown indicate significant effects from Table 2.

Detailed overview of the leading indicators of and outcomes associated with violent victimization over time from Table 2 and Fig. 1.

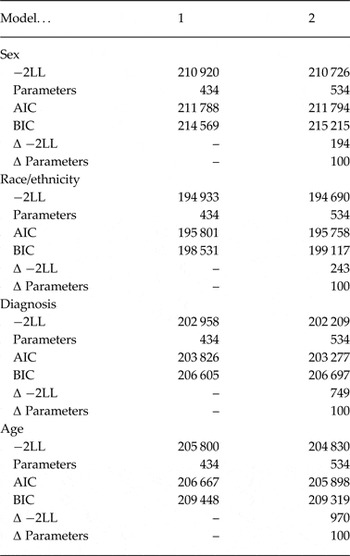
Group-based results are displayed in Table 3. These results indicate that the best-fitting models were consistent across participant sex and race. However, some diagnosis and age differences were present, as seen by larger changes in the −2LL values. Multiple group results are available in online Supplementary Tables S2–S5.
Effects of patient characteristics on fully cross-lagged results

−2LL, −2 Times log likelihood; AIC, Akaike's information criterion; BIC, Bayesian information criterion.
Cross-lagged model fit statistics (Supplementary Table S6) showed that removing any variable as a leading indicator reduced model fit, suggesting that all variables served as a leading indicator over time. Also, and based on our decision to constrain parameters to be equal across time, it was necessary to assess the stationarity of our data, which we did by examining whether constructs exhibited a constant mean and variance. Within each study, time effects were minimal – R 2 was never greater than 0.0008 – and the residuals of models were constant over time – mean residuals were never associated with time points (p > 0.10 for all outcomes).
Discussion
We explored the interrelationships between community-based violent events, psychiatric symptoms, alcohol use, drug use, homelessness and in-patient treatment over time among adults with mental illness. The most robust relationships were found for the autoregressive parameters. However, even when controlling for autoregressive parameters, many cross-lagged parameters were leading indicators of subsequent effects. For example, violence perpetration was significantly associated with subsequent violent victimization and vice versa. Distinct, but also overlapping, leading indicators were associated with both violent events. Prior drug use increased the likelihood of violence perpetration, whereas alcohol use increased the likelihood of violent victimization. Negative symptoms were inversely associated with victimization and positive symptoms were not directly associated with either violent outcome. Disorganized cognitive processing and affective symptoms were negative and positive leading indicators of both violent events, respectively.
Our findings that affective symptoms are a leading indicator of violent events warrant comment, particularly in the context of prior community-based research. First, few studies have evaluated the lagged effects of symptoms on violence and victimization in the same model, instead choosing to model cross-sectional associations and only one violent outcome at a time. Although cross-sectional models often produce significant associations, results are probably artificially inflated (Kraemer et al. Reference Kraemer, Kazdin, Offord, Kessler, Jensen and Kupfer1997) and provide no information on the nature of subsequent change, which limits clinical utility. Also, given the substantial overlap between violence perpetration and violent victimization (Desmarais et al. Reference Desmarais, Van Dorn, Johnson, Grimm, Douglas and Swartz2014), including both variables in the same model is probably a better representation of the multidetermined and complex social and interpersonal systems in which the outcomes occur. Second, few community studies that have lagged symptoms have identified significant associations with violence, perhaps because the leading indicator is not near enough in time to the outcome (Skeem et al. Reference Skeem, Schubert, Odgers, Mulvey, Gardner and Lidz2006; Odgers et al. Reference Odgers, Mulvey, Skeem, Gardner, Lidz and Schubert2009; Van Dorn et al. Reference Van Dorn, Volavka and Johnson2012). Third, many studies have been underpowered due to low base rates of the outcome or sparse counts in the scaling of psychiatric symptoms. Also regarding symptoms, most prior research has made incorrect assumptions regarding symptom distribution (Rhemtulla et al. Reference Rhemtulla, Brosseau-Liard and Savalei2012), which, in combination with small sample sizes leads to biases in model fit and factor structure (Tueller et al. Reference Tueller, Johnson, Grimm, Desmarais, Sellers and Van Dorn2016).
Our analyses of lagged effects in integrated data, in contrast, revealed that affective symptoms are a positive leading indicator of violent events. Our findings also indicate that affective symptoms are a stronger leading indicator of violence perpetration than either drug or alcohol use. Only when considering violent victimization as an outcome, did substance use, and only alcohol use specifically, produce a stronger association with the subsequent violent event than did affective symptoms. These symptom-based findings, obtained while controlling for levels of substance use, differ from the majority of prior research, which indicates that substance use is a stronger indicator of violence risk among adults with mental illness (Witt et al. Reference Witt, Van Dorn and Fazel2013).
Theory and research suggest that the affective factor (Van Dorn et al. Reference Van Dorn, Desmarais, Grimm, Tueller, Johnson, Sellers and Swartz2016) may both directly and indirectly increase risk for violent events, and provide multiple targets for intervention. For example, anxiety and depression often co-occur with antisocial personality disorder and substance use (Nestor, Reference Nestor2014). Victimization also may increase anxiety, depression and substance use (Grubaugh et al. Reference Grubaugh, Zinzow, Paul, Egede and Frueh2011), and, in turn, substance use may increase guilt feelings (Scheller-Gilkey et al. Reference Scheller-Gilkey, Moynes, Cooper, Kant and Miller2004). Hostility is associated with medication non-compliance, impaired insight and substance use (Lindenmayer et al. Reference Lindenmayer, Liu-Seifert, Kulkarni, Kinon, Stauffer, Edwards, Chen, Adams, Ascher-Svanum and Buckley2009), and poor impulse control can manifest as anger or frustration (Volavka, Reference Volavka2008). Thus, a clinical focus on externalizing (e.g. poor impulse control) and internalizing (e.g. anxiety) affective symptoms through cognitive–behavioral (Denson, Reference Denson2015) and psychopharmacological interventions may decrease risk of violent events.
Regarding psychopharmacological interventions, increased noradrenergic activity, which has been associated with increased aggression (Citrome & Volavka, Reference Citrome and Volavka1997), and can be consequent to stress and anxiety (Volavka, Reference Volavka1999), presents a potential leverage point via adjunctive β-adrenergic blocking agents. Also, poor impulse control is associated with central serotonin deficit (Virkkunen et al. Reference Virkkunen, Nuutila, Goodwin and Linnoila1987), as is early-onset alcoholism (Virkkunen & Linnoila, Reference Virkkunen and Linnoila1990), both of which may be exacerbated by traumatic events (Moberg et al. Reference Moberg, Nordström, Forslund, Kristiansson, Åsberg and Jokinen2011). While there are medication-specific mechanisms of action (e.g. receptor binding), second-generation antipsychotics, particularly clozapine (Citrome et al. Reference Citrome, Volavka, Czobor, Sheitman, Lindenmayer, McEvoy, Cooper, Chakos and Lieberman2001) and to a lesser extent olanzapine, risperidone and others (Volavka et al. Reference Volavka, Czobor, Citrome and Van Dorn2014), with combined 5-HT2A (i.e. serotonergic) and D2 (dopamine) antagonist actions may be more effective in reducing violence than earlier antipsychotics that focused mainly on D2 antagonism.
Regarding substance use, we found that alcohol use and drug use were robust leading indicators of each other, but also that they exerted different effects on violent events. Alcohol and drug use also exhibited overlapping and distinct effects as leading indicators and outcomes of psychiatric symptoms, homelessness and in-patient treatment. For example, affective symptoms were a leading indicator of alcohol use and homelessness was a leading indicator of drug use. These results highlight the importance of disaggregating effects of alcohol and drug use and targeting them separately in interventions (Van Dorn et al. Reference Van Dorn, Volavka and Johnson2012).
Our analyses showed that victimization was a leading indicator of homelessness. The interplay between factors that preceded and were consequent to victimization and homelessness – alcohol and drug use, psychiatric symptoms and in-patient treatment – supports the need for frequent, ongoing, and multi-dimensional risk assessment and management strategies. Finally, in-patient treatment was a positive leading indicator of affective and negative symptoms, and affective and negative symptoms were associated with hospitalization. Rather than concluding that in-patient treatment exacerbates symptoms, it is more likely that those requiring hospitalization are affected by intertwining pre-morbid risk factors, long-standing psychiatric and substance use histories, inconsistent engagement with out-patient services, and poor medication compliance. Nonetheless, these results point to the importance of symptom stability prior to release from care, particularly for affective symptoms, which showed robust associations with both violent events, and effective discharge planning.
Our findings were obtained from integrated data. Although we fit a single ACL model, we also fit multiple group models to examine the effects of leading indicators across patient characteristics. By integrating data and modeling diagnostic heterogeneity, thereby focusing on dimensions of functioning that cross-cut disorders, this study is in keeping with the RDoC framework (Cuthbert & Insel, Reference Cuthbert and Insel2010). Still, group-based results are provided in the online Supplementary Tables.
This study is limited in several ways. Specifically, data on violent events were self-reported, which can be affected by social desirability and recall issues that may be exacerbated by memory deficits or cognitive impairment (Goldman-Rakic, Reference Goldman-Rakic1994). We were unable to disentangle whether violence and victimization occurred at the same time. Across studies, however, violence in self-defense was not coded as violence perpetration. We were unable to determine how psychiatric symptoms immediately prior to or after a violent event may have affected or been affected by the violent encounter. Moreover, some data were collected every 6 months while other data were collected more frequently. Our statistical modeling accounted for these different assessment schedules; however, future research should minimize the time between periods of data collection to improve modeling of dynamic change. Finally, some clinically relevant indicators (e.g. stage of illness) could not be harmonized across studies.
Efforts to destigmatize mental illness rely in large part on the notion that violence is either relatively uncommon in this population or that violence risk can be reduced. While the empirical association between mental illness and violence appears to be modest at best (Van Dorn et al. Reference Van Dorn, Volavka and Johnson2012), this former assumption will be difficult to overcome given the general public's views (Pescosolido et al. Reference Pescosolido, Monahan, Link, Stueve and Kikuzawa1999). Our study, however, demonstrating the reciprocal relationship between violent events, while modeling cross-lagged effects, holds promise for the latter assumption. Specifically, findings suggest that trauma-informed care, cognitive–behavioral and psychopharmacological interventions targeting affective symptoms, integrating psychiatric and substance use treatment, reducing housing instability, and minimizing premature discharges from hospitals should reduce violence perpetration.
We believe the current study also holds implications for research. Specifically, research examining violence and victimization among those with mental illness should move beyond correlational and cross-sectional efforts that demonstrate concomitant relationships (Kraemer et al. Reference Kraemer, Kazdin, Offord, Kessler, Jensen and Kupfer1997) and that are limited in their ability to guide practice strategies. Additionally, in contrast with the recent assertion (Coid et al. Reference Coid, Kallis, Doyle, Shaw and Ullrich2015) that lagged data and resultant statistical models should be abandoned, we believe, as others have argued (Kraemer et al. Reference Kraemer, Kazdin, Offord, Kessler, Jensen and Kupfer1997), that better data, including improved spatio-temporal contiguity (Van Dorn et al. Reference Van Dorn, Volavka and Johnson2012) should be the goal.
In conclusion, to our knowledge, this study represents the largest use of integrated data to examine violent events to date among adults with mental illness. Though the view of this population as dangerous may be slow to change, our results highlight available clinical mechanisms to facilitate that change and to more effectively manage violence risk within a prevention framework, as opposed to a prediction framework.
Supplementary material
The supplementary material for this article can be found at https://doi.org/10.1017/S0033291716003160
Acknowledgements
This paper was based on data from the F-PAD project, supported with federal funds from the NIMH through research grant R01MH063949 and also was supported by the John D. and Catherine T. MacArthur Foundation Research Network on Mandated Community Treatment (principal investigator: Jeffrey W. Swanson, Ph.D.); results from the MacRisk project, supported with funds from the Research Network on Mental Health and the Law of the John D. and Catherine T. MacArthur Foundation, Chicago, IL, and by NIMH grant R0149696 (principal investigator: John Monahan, Ph.D.); results from the SCAP project, supported with funds from Eli Lilly, Inc., through a contract with the MedStat Group (principal investigator: Jeffrey W. Swanson, Ph.D.); results from the MacMandate project, supported with funds from the John D. and Catherine T. MacArthur Foundation Research Network on Mandated Community Treatment (principal investigator: John Monahan, Ph.D.); and results from the CATIE project, supported with federal funds from the NIMH under contract NO1MH90001.
The authors also would like to thank Mr Dayle G. Johnson, of RTI International's Knowledge Translation and Strategic Communication group, for creating the figures used in this paper.
R.A.V.D. developed the paper concept and drafted the report, with assistance from S.L.D.; R.A.V.D. and K.J.G. designed the analyses and R.A.V.D., K.J.G., and K.L.J. prepared the tables and figures. K.J.G. and S.J.T. analysed the data. All authors contributed to the interpretation of the results and participated in the critical revision of the manuscript, and approved the final version.
Declaration of Interest
Funding for this study was provided by the NIMH (award number R01MH093426). The content is solely the responsibility of the authors and does not necessarily represent the official views of the NIMH or the National Institutes of Health.
All authors report no competing interests or conflicts.