Introduction and Vision
We have coined the term ‘agronōmics’ to describe the science of crop production at field and farm scales, and we have previously explained the background of and vision for agronōmics (Kindred et al., Reference Kindred, Sylvester-Bradley, Clarke, Roques, Smillie and Berry2016a). There is a wealth of data already being created on farms with digital technologies. However, these data are not easily amenable to analysis and interpretation either for scientific or commercial purposes. Here we discuss initiatives necessary to exploit the potential value of data arising in the precision farming industry. These comprise:
-
i. Facilitating the sharing of concepts, ideas and experiences between farmers, scientists and students who have common technical interests,
-
ii. Systems of on-farm metrics and records which have appropriate relevance, accuracy and precision to support precise field- and farm-scale crop management and innovation,
-
iii. Easier validation, calibration, collation, screening and communication of field-scale datasets,
-
iv. Protocols and support for field-scale testing and experimentation, and
-
v. Procedures for statistical analysis and interpretation of variation in field-scale datasets such that differences associated with imposed treatments can be ascribed levels of confidence.
Approaches and Datasets:
A series of recent and ongoing research and knowledge exchange projects involving farmers has been initiated as follows:
-
– A Yield Enhancement Network (YEN) was formed in 2012 to facilitate the sharing of concepts and metrics explaining crop performance, and to support innovators seeking to enhance cereal yields (Sylvester-Bradley and Kindred, Reference Sylvester-Bradley and Kindred2014). The YEN employs (i) inter-farm competition to elicit trustworthy field-scale yields and identify successful crops, (ii) crop modelling to estimate biophysical yield potentials, and (iii) crop monitoring and analysis to develop site-specific yield explanations (Sylvester-Bradley et al., Reference Sylvester-Bradley, Kindred, Smillie and Berry2016). Growth of the YEN over its first four seasons has been entirely supported by industry.
-
– The Auto-N project (Kindred et al., Reference Kindred, Hatley, Ginsburg, Catalayud, Storer, Wilson, Hockridge, Milne, Marchant, Miller and Sylvester-Bradley2016b) sought to apply information readily available from digital technologies to support an existing ‘logic’ developed for field-by-field N fertiliser decision making. The Auto-N logic was developed and tested using spatial experiments (both chessboard- and line-trials) established by farmers with farm equipment and harvested with either farm or research (small plot) equipment.
-
– The ‘LearN’ project was initiated in 2013 to address uncertainties affecting management of N nutrition of wheat. It aims to use experience on 18 farms over four seasons to improve their fertiliser N management (Kindred and Sylvester-Bradley, Reference Kindred and Sylvester-Bradley2014). The project uses on-farm trials of several adjacent tramlines to compare 60 kg ha−1 more and 60 kg ha−1 less with the farm’s normal normal rate of applied N. On six farms these line trials are being compared with conventional small plot trials having identical (plus additional) treatments. The farm trials are designed to partition variation in crop performance between season, farm, field and intra-field zone. In addition to crop yield, geo-positioned measurements include soil mineral N, mineralisable N, soil organic matter, soil N%, grain protein content and, where possible, canopy reflectance. Analyses are examining whether these measures have value in predicting likely N requirements and in identifying fields or farms where N requirements are more or less than current recommendation systems would suggest.
-
– As part of the Innovate UK funded Agronōmics project (Kindred et al., Reference Kindred, Sylvester-Bradley, Clarke, Roques, Smillie and Berry2016a), on-farm tramline trials were conducted to test for differences between fungicide products, or high input versus low input crop management systems. Treatments were applied with the farm’s sprayer and yields were measured with the farm’s harvester. Procedures were developed for screening yield data for outliers, spatially reconciling treatment (sprayer) and measurement (harvester) locations, correcting yield data for drift in opposing harvester runs, visual display of ‘cleaned’ data, and Spatial Discontinuity Analysis (Rudolph et al., Reference Rudolph, Marchant, Gillingham, Kindred and Sylvester-Bradley2016) to estimate spatial patterns in treatment effects and attendant levels of confidence.
-
– Also as part of the Innovate UK funded Agronōmics project, a plot scale combine harvester was developed (‘Mach1’) with positioning technology for harvesting small (4 m2) plots of cereals. Whilst primarily being used to measure yield responses to applied nutrients, this was also used to assess patterns of spatial variation in cereal yields.
Experiences, data and outcomes from these projects are considered below in order to infer what developments are needed to enable more widespread and effective agronōmic research.
Experiences and Observations:
Findings included here are intended to cover the main positive and negative ways that existing technologies provide the necessary components of a successful and extendable agronōmic operation, in which farmers and scientists can work together habitually and effectively. These are illustrated with examples taken from the current research projects described above.
i. Farm research networks with common explanatory frameworks:
Whilst for many years the model for agricultural development has been almost entirely top-down (scientist to farmer), a ‘bottom-up’ model has recently been initiated in the UK with the advent of Innovative Farmers and Monitor Farms (Kindred et al., Reference Kindred, Sylvester-Bradley, Clarke, Roques, Smillie and Berry2016a; MacMillan and Benton, Reference MacMillan and Benton2014). Self-help networks have also developed via social media. Thus the availability of successful inter-farm networks is evident, and feasible formation of new networks to focus on specific research issues has been demonstrated by both the YEN and the LearN projects.
Most farmers joining the LearN network expected that the extra work would be worthwhile, given the prospect of achieving a better understanding of the N requirements of crops on their land. A few found the work challenging and felt that they needed more compensation. Crucially almost all farms in the LearN network successfully completed their tramline trials. This can be attributed to allocation of ‘supporters’ from research and industry organisations who assisted with treatment allocation, logistics, harvesting and data transfer. Yield data retrieval has proved particularly challenging for all concerned in LearN and significant time has been required from supporters to help growers with a range of different harvesters and software. Annual workshops have been valued by all participants, providing opportunities for discussion between growers, as well as with the scientists running the project. Overall, LearN has shown that growers on modern UK arable farms generally find tramline experimentation achievable and worthwhile, accepting that there will often be a need for significant technical support.
A larger number of farmers (increasing from 20 in 2013 to 100 in 2016) have been working jointly in the YEN to develop yield enhancing innovations. Crucially, effective evaluation of ideas by YEN members has required development of an acceptable conceptual framework to explain yields. This has been achieved through estimation of site-specific theoretical ‘potential’ crop yields (for comparison with actual yields) using just simple relationships between solar radiation, available water and crop growth. These have enabled farmers to develop basic explanations of their crops’ performance, so supporting joint reasoning in terms of radiation capture and conversion on their farms, as exemplified by Hoyles and Lamyman (Reference Hoyles and Lamyman2015). It is noteworthy that, despite the multiplicity of quantitative crop models developed in science, almost no such models are used in commercial agronomy; the few models used in the UK for the prediction or analysis of commercial crop performance relate largely to vegetative species e.g. potatoes and sugar beet (e.g. Qi et al., Reference Qi, Ober and Jaggard2012). Indeed, such analysis is rarely more than qualitative. Crop science generally develops complex deterministic simulation models to explain environmental effects on crop performance, but these have proved too inaccurate and undecipherable to be communicated and trusted as guides for husbandry (Sylvester-Bradley et al., Reference Sylvester-Bradley, Semenov, Lawless, Jaggard and Qi2005). Farmers thus largely base their decisions on empirical findings (tradition and experience) which provide little explanatory power and allow little basis for reasoning (Sylvester-Bradley, Reference Sylvester-Bradley1991). Sharing of explanatory concepts between farmers and scientists is crucial to making progress through agronōmics.
ii. Metrics and records
The multi-faceted field environment requires multiple descriptors which have hitherto been laborious to observe and collate across farms. However, the advent of electronic recording, often for regulatory or financial auditing purposes, provides a major opportunity to assemble comprehensive multi-field and farm data to describe the agronōme i.e. the field environment with incumbent genotypes, both wanted (crops and ‘beneficials’) and unwanted (pests, etc.).
However, some vital metrics are still not readily available. For example, whilst conventional scientific explanations of crop performance commonly invoke relationships with solar radiation and available water, it is rare for data relating to either of these to be used or even known on UK farms. Indeed, meteorological reporting is commonly in terms of sunshine hours rather than solar radiation, and soil maps define soil associations, soil series and soil textures rather than available water capacities. There is thus sparse basic data for quantitative reasoning about crop growth on farms and we find that the YEN must provide estimates of these de novo.
In addition, many digital metrics often relate poorly to the concepts used in existing science-based reasoning. For example, disease assessments have not yet been automated, so are laborious to make on a field scale, with geo-referencing. Also, geo-referenced crop sensing most commonly measures spectral reflectance expressed as a normalised difference vegetation index (NDVI), whereas for decades canopy function has been explained in science through the Leaf (or Green) Area Index (LAI or GAI), which only relates indirectly and inexactly to NDVI (Carlson and Ripley, Reference Carlson and Ripley1997). Agronōmic data include many other surrogate measures, such as electrical conductance for soil texture (or moisture). Thus their usefulness in supporting explanations will depend on the accuracy with which they can be translated or calibrated, or on the derivation of new more direct explanatory concepts.
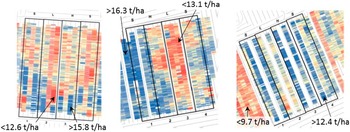
Accurate and precise measurement of crop yield is clearly crucial to the success of agronōmics. Most modern grain harvesters are fitted with global positioning and yield monitors (Defra, 2013), however, accurate calibration is rarely seen as important on farms (Ross et al., Reference Ross, Morris and Johannsen2008). Furthermore, the quality of commercial yield maps is currently poor, even after spatial inconsistencies (e.g. incongruity between treatment and measurement locations) are minimised and measurement artefacts removed (Figure 1), having significant short-scale longitudinal variation and even greater lateral (swath to swath) variation. Also, harvesters that enable effective yield mapping have yet to be widely used for many non-grain arable crops.
Example maps of wheat grain yield after data from commercial harvesters have been cleaned, showing spatial variation and effects of low (L), standard (S) and high (H) N treatments applied by farm spreader to adjacent strips. Scales differ between maps but all show increasing yields from red (dark) through cream (light) to blue (dark), in the ranges shown on each map.

Field size limits how many treatments can be compared using tramline trials; more numerous comparisons must be made with small plots. However, yields determined from small plots, as used for conventional field experiments, also have their flaws; smallness compromises their representativeness (e.g. of the whole field), random arrangement of treatments nullifies inferences about how soils affect crops, and yield estimates are often biased (Bloom, Reference Bloom1985) and lack the precision necessary to differentiate commercially important effects. Interestingly, development of Mach1 to automate yield recording of small sub-plots (so as to facilitate dose-response experimentation on grain crops) has shown that repeated, accurate, geo-referenced, on-the-go grain weights display high frequency noise, spatial grain mixing and flow delay (Lark et al., Reference Lark, Stafford and Bolam1997) which can be yield-dependent.
iii. Data sharing and integration
Facilitation of data transfer should be a key aspect of attractive agronōmic data systems. Farm staff commonly lack the time and skills for data transfer and analysis, often being preoccupied with timely completion of harvest, so data transfer may currently be delayed by months. Also, leading manufacturers are only now beginning to implement open-source frameworks for their software (such as ADAPT, Ag Data Application Programming Toolkit; AgGateway, 2017) that ensure interoperability between precision farming systems. Manufacturers must appreciate that agronōmic data acquire value through the speed and ease with which they can be collated, analysed and interpreted. Use of ‘telematics’ to report performance of harvesting machinery (Deere, Reference Deere2016; CLAAS, 2016) demonstrates that prompt and automatic transfer of yield data is eminently feasible. Once collated, agronōmic datasets are large, so a graphical user interface has been developed that enables experimeters to (i) define metrics and units, (ii) assign covariates, (iii) classify successive harvest lines, (iv) correct for offsets of opposing harvest directions, (v) calculate distances e.g. from a boundary, (vi) rotate coordinates, (vii) allocate tramlines and treatments, (viii) remove data from headlands, incomplete harvest lines and outliers, (ix) display spatial variability with standard colour scales and intervals, (x) test for treatment effects statistically, and (xi) display responses, with levels of certainty.
iv. Statistical Analyses
Farmers and scientists have contrasting standards of proof. Science has developed well accepted conventions for the design and conduct of small plot field experiments (e.g. Fisher and Wishart, Reference Fisher and Wishart1930; Little and Hills, Reference Little and Hills1978; Street, Reference Street1990; University of Reading, 2000) with a difference only being accepted as real when estimated to have 95% probability or more.
Differences on-farm are commonly accepted and believed with much less stringency. Indeed, estimates of confidence are seldom made. Whilst concepts of fairness and objectivity may be considered when designing on-farm tests, the values of randomisation and replication are poorly appreciated, and autocorrelation between adjacent comparisons is over-looked in judging the confidence that should be attached to spatial comparisons (e.g. Hicks et al., Reference Hicks, Vanden Heuvel and Fore1997; Lawes and Bramley, Reference Lawes and Bramley2012; Whelan et al., Reference Whelan, Taylor and McBratney2012). It is therefore crucial to the joint (farmer with scientist) interpretation of field-scale digital datasets, that spatial comparisons, and any apparent treatment differences, can be ascribed levels of confidence.
The trials that farmers can employ tend to be systematic rather than randomized so, even if the need for statistical analysis were appreciated, standard design-based tests such as analysis of variance are not applicable. Instead, more sophisticated approaches are required which model underlying variation in yield (or other response variable) and then estimate the probabilities of differences (e.g. between treated areas) being real. We have therefore developed routines for ‘Spatial Discontinuity Analysis’ (SDA; Rudolph et al., Reference Rudolph, Marchant, Gillingham, Kindred and Sylvester-Bradley2016) which can be applied to the commonly available digital data underlying maps of fields, and specifically of fields with trials. SDA can accommodate knowledge of inherent intra-field variation in covariates and provides tests of treatment effects within spatially referenced data, such as from ‘line trials’, whilst it also allows for the inherent autocorrelation between adjacent comparisons. Experience in developing and employing SDA shows that the highly replicated digital data available to precision farmers can markedly improve the certainty of treatment comparisons cf. simple split-field tests. Also, a trade-off is apparent between the precision and spatial resolution (i.e. the length within the strip) of any comparison being made. Overall, with modern harvester technology, the precision of systematic tramline experiments can be an order of magnitude better than that of conventional small plot experiments but precision is markedly affected by treatment allocation and orientation, the magnitude of the underlying (mainly soil) variation in the field, and the precision of the measurement method. Comparisons of spatially well-resolved data from aerial or satellite imagery are far more precise than from the coarser and noisier data generated by modern combine harvesters. It will thus be important to develop best-practice protocols that maximise the efficiency of any agronōmic experimentation.
v. Protocols for agronōmic experimentation
Objective comparisons will not be made on most precision farms (where staffing tends to be minimised and area maximised) unless the requisite extra (on-farm) time and thought are small. Yield tests are seen as far less vital to the success of the farm business than timely crop husbandry, and quick completion of harvest. Many essential aspects of effective agronōmic testing appear complex and time-consuming, even to the adept ‘precision’ farmer. Thus, in addition to the provision of a ‘supporter’ as described above, agronōmic experiments depend for their success on the provision of clear and easy guidance, as both text and software.
Initial draft protocols for agronōmic trials have taken the form of simple calendars of actions needed to achieve the best treatment layout, application and measurement of tramline treatments. Best layouts depend particularly on (i) minimising confounding of treatment boundaries with the high swath-to-swath variation seen in yield maps (Figure 1), and (ii) the logistics of treatment application. Harvest areas that run perpendicular to treatment direction achieve far more precise comparisons than harvesting in-line with treatments. However, in-line application and harvesting is the norm, and is easier in most cases. For example, tests of additional, marginal products (e.g. micro-nutrients, or biostimulants) are easier to reorientate than tests of alternative, essential products (e.g. varieties, or fungicides). It is also important that specific procedures are employed to establish validated locations of treatment boundaries.
In-season spatial measurements made simultaneously (e.g. from satellite or aerial imagery) minimise spatial and temporal confounding compared to sequential ground-based assessments (e.g. of yield). As regards yield, we have found a need for compromise between harvesting routines which are efficient for fast completion of the harvest or which maximise confidence in treatment comparisons. For example, whilst they may be difficult to avoid in the rush to complete the harvest (Griffin et al., Reference Griffin, Dobbins, Vyn, Florax and Lowenberg-Deboer2008) care is needed to avoid overlaps between harvester swaths, inconsistent positioning of wheelings within swaths, non-parallel harvesting and opposing harvester directions. These can all compromise confidence in comparisons where inter-treatment boundaries run parallel with the direction of harvesting and other husbandry.
Ultimately, it is likely that widespread adoption of agronōmic experimentation will come from a recognition by machinery manufacturers that easy on-farm testing will maximise the value of the digital geo-referenced data that their products generate, and that most aspects governing the efficiency of agronōmic experimentation are open to automation.
Discussion and Conclusions:
Potentially many spatially referenced data are now available to initiate a partial description of crop performance and these are recorded digitally with sufficient spatial accuracy to support sub-field decision-making. Data sharing is feasible, formation of effective farmer networks is current, and there is a wealth of mature science with appropriate concepts and metrics on which to base and test explanations of most common responses of crops to farm interventions. Thus there is immediate scope to undertake agronōmic research hence to develop and apply agronōmic science. There is also a prospect of fast progress, with multifarious opportunities for commercial and academic development and invention. However, significant technical challenges mean that the pace of progress will depend on the levels of resolve and investment by stakeholders, both commercial and academic; at best, it should be possible within a few years for field-scale datasets to be created routinely with sufficient comprehensiveness, accuracy and precision to account for crop performance in a similar way that data are used nowadays in elite professional sports (e.g. with each footballer able to access records of each pass and position throughout yesterday’s game; Lewis, Reference Lewis2014), but at worst it could take decades before scientists generally trust farmers’ data and farmers trust scientists’ predictions.
In general, our conclusions are that, to maximise agricultural progress, we must have aspirations for it to be:
-
i. Commonplace for parties interested in a particular aspect of crop production (farmers, suppliers, scientists, and students) to exchange ideas, experiences and records in virtual arenas, sometimes supported by ‘in-person’ networking,
-
ii. A natural outcome of these exchanges that questions are tested at a relevant scale,
-
iii. The norm for manufacturers of machinery and instrumentation to fully appreciate the inferences, and levels of accuracy and precision, required of their products in order to test the questions being posed, and
-
iv. Automatic (and quick) for on-farm datasets to be transferred, cleaned, collated, analysed (by competent personnel) and displayed, on the short timescales required by crop managers, their suppliers and other innovators.
Acknowledgements:
Whilst development of the agronōmics concept has been initiated and led by ADAS, we are most grateful to colleagues and partners in many collaborating organisations and projects without whom agronōmics could not have arisen. These include the Agronōmics Project [led by ADAS UK Ltd. and with AgSpace, BASF UK Ltd, Trials Equipment Ltd., VSN International and the British Geological Survey, and co-funded by Innovate UK], the YEN [led by ADAS, sponsored by Adama, Agrimetrics, AgSpace, AHDB, Bayer, De Sangosse, Hutchinsons, Limagrain, nabim, NIAB, NRM, Rothamsted Research, Syngenta and Yara, and with numerous farmers and their advisors], the LearN project [led by ADAS with partners NIAB, Agrii and CF Fertilisers, involving 18 farmers, and funded by AHDB], and the Auto-N project [sponsored by Defra LINK with AHDB co-funding, led by ADAS with AgLeader, Agrii, BASF, Farmade, FOSS, Hill Court Farm Research, NIAB, Precision Decisions, Rothamsted Research, Soil Essentials, SOYL, Yara, Zeltex and involving 5 farmers].