


1. Introduction
Dusty stellar sources play a fundamental role in the life cycle of galaxies by returning heavy elements to the interstellar medium. These objects include young stellar objects (YSOs), which trace ongoing star formation, as well as evolved stars such as asymptotic giant branch (AGB) stars, red supergiants (RSGs), and post-AGB stars (PAGBs) (Abdollahi et al. Reference Abdollahi, Javadi and Mirtorabi2023; Boyer et al. Reference Boyer, Srinivasan and van Loon2011, Reference Boyer, Sloan and Nanni2025; Mahani et al. Reference Mahani, Javadi and van Loon2025; Höfner & Olofsson Reference Höfner and Olofsson2018; Javadi et al. Reference Javadi, van Loon and Mirtorabi2011, Reference Javadi, van Loon and Khosroshahi2013, Reference Javadi, Saberi and van Loon2015).
Because of the high luminosities and red colors of dusty stellar sources, these populations are particularly well traced in the Magellanic Clouds (MCs), two nearby dwarf galaxies with low metallicities (Russell & Dopita Reference Russell and Dopita1992; Cioni Reference Cioni2009; Pietrzyński et al. Reference Pietrzyński, Graczyk and Gieren2013; Subramanian & Subramaniam Reference Subramanian and Subramaniam2011), making them ideal laboratories for studying dusty stellar evolution.
Traditionally, the identification of such objects has relied on photometric surveys using color-magnitude diagrams (CMDs) and infrared excesses. While photometry enables the construction of large catalogs at relatively low observational cost, it suffers from ambiguities: distinct stellar classes can occupy overlapping regions in photometric space. In contrast, spectroscopy provides a more secure diagnostic by revealing the chemical and physical properties of stellar atmospheres and circumstellar dust, but spectroscopic surveys are much more limited in size.
With the growing availability of both photometric and spectroscopic datasets from surveys such as the Spitzer SAGE and SAGE-Spec programs (Kemper et al. Reference Kemper, Woods and Antoniou2010; Woods et al. Reference Woods, Oliveira and Kemper2011; Ruffle et al. Reference Ruffle, Kemper and Jones2015; Jones et al. Reference Jones, Woods and Kemper2017), it has become possible to directly assess the reliability of photometric classifications by comparing them with spectroscopic benchmarks.
Unsupervised machine learning has also been applied in this context; for example, Pennock et al. (Reference Pennock, van Loon and Anih2022) used t-distributed Stochastic Neighbour Embedding (t-SNE) to identify sources dominated by AGN-dust emission in regions of the sky that include the Magellanic Clouds. In contrast, our study relies exclusively on supervised learning, training models on spectroscopically confirmed sources and then applying them to large photometric catalogs.
Machine learning provides a powerful means of conducting such comparisons (Baron Reference Baron2019). In this study, we used supervised models trained on spectroscopic labels of dusty stellar populations in the MCs (Ghaziasgar et al. Reference Ghaziasgar, Abdollahi and Javadi2024, Reference Ghaziasgar, Masoudnezhad and Javadi2025a,b). The tested algorithms, as described in Ghaziasgar et al. (Reference Ghaziasgar, Masoudnezhad and Javadi2025b), included Probabilistic Random Forest (PRF), Random Forest (RF), K-Nearest Neighbors (KNN), C-Support Vector Classification (SVC; polynomial and RBF kernels), and Gaussian Naive Bayes (GNB). Among these, PRF (Reis et al. Reference Reis, Baron and Shahaf2019; Kinson et al. Reference Kinson, Oliveira and van Loon2021, Reference Kinson, Oliveira and van Loon2022; Pennock et al. Reference Pennock, van Loon and Cioni2025) provided the best performance, as it naturally accounts for uncertainties in both features and labels. By comparing the labels predicted by the model trained on spectroscopic labels and photometric labels, we aimed to quantify both the strengths and the limitations of photometric classification, especially for less numerous or overlapping stellar classes.
2. Data and Method
The spectroscopic dataset originates from the SAGE-Spec program and archival Spitzer/IRS observations, encompassing more than 600 dusty stellar sources in the LMC and SMC (Kemper et al. Reference Kemper, Woods and Antoniou2010; Woods et al. Reference Woods, Oliveira and Kemper2011; Ruffle et al. Reference Ruffle, Kemper and Jones2015; Jones et al. Reference Jones, Woods and Kemper2017). These sources were spectroscopically labeled into five classes: YSO, CAGB, OAGB, RSG, and PAGB.
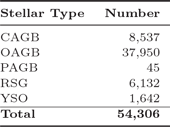
For the photometric sample (Table 1), we compiled catalogs from major surveys of the LMC and SMC (Whitney et al. Reference Whitney, Sewilo and Indebetouw2008; Srinivasan et al. Reference Srinivasan2009; Gruendl & Chu Reference Gruendl and Chu2009; Riebel et al. Reference Riebel, Meixner and Fraser2010; Boyer et al. Reference Boyer, Srinivasan and van Loon2011; Kamath et al. Reference Kamath, Wood and Van Winckel2014, Reference Kamath, Wood and Van Winckel2015; Yang et al. Reference Yang, Bonanos and Jiang2018, Reference Yang, Bonanos and Jiang2019, Reference Yang, Bonanos and Jiang2020, Reference Yang, Bonanos and Jiang2021). Photometric classifications are generally based on positions in CMDs and infrared excess, but they may suffer from ambiguities where stellar classes overlap. We cross-matched the photometric catalogs with the spectroscopic set, removed duplicates, and applied the same preprocessing steps (feature selection, imputation, extinction, and distance corrections) as described in Ghaziasgar et al. (Reference Ghaziasgar, Masoudnezhad and Javadi2025b).
Photometric classification of dusty stars in the Magellanic Clouds after cross-matching all catalogs and removing duplicates.

Table 1 Long description
The table presents the number of stars categorized by their stellar type in a photometric sample. It has two columns: Stellar Type and Number. The Stellar Type column lists different types of stars, and the Number column lists the count of stars for each type. The table includes the following data: Row 1: CAGB, 8,537; Row 2: OAGB, 37,950; Row 3: PAGB, 45; Row 4: RSG, 6,132; Row 5: YSO, 1,642; Row 6: Total, 54,306.
To assess the reliability of the photometric classifications reported in those mentioned above, we apply models trained on spectroscopic labels presented by Ghaziasgar et al. (Reference Ghaziasgar, Abdollahi and Javadi2024, Reference Ghaziasgar, Abdollahi and Javadi2025b). As discussed earlier, several models were tested and validated, and the probabilistic random forest (PRF) model was ultimately identified as the best performer.
3. Comparison Results
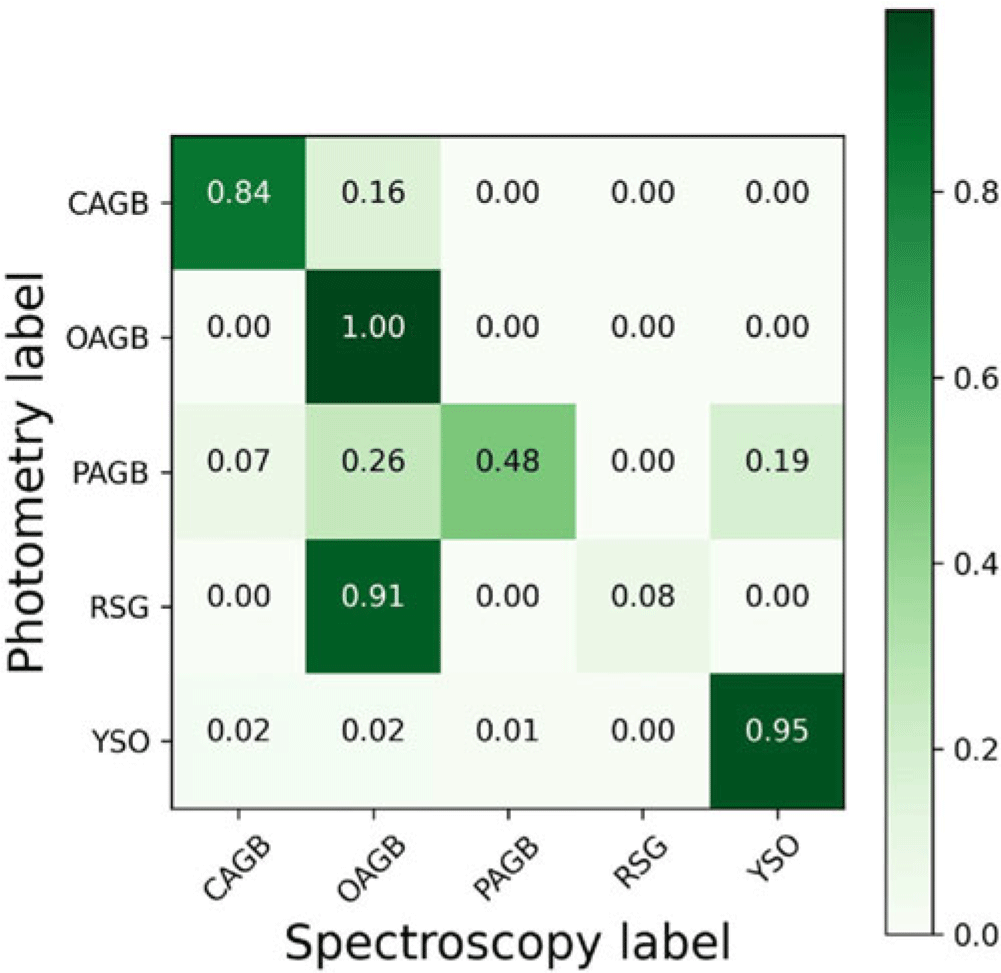
The comparison between the predicted data and the photometric labels reveals that oxygen-rich AGB stars are almost perfectly recovered, and young stellar objects show a high confirmation rate of about 95%. In contrast, roughly 16% of carbon-rich AGB stars are reassigned as OAGBs, reflecting overlaps in CMD space. Red supergiants are particularly problematic: only about 8% of photometric RSG labels are confirmed, with most misclassified as OAGBs. Post-AGB stars show the highest variability, with fewer than half confirmed. A more detailed view of these misclassifications, based on confusion matrices for each class, is presented in Figure 1.
Confusion matrix comparing photometric and spectroscopic labels.

Overall, photometric classification is reliable for abundant populations with distinctive infrared signatures, such as OAGBs and YSOs; however, it is less effective for rare or overlapping stellar classes. These results underscore the importance of spectroscopic confirmation in such cases, as well as the value of spectroscopically trained machine learning models in refining large photometric catalogs.