



1 Introduction
The interactions between compliant surfaces and laminar or turbulent boundary layers have been the subject of numerous investigations over the past 60 years owing to their presumed effects on laminar to turbulent transition, skin friction, as well as noise and vibrations (Bushnell, Hefner & Ash Reference Bushnell, Hefner and Ash1977; Riley, Gad-el-Hak & Metcalfe Reference Riley, Gad-el-Hak and Metcalfe1988; Gad-el-Hak Reference Gad-el-Hak1998, Reference Gad-el-Hak2002). Early studies were stimulated by Kramer (Reference Kramer1957, Reference Kramer1962), who reported considerable drag reduction by coating a model with a compliant surface mimicking the skin of dolphins. Subsequent experimental investigations showed mixed results, namely some observed drag reduction (e.g. Fisher & Blick Reference Fisher and Blick1966; Blick & Walters Reference Blick and Walters1968; Choi et al. Reference Choi, Yang, Clayton, Glover, Atlar, Semenov and Kulik1997), but others did not (e.g. Harris & Lissaman Reference Harris and Lissaman1969; McMichael, Klebanoff & Mease Reference McMichael, Klebanoff, Mease and Hough1980). In efforts aimed at explaining the mechanisms involved, the theoretical works of Benjamin (Reference Benjamin1960, Reference Benjamin1963) and Landahl (Reference Landahl1962) suggested that by selecting the flexibility and internal damping of the material, the compliant surface could delay the transition from laminar to turbulent flow. The choice of material properties was critical because the wall compliance could also allow other instability modes to grow and trigger transition.
Many subsequent studies investigated the effect of a compliant surface on boundary layer transition. For example, the theoretical analysis of Carpenter & Garrad (Reference Carpenter and Garrad1985, Reference Carpenter and Garrad1986) divided the flow instability into two categories, namely Tollmien–Schlichting (TS) type instabilities resembling those occurring over a rigid plate, and flow-induced surface instabilities (FISI). The TS waves were stabilized by the wall compliance and destabilized by material damping. The FISI, on the other hand, were destabilized by wall compliance and stabilized by material damping. Lee, Fisher & Schwarz (Reference Lee, Fisher and Schwarz1995) studied the effect of a compliant surface on the stability of the Blasius boundary layer in a wind tunnel. They confirmed that at low Reynolds numbers, when the amplitudes of FISI were small, the wall compliance reduced the growth rate of unstable TS waves. Wang, Yeo & Khoo (Reference Wang, Yeo and Khoo2006) reached the same conclusion based on direct numerical simulation (DNS). Another research direction focused at the interactions between the compliant surface and fully developed turbulent boundary layers. For soft materials, experimental studies revealed the formation of the so-called static-divergence wave (Hansen & Hunston Reference Hansen and Hunston1974; Hansen et al.
Reference Hansen, Hunston, Ni and Reischman1980; Hansen & Hunston Reference Hansen and Hunston1983; Gad-el-Hak, Blackwelder & Riley Reference Gad-el-Hak, Blackwelder and Riley1984). The crests of these waves were aligned in the spanwise direction, and they exhibited low phase speeds (
 ${\sim}0.05U_{0}$
) and high amplitudes of the order of the coating thickness. They appeared when the free-stream velocity was several times larger than the shear wave speed of the compliant coating,
 $c_{t}$
. Formation of such waves usually increased the drag, presumably due to an increase in surface roughness (Hansen & Hunston Reference Hansen and Hunston1974; Gad-el-Hak et al.
Reference Gad-el-Hak, Blackwelder and Riley1984). In the absence of static-divergence waves at speeds lower than the onset level, the tools available to Gad-el-Hak et al. (Reference Gad-el-Hak, Blackwelder and Riley1984) could not detect measurable surface deformation or changes to the mean velocity profile.
The wall deformation detection techniques have improved over the years. Starting with point measurements, Gad-el-Hak et al. (Reference Gad-el-Hak, Blackwelder and Riley1984), Gad-el-Hak (Reference Gad-el-Hak1986) and Hess, Peattie & Schwarz (Reference Hess, Peattie and Schwarz1993) achieved resolutions of approximately
 $20~\unicode[STIX]{x03BC}\text{m}$
and
 $2~\unicode[STIX]{x03BC}\text{m}$
, respectively. They illuminated the compliant surface with a laser beam and recorded the displacement of the light scattered from the interface using magnified imaging. In recent years, the introduction of a laser Doppler vibrometer (LDV) allowed point measurement of surface motion at a nanometre precision (e.g. Castellini, Martarelli & Tomasini Reference Castellini, Martarelli and Tomasini2006; Tabatabai et al.
Reference Tabatabai, Oliver, Rohrbaugh and Papadopoulos2013). Two-dimensional distributions of compliant surface deformations were measured first by Lee, Fisher & Schwarz (Reference Lee, Fisher and Schwarz1993a
,Reference Lee, Fisher and Schwarz
b
) using holographic interferometry. They achieved a sub-micron precision, but having to record the interferograms on films, the data was not time-resolved. Yet, they captured 3D small-amplitude deformation patterns that were different from the static-divergence waves. Since the previous experimental studies did not involve simultaneous measurements of flow field and deformation, interactions could only be inferred based on integrated statistics of mean flow, skin friction and turbulence parameters. To address this challenge, in Zhang, Miorini & Katz (Reference Zhang, Miorini and Katz2015), we introduced a system capable of measuring the time-resolved 3D flow and 2D deformation simultaneously. It was used for obtaining the data presented in this paper, and discussed in detail in the following sections.
Over the past two decades, numerical simulations of interactions of a boundary layer with modelled surface compliance have taken a leading role as a research tool (e.g. Endo & Himeno Reference Endo and Himeno2002; Xu, Rempfer & Lumley Reference Xu, Rempfer and Lumley2003; Kim & Choi Reference Kim and Choi2014; Luhar, Sharma & McKeon Reference Luhar, Sharma and McKeon2015). DNS of a turbulent channel flow (
 $Re_{\unicode[STIX]{x1D70F}}=u_{\unicode[STIX]{x1D70F}}h/\unicode[STIX]{x1D708}=150$
, where
 $u_{\unicode[STIX]{x1D70F}}$
is the friction velocity,
 $h$
is the channel half-height and
 $\unicode[STIX]{x1D708}$
is the liquid kinematic viscosity) over a soft compliant wall modelled as an array of springs and dampers by Endo & Himeno (Reference Endo and Himeno2002) showed a moderate reduction (2.7 %) of the average drag. A subsequent investigation by Xu et al. (Reference Xu, Rempfer and Lumley2003) at
 $Re_{\unicode[STIX]{x1D70F}}=137$
, which modelled the wall in a similar manner, found little change in the averaged skin friction. Simulations by Kim & Choi (Reference Kim and Choi2014) at
 $Re_{\unicode[STIX]{x1D70F}}=138$
concluded that for a soft wall, large-amplitude quasi-2D surface waves form and travel downstream at a phase speed of less than 40 % of the centreline velocity. Their amplitude and shape were consistent with those of the static-divergence waves, but their celerity was higher. For stiffer walls, their deformation patterns became more complex, and travelled at 72 % of the centreline velocity. In both cases, there was no drag reduction. Luhar et al. (Reference Luhar, Sharma and McKeon2015) used a reduced-order model based on the resolvent analysis introduced by McKeon & Sharma (Reference McKeon and Sharma2010) for the flow and modelled the compliant wall effect using a boundary with complex admittance. They showed that an unphysical negative material damping was required for the compliant surface to interact favourably in terms of Reynolds stress distributions with the near-wall motions. Positive damping was only effective for modes representing very-large-scale motions. In parallel, substantial effort was invested in modelling, computing and measuring the response of compliant walls to pressure and shear perturbations (e.g. Duncan, Waxman & Tulin Reference Duncan, Waxman and Tulin1985; Duncan Reference Duncan1986; Ko & Schloemer Reference Ko and Schloemer1989; Chase Reference Chase1991). These studies focused on the material dynamics, and did not involve flow simulations. Yet, they provided considerable insight on effects of layer thickness and material properties, such as the Young and shear moduli as well as the so-called loss tangent, on the response of the wall to prescribed forcing. The Helmholtz-equation-based analysis by Chase (Reference Chase1991) was particularly relevant to the present study, and was instrumental for elucidating many of the observations. Hence, it is summarized briefly in appendix A.
As a general observation, the mechanisms dominating the compliant wall–flow interactions in high-Reynolds-number turbulent boundary layers have not been elucidated yet. The experimental studies could not resolve them, and even the most recent computational investigations replaced the wall with simplified models. To advance the state of knowledge, in Zhang et al. (Reference Zhang, Miorini and Katz2015), we integrated time-resolved tomographic particle image velocimetry (TPIV) for measuring the flow (Elsinga et al. Reference Elsinga, Scarano, Wieneke and van Oudheusden2006; Scarano Reference Scarano2013) and Mach–Zehnder interferometry (MZI) (e.g. Hecht Reference Hecht2002) for mapping the corresponding 2D distribution of compliant wall deformation. Section 2 briefly describes the experimental set-up, measurement procedures and uncertainties. For the present analysis, we also calculated the 3D pressure distribution by spatially integrating the material acceleration (Liu & Katz Reference Liu and Katz2006, Reference Liu and Katz2008, Reference Liu and Katz2013; Joshi, Liu & Katz Reference Joshi, Liu and Katz2014). A brief summary of the GPU-based procedure is provided in appendix B. Other approaches for calculating the pressure based on solutions to the Poisson equation were presented in, for example, Baur & Köngeter (Reference Baur and Köngeter1999), Gurka et al. (Reference Gurka, Liberzon, Hefetz, Rubinstein and Shavit1999), Koschatzky et al. (Reference Koschatzky, Moore, Westerweel, Scarano and Boersma2011), Ghaemi, Ragni & Scarano (Reference Ghaemi, Ragni and Scarano2012), de Kat & van Oudheusden (Reference de Kat and van Oudheusden2012) and Ghaemi & Scarano (Reference Ghaemi and Scarano2013), and compared by Charonko et al. (Reference Charonko, King, Smith and Vlachos2010). Utilizing these techniques, our objective is to investigate how the flow and pressure fields affect the surface deformation in a channel flow at moderately high Reynolds number. The current wall is stiffer than those previously tested in studies attempting to reduce the wall friction, resulting in surface deformations that do not involve static-divergence waves.
Section 3 presents the main findings of this paper. First, the dynamics of pressure and surface deformation are characterized in the frequency domain and by examining their wavenumber–frequency spectra. Based on the results, the deformation is divided into advected and non-advected modes, and most of the subsequent analysis focuses on the latter. Conditional sampling and correlations involving the distributions of deformation, pressure, as well as velocity and vorticity components are used for identifying key flow phenomena affecting the advected modes. This conditional analysis identifies flow structures associated with positive (bumps) and negative (dimples) surface deformations. It also shows that dominant flow features affecting the deformation reside in the log-layer. Causes for phase lag between, for example, pressure and deformation peaks are elucidated based on the material properties and spatial characteristics of near-wall turbulence. Concluding remarks along with conceptual models identifying the dominant flow structures and their spatial relationship with the deformation fields are summarized in § 4.
2 Facility, experimental set-up and measurement procedures
2.1 Test facility
The experiments have been performed in an acrylic channel extended from the optically index-matched facility at Johns Hopkins University. Detailed descriptions of this channel are documented in several previous publications (Hong, Katz & Schultz Reference Hong, Katz and Schultz2011; Hong et al.
Reference Hong, Katz, Meneveau and Schultz2012; Talapatra & Katz Reference Talapatra and Katz2012, Reference Talapatra and Katz2013; Joshi et al.
Reference Joshi, Liu and Katz2014; Zhang et al.
Reference Zhang, Miorini and Katz2015). Figure 1 is a sketch of the relevant parts of the channel extension drawn not to scale. Its overall internal dimensions are
 $3300\times 50.8\times 203.2~\text{mm}^{3}$
in the streamwise,
 $x$
, wall-normal,
 $y$
, and spanwise,
 $z$
, directions, respectively. The corresponding instantaneous velocity components are denoted as
 $u$
,
 $v$
and
 $w$
, respectively. Upstream of the channel, a settling chamber containing honeycombs and screens followed by a nozzle with area ratio of
 $4:1$
is used for controlling/reducing the inflow turbulence level. Pressure taps on both sides of the nozzle are also used for monitoring the mean speed. On the downstream side, a mild diffuser with expansion angle of less than
 $7^{\circ }$
links the channel with the main loop. The channel has four removable windows spanning its entire width, two on the top and two on the bottom, for installing walls with different shapes, roughness, and material properties. In the present investigation, the compliant wall is installed in the bottom downstream window, while the other three windows are mounted with rigid acrylic plates.
Schematic of the test section and location of the sample volume (drawn not to scale). All dimensions are in mm.

The wall consists of a homogeneous layer of transparent polydimethylsiloxane (PDMS) with thickness of
 $l_{0}=$
16 mm attached to a 9 mm thick acrylic wall. This silicon rubber layer is 1250 mm long in the
 $x$
-direction, and it spans the entire width of the channel (203.2 mm). The leading edge of this layer is located 1900 mm (
 $75h$
) downstream of the channel entrance, where
 $h$
(
 $=25.4~\text{mm}$
) is the channel half-height. The detailed procedures for moulding this compliant layer directly on the acrylic base in a special vacuum chamber with polished flat acrylic walls are described in Zhang et al. (Reference Zhang, Miorini and Katz2015). The mechanical properties of the PDMS have been measured by a Rheometrics Solids Analyzer (RSA II) using another moulded sample of the same material, curing temperature and base-to-curing agent ratio. The frequency-averaged (0.1–12 Hz) storage modulus,
 $E^{\prime }$
, is 0.93 MPa and the loss modulus,
 $E^{\prime \prime }$
, is 0.07 MPa. The density of the PDMS,
 $\unicode[STIX]{x1D70C}_{c}$
, is
 $1.03\times 10^{3}~\text{kg}~\text{m}^{-3}$
. The Poisson’s ratio,
 $\unicode[STIX]{x1D70E}$
, has not been measured, but based on Mark (Reference Mark1999), it is expected to be 0.5. The resulting shear modulus, estimated using
 $G=E^{\prime }/2(1+\unicode[STIX]{x1D70E})$
is 0.31 MPa, and the shear wave speed calculated from
 $c_{t}=(G/\unicode[STIX]{x1D70C}_{c})^{1/2}$
is
 $17~\text{m}~\text{s}^{-1}$
. The magnitude of
 $c_{t}$
is significantly higher than the channel centreline velocity during the present experiments (
 $2.5~\text{m}~\text{s}^{-1}$
), implying that this material falls in the ‘stiff wall’ category. Hence, large-amplitude static-divergence waves are not expected to develop.
The working fluid in the channel is an aqueous solution of sodium iodide (NaI, 62 % by weight). The fluid density,
 $\unicode[STIX]{x1D70C}$
, and kinematic viscosity,
 $\unicode[STIX]{x1D708}$
, are
 $1.8\times 10^{3}~\text{kg}~\text{m}^{-3}$
and
 $1.1\times 10^{-6}~\text{m}^{2}~\text{s}^{-1}$
, respectively, and its refractive index,
 $n_{NaI}$
, is 1.493. This refractive index is very close to that of the acrylic, which minimize light reflection at the rigid channel wall. However, it is also different from that of the compliant material (
 $n_{PDMS}=1.413$
), which is crucial for measuring surface deformation using interferometry. In the present experiments, the channel centreline velocity,
 $U_{0}$
, is
 $2.5~\text{m}~\text{s}^{-1}$
, and the friction velocity,
 $u_{\unicode[STIX]{x1D70F}}$
, determined from a linear fit of the total shear stress profile, is
 $0.102~\text{m}~\text{s}^{-1}$
(Zhang et al.
Reference Zhang, Miorini and Katz2015). The resulting viscous length scale,
 $\unicode[STIX]{x1D6FF}_{\unicode[STIX]{x1D708}}=\unicode[STIX]{x1D708}/u_{\unicode[STIX]{x1D70F}}$
, is
 $11~\unicode[STIX]{x03BC}\text{m}$
, and the corresponding time scale,
 $\unicode[STIX]{x1D70F}_{\unicode[STIX]{x1D708}}=\unicode[STIX]{x1D708}/u_{\unicode[STIX]{x1D70F}}^{2}$
, is 105.7
 $\unicode[STIX]{x03BC}$
s. The friction Reynolds number,
 $Re_{\unicode[STIX]{x1D70F}}$
, is 2300. Following the usual convention, a superscript
 $+$
is used to denote quantities normalized by
 $u_{\unicode[STIX]{x1D70F}}$
and
 $\unicode[STIX]{x1D70F}_{\unicode[STIX]{x1D708}}$
.
Optical set-up for the combined tomographic PIV and MZI system. Reprinted with permission from Springer.

2.2 Velocity and pressure measurements
The experimental set-up for the integrated time-resolved TPIV and MZI measurements is illustrated in figure 2. Detailed descriptions of this system and data analysis procedures, especially those involving MZI, are provided in Zhang et al. (Reference Zhang, Miorini and Katz2015). This section describes the main components briefly. Background on TPIV can be found in, for example, Elsinga et al. (Reference Elsinga, Scarano, Wieneke and van Oudheusden2006) and Scarano (Reference Scarano2013), and applications in boundary layers and channel flows are discussed in, for example, Schröder et al. (Reference Schröder, Geisler, Elsinga, Scarano and Dierksheide2008, Reference Schröder, Geisler, Staack, Elsinga, Scarano, Wieneke, Henning, Poelma and Westerweel2011), Atkinson et al. (Reference Atkinson, Coudert, Foucaut, Stanislas and Soria2011) and Schäfer et al. (Reference Schäfer, Dierksheide, Klaas and Schröder2011). The present
 $30\times 10\times 10~\text{mm}^{3}$
(
 $2778\times 926\times 929\unicode[STIX]{x1D6FF}_{\unicode[STIX]{x1D708}}^{3}$
) sample volume in the
 $x$
,
 $y$
and
 $z$
directions, respectively, is located 1010 mm (
 $39.8h$
) downstream of the leading edge of the compliant wall and 2910 mm (
 $114.6h$
) from the entrance of the channel. These length scales allow the flow to develop to nearly a fully developed state before reaching the sample volume, consistent with criteria provided by Antonia & Luxton (Reference Antonia and Luxton1971), and in agreement with measurements performed in the same channel over a rough wall by Hong et al. (Reference Hong, Katz and Schultz2011). However, the channel is not sufficiently long to reach a ‘fully developed’ state based on the mean velocity measurements of Monty (Reference Monty2005). Furthermore, as discussed in Dean (Reference Dean1978), Monty (Reference Monty2005) and Hong et al. (Reference Hong, Katz and Schultz2011), the
 $4:1$
aspect ratio of the cross-section is not sufficient for establishing a 2D channel flow free of side effects. The flow field is illuminated at 6 kHz using a Photonics model DM60-527 Nd:YLF laser. The beam is expanded into a thick slab, and mirror M1 with back-polished surface, which serves as a beam splitter, directs 99.9 % of the light to the sample volume. Mirror M3 located under the channel reflects the majority of the laser energy back to the sample volume to increase the illumination intensity. The 6 kHz images are recorded at a resolution of
 $1200\times 600~\text{ pixel}$
by four high-speed cameras (pco.dimax) located on both sides of the channel at the same elevation as the sample volume. Recording images through an air–acrylic interface at large angle of incidence causes undesired optical distortions, such as astigmatism. The astigmatism is minimized when the lens axis is perpendicular to the interface, achieved by attaching acrylic prisms to the channel wall. The cameras are inclined relative to the lenses by the Scheimpflug angles to maintain all the sample volume in focus.
The flow is seeded with silver-coated hollow glass spheres. The mean particle diameter,
 $d_{p}$
, is
 $13~\unicode[STIX]{x03BC}\text{m}$
(
 $d_{p}^{+}=1.2$
), and its density,
 $\unicode[STIX]{x1D70C}_{p}$
, is
 $1.6\times 10^{3}~\text{kg}~\text{m}^{-3}$
. The corresponding particle relaxation time
 $\unicode[STIX]{x1D70F}_{s}=d_{p}^{2}\unicode[STIX]{x1D70C}_{p}/(18\unicode[STIX]{x1D70C}\unicode[STIX]{x1D708})$
is
 $7.6~\unicode[STIX]{x03BC}\text{s}$
, and the Stokes number,
 $\unicode[STIX]{x1D70F}_{s}/\unicode[STIX]{x1D70F}_{\unicode[STIX]{x1D708}}$
, is
 $7.2\times 10^{-2}$
. Thus, except for elevations that are comparable to or smaller than
 $d_{p}$
, where the scale of characteristic flow features is of the same order as the particle diameter, the particles are expected to follow the turbulent channel flow. The two-step calibration procedure has been performed before reconstructing 3D particle positions. Following procedures described in Scarano (Reference Scarano2013), in the first step, a 2D target plate made from perforated metal sheet is placed inside the channel and translated in the
 $z$
-direction over the entire width of the sample volume (10 mm). Images of this target plate are used to generate a ‘coarse’ mapping function, for projecting the coordinates in the 3D space to the 2D camera planes. In the second step, this mapping function is refined by volume self-calibration (Wieneke Reference Wieneke2008) using actual particle images. The resulting disparity maps show 0.1 voxel uncertainty in locating the particle positions (Zhang et al.
Reference Zhang, Miorini and Katz2015). Subsequently, the instantaneous particle intensity distributions in 3D space are reconstructed using the simultaneous multiplicative algebraic reconstruction technique (SMART, Atkinson & Soria Reference Atkinson and Soria2009) for the first five iterations, and then the CSMART algorithms (private communication with LaVision) for the last two iterations. The reconstructed volume consists of
 $1380\times 638\times 611~\text{voxels}$
, in which a single voxel has a size of
 $18.8~\unicode[STIX]{x03BC}\text{m}$
(
 $1.7\unicode[STIX]{x1D6FF}_{\unicode[STIX]{x1D708}}$
). The particle displacements are calculated using multi-pass direct volumetric cross-correlations between two successive frames. The size of the interrogation volume in the final pass is
 $48^{3}$
voxels (
 $0.905^{3}~\text{mm}^{3}$
,
 $82.3\unicode[STIX]{x1D6FF}_{\unicode[STIX]{x1D708}}$
). Using a 75 % overlap between adjacent windows, we obtain
 $115\times 53\times 51$
vectors per realization with a vector spacing of
 $l=0.226~\text{ mm}$
(
 $l^{+}=20.6$
). This TPIV data analysis procedure is performed using LaVision DaVis 8.1 software package. In later discussions, the vorticity components, as well as the velocity gradient tensor are calculated from the velocity field using second-order central differencing. To identify vortices, the distributions of
 $\unicode[STIX]{x1D706}_{2}$
are also computed, which is the intermediate eigenvalue of
 $\unicode[STIX]{x1D64E}^{2}+\unicode[STIX]{x1D734}^{2}$
, where
 $\unicode[STIX]{x1D64E}$
and
 $\unicode[STIX]{x1D734}$
are the symmetric and anti-symmetric parts of the velocity gradient tensor (Jeong & Hussain Reference Jeong and Hussain1995).
The uncertainty of TPIV has been studied in several previous publications using different methods. For example, Elsinga et al. (Reference Elsinga, Scarano, Wieneke and van Oudheusden2006) generate synthetic particle images using the flow field of a vortex ring. They demonstrate displacement uncertainty of 0.1 and 0.16 voxel for the in-plane and out-of-plane components, respectively. Worth, Nickels & Swaminathan (Reference Worth, Nickels and Swaminathan2010) generate synthetic particle images using DNS data of isotropic turbulence. Their mean displacement uncertainty is 0.2 and 0.3 voxel for the in-plane and out-of-plane components, respectively. Atkinson et al. (Reference Atkinson, Coudert, Foucaut, Stanislas and Soria2011) compare TPIV and hot-wire anemometry in a turbulent boundary layer. A large bias error (
 ${\sim}1.5$
voxel) occurs in the near-wall region (
 $y^{+}=15$
), where the velocity gradients are high. Their overall displacement uncertainty is approximately
 $\unicode[STIX]{x1D700}_{u}\unicode[STIX]{x0394}t=0.6$
voxels, where
 $\unicode[STIX]{x1D700}_{u}$
is the velocity uncertainty, and
 $\unicode[STIX]{x0394}t$
the time delay between exposures. Following Moffat (Reference Moffat1988),
 $\unicode[STIX]{x1D700}_{u}$
is estimated from the r.m.s. values of the fluctuating velocity divergence,
 $\langle (\unicode[STIX]{x2202}u_{i}^{\prime }/\unicode[STIX]{x2202}x_{i})^{2}\rangle ^{1/2}=(3/2)^{1/2}\unicode[STIX]{x1D700}_{u}/l$
, where
 $l$
is the vector spacing,
 $\langle \;\rangle$
represents an ensemble average,
 $^{\prime }$
indicates fluctuating quantiles and repeating indices indicates summation. The same approach is utilized in the present study, resulting in a 0.3 voxel displacement uncertainty, corresponding to a velocity uncertainty of
 $0.036~\text{m}~\text{s}^{-1}$
, or 1.4 % of
 $U_{0}$
. The uncertainty in ensemble-averaged velocity, estimated by dividing
 $\unicode[STIX]{x1D700}_{u}$
by the square root of the number of measurements, is two orders of magnitude smaller.
A brief summary of the GPU-based procedures for using the time-resolved 3D velocity field to calculate the pressure distribution is provided in appendix B. The material acceleration is calculated utilizing a Lagrangian method proposed by Liu & Katz (Reference Liu and Katz2006), and expanded in Liu & Katz (Reference Liu and Katz2013). However, unlike the previous work that is based on planar measurements, the present analysis is based on 3D data. The instantaneous pressure distribution is subsequently calculated by spatially integrating the material acceleration. The viscous term is neglected since the ratio between the viscous term and material acceleration is of the order of
 $10^{-5}$
based on the present TPIV data, in agreement with observations by van Oudheusden et al. (Reference van Oudheusden, Scarano, Roosenboom, Casimiri and Souverein2007) and Ghaemi et al. (Reference Ghaemi, Ragni and Scarano2012), the latter for boundary layers. The integration is performed by extending the virtual-boundary omni-directional integration method (Liu & Katz Reference Liu and Katz2013) to three dimensions. This pressure calculation algorithm is validated using DNS results for a channel flow available in the Johns Hopkins Turbulence Databases (Perlman, Burns & Li Reference Perlman, Burns, Li and Meneveau2007; Li et al.
Reference Li, Perlman, Wan, Yang, Meneveau, Burns, Chen, Szalay and Eyink2008; Graham et al.
Reference Graham, Kanov, Yang, Lee, Malaya, Lalescu, Burns, Eyink, Szalay, Moser and Meneveau2016) by comparing the reconstructed 3D pressure with the known values available from the simulation. The r.m.s. value of the relative integration error (only) is 0.46 %, a negligible effect in comparison to that caused by errors in material acceleration. Similar to procedures used for estimating
 $\unicode[STIX]{x1D700}_{u}$
, the uncertainty in material acceleration is estimated from the r.m.s. value of its curl,
 $\unicode[STIX]{x1D735}\times (\text{D}u_{i}^{\prime }/\text{D}t)$
. Provided that the viscous terms in the Navier–Stokes equation can be neglected,
 $\unicode[STIX]{x1D735}\times (\text{D}u_{i}^{\prime }/\text{D}t)$
should be equal to zero. Assuming isotropy,
 $\unicode[STIX]{x1D700}(\text{D}u_{i}^{\prime }/\text{D}t)/l\approx \langle (\unicode[STIX]{x1D735}\times (\text{D}u_{i}^{\prime }/\text{D}t))^{2}\rangle ^{1/2}$
, where
 $\unicode[STIX]{x1D700}$
represents the uncertainty. Using the present data, the estimated uncertainty in material acceleration is
 $32~\text{m}~\text{s}^{-2}$
, which is approximately 45 % of the spatially averaged r.m.s. value of
 $\text{D}u_{i}^{\prime }/\text{D}t$
. Since the pressure is integrated from its gradient and averaged over multiple integration directions, the relationship between
 $\unicode[STIX]{x1D700}(p)$
and
 $\unicode[STIX]{x1D700}(\unicode[STIX]{x1D735}p)$
can be estimated as
 $\unicode[STIX]{x1D700}(p)\approx \unicode[STIX]{x1D700}(\unicode[STIX]{x1D735}p)Nl/(NM)^{1/2}\approx \unicode[STIX]{x1D70C}Nl/(NM)^{1/2}\unicode[STIX]{x1D700}(\text{D}u_{i}^{\prime }/\text{D}t)$
, where
 $N$
is the number of grid points along one integration path and
 $M$
is the number of integration paths. The values of
 $N$
and
 $M$
depend on the location of the sample point, but vary by 10 % across the sample volume. Using the current parallel line omni-directional integration procedure, the spatially averaged values for
 $N$
and
 $M$
are 33 and 10 242, respectively. Substituting these values in the equation for
 $\unicode[STIX]{x1D700}(p)$
, the corresponding uncertainty in instantaneous pressure is 0.7 Pa, which is less than 2 % of the spatially averaged r.m.s. value of pressure fluctuations. This analysis does not fully account for the effect of limited spatial resolution very near the wall.
Since the pressure is integrated from its gradient, an undetermined reference pressure is needed as an integration constant. Following Joshi et al. (Reference Joshi, Liu and Katz2014), we use the spatially averaged pressure over the entire sample volume,
 $p_{ref}$
(
 $t$
), for each instantaneous realization. Hence, the pressure field discussed in the rest of the paper,
 $p$
(
 $x$
,
 $y$
,
 $z$
,
 $t$
), represents the deviation of the pressure at a specific point from the spatially averaged value. Due to the finite size of the sample volume,
 $p$
(
 $x$
,
 $y$
,
 $z$
,
 $t$
) effectively represents a spatially high-pass filtered pressure, and the resulting spectra do not account for the time dependence of the spatially averaged pressure. Similar issues are also encountered when solving the pressure Poisson equation to determine the pressure, which requires a Dirichlet-type boundary condition for some of the boundaries. Several recent studies have used the Bernoulli equation for a boundary located away from the wall (e.g. de Kat & van Oudheusden Reference de Kat and van Oudheusden2012; Ghaemi & Scarano Reference Ghaemi and Scarano2013). For application in boundary layer flow, Ghaemi et al. (Reference Ghaemi, Ragni and Scarano2012) examine the effect of the elevation of the Dirichlet boundary, showing that the calculated wall pressure does not differ substantially when this boundary is located above
 $0.2h$
.
2.3 Surface deformation measurements
The 2D surface deformation is measured using Mach–Zehnder interferometry (MZI, Hecht Reference Hecht2002). The optical components are integrated into the TPIV system, as illustrated in the front view of figure 2. Mirrors M1 and M3, which are located on top and under the channel, respectively, and are polished on both sides, allow transmission of 0.1 % of the laser energy through them. The light transmitted through M1 serves as reference beam, and the light passing through the channel and M3 is the object beam. As the latter propagating through the transparent compliant surface, the surface deformation alters the optical path length of the light, affecting its phase distribution. The fringe patterns generated as the two beams interfere are recorded by a fifth high-speed camera (pco.dimax) at 3000 f.p.s. using
 $1584\times 1024$
pixel arrays. The fringe spacing,
 $S$
, is approximately 34 pixels (
 $374~\unicode[STIX]{x03BC}\text{m}$
or
 $34\unicode[STIX]{x1D6FF}_{\unicode[STIX]{x1D708}}$
). A total of 7838 frames have been recorded, corresponding to a duration of 2.6 s (
 $2.5\times 10^{4}\unicode[STIX]{x1D70F}_{\unicode[STIX]{x1D708}}$
). For the combined system, the field of view (FOV) is
 $17.4\times 11.3~\text{mm}^{2}$
(
 $1611\times 1046\unicode[STIX]{x1D6FF}_{\unicode[STIX]{x1D708}}^{2}$
) in the
 $x$
and
 $z$
directions, respectively. The size of this sample area is matched with the corresponding dimensions of the TPIV volume. A sample original fringe pattern is provided in figure 3(a,b), with the latter zooming on a small area indicated in figure 3(a) by a dashed rectangular box. In a separate series of experiments, which involve only deformation measurements and are aimed at observing larger scale wall surface features, the FOV of MZI system is expanded to
 $90\times 54~\text{mm}^{2}$
(
 $8182\times 4909\unicode[STIX]{x1D6FF}_{\unicode[STIX]{x1D708}}^{2}$
), resulting in a 25 times increase in sample area. The optical set-up is illustrated in figure 4. Here, the object beam is expanded and collimated by a pair of concave (L1) and convex (L2) lenses, and then propagates through the channel. The corresponding image size is increased to
 $2016\times 1200$
pixels and the sampling rate reduces to 2000 f.p.s. The fringe spacing is approximately 11 pixels (
 $498~\unicode[STIX]{x03BC}\text{m}$
or
 $45\unicode[STIX]{x1D6FF}_{\unicode[STIX]{x1D708}}$
). Total of 5255 frames have been recorded, corresponding to a duration of 2.6 s (
 $2.5\times 10^{4}\unicode[STIX]{x1D70F}_{\unicode[STIX]{x1D708}}$
).
(a,b) Sample instantaneous image of raw MZI fringe pattern, (c,d) the same image after correlation-based enhancement, and (e) the corresponding linearly detrended distribution of deformation, with vertical scales exaggerated. (a,c) Entire field of view. (b,d) Zooms on the small area indicated by dashed lines. The enclosed area in the zoomed views shows a correlation mask.

Optical set-up for the extended field-of-view MZI system.

Details about the data processing procedures, including validations using synthetic images, are provided in Zhang et al. (Reference Zhang, Miorini and Katz2015), and only summarized briefly in this paper. The surface shape is calculated from the phase distribution of the object wave. The three analysis steps include: (i) fringe enhancement, (ii) phase evaluation, and (iii) phase unwrapping. The intensity distribution of the interferogram can be expressed as
 $$\begin{eqnarray}I(x,z,t)=C_{1}(x,z,t)+C_{2}(x,z,t)\cos [\unicode[STIX]{x1D711}_{0}(x,z)+\unicode[STIX]{x1D6FF}(x,z,t)],\end{eqnarray}$$
where
 $C_{1}$
is the sum of the intensities of the object and reference waves, and
 $C_{2}$
is twice the product of the amplitudes of the two waves. The phase of fringes contains two terms. The first,
 $\unicode[STIX]{x1D711}_{0}$
, is presumed to be stationary and accounts for the shape of the wavefront, including effects of window shapes, unperturbed compliant surface thickness, distortion by lenses, etc. The second term,
 $\unicode[STIX]{x1D6FF}$
, is the time-dependent phase difference between the two waves resulting from changes to the thickness of the wall,
 $d(x,z,t)$
. It satisfies
 $$\begin{eqnarray}\displaystyle \unicode[STIX]{x1D6FF}(x,z,t)=\frac{2\unicode[STIX]{x03C0}}{\unicode[STIX]{x1D6EC}}(n_{PDMS}-n_{Nal})\,d(x,z,t), & & \displaystyle\end{eqnarray}$$
where
 $\unicode[STIX]{x1D6EC}$
is the laser wavelength, 527 nm in the present measurements. As is evident from figure 3(a), the original interferograms are quite noisy due to laser non-uniformity and distortions. Hence, a series of enhancement procedures have been developed and implemented to homogenize the fringe amplitude by filtering out spatial features that are larger or smaller than the fringe spacing. This process results in
 $C_{1}=0$
and
 $C_{2}=1$
. The enhancement procedure involves two steps. In the first, the instantaneous intensity in every pixel is normalized based on the maximum and minimum intensities for that pixel over a time interval of length
 $\unicode[STIX]{x0394}T=312\unicode[STIX]{x1D70F}_{\unicode[STIX]{x1D708}}$
. This choice for
 $\unicode[STIX]{x0394}T$
is long enough to obtain converged image statistics, but short enough to account for temporal variations in, for example, laser intensity. In the second enhancement step, the iso-phase intensities are homogenized and bandpass filtered by calculating the spatial autocorrelation of the image in a small interrogation window centred at the pixel of interest. The resulting autocorrelation map is considered as a template of the local fringe pattern, which preserves the fringe shape, but loses the phase information since the autocorrelation always peaks at the centre. The lost phase is recovered by cross-correlating the autocorrelation with the original image, which provides the local filtered intensity. The choice of window size for calculating the (auto- and cross-) correlations has a strong impact on the enhancement error. To minimize the error, the analysis described in Zhang et al. (Reference Zhang, Miorini and Katz2015) shows that in a direction perpendicular to the iso-phase lines, the window width should span an integer multiple of the local fringe spacing. This requirement is achieved by utilizing a mask, which is indicated in figure 3(b,d). The shapes of the left and right boundaries follow the local fringe iso-phase lines, and their distances are equal to one fringe cycle. Calibrations using synthetic data also show that the window height should be smaller than
 $(SR)^{1/2}$
, where
 $R$
is the local radius of curvature of the fringes. For the present fringe spacing, this requirement is achieved by reducing the height of the window to 20 pixels. To reduce the processing time, instead of performing this analysis for every pixel, the cross-correlation values from one calculation is used to update a
 $5\times 5$
pixels region located in the centre of the interrogation window. Uncertainty analysis indicates that the impact of repeating the correlations for every 25 pixels is negligible. The enhanced interferogram is shown in figure 3(c,d). Evidently, the background intensity variations are removed, and the fringe intensities are normalized to the range
 $[-1,1]$
.
Several techniques are available to extract phase distributions from interferograms. A widely adopted approach is the so-called ‘Fourier transform’ method (Ichioka & Inuiya Reference Ichioka and Inuiya1972; Takeda, Ina & Kobayashi Reference Takeda, Ina and Kobayashi1982). Although easy to implement, this method is prone to errors near the edge of the interferogram due to spectral leakage. Improved methods aimed at addressing this problem (e.g. Bone, Bachor & Sandeman Reference Bone, Bachor and Sandeman1986; Roddier & Roddier Reference Roddier and Roddier1987) are typically based on extending the image beyond its original boundary by various extrapolation methods. They reduce the errors near boundaries, but do not eliminate them completely. Consequently, we opt to use a different approach which does not involve a Fourier transform. Taking advantage of the uniform fringe intensity provided by the correlation-based filtering, the phase distribution can be directly evaluated using an arccosine function. The phase ambiguity introduced by arccosine can be readily removed if the sign of the actual phase slope along a certain direction is known by, for example, imposing a slope that is larger than that at any point in the sample area. In the present setting it is simply achieved by tilting the reference beam relative to the object beam by a ‘large’ angle (
 ${\sim}0.08^{\circ }$
). This is the reason that the fringes in figure 3 are aligned approximately in the spanwise direction. They are also slightly curved, mostly due to the optical distortion associated with the channel walls.
The corrected phases are still ‘wrapped’, with values varying between 0 and
 $2\unicode[STIX]{x03C0}$
, and need to be unwrapped temporally and spatially. Temporal unwrapping is performed on the intensity time series of a fixed pixel located at the centre of the image using a 1D unwrapping algorithm (Itoh Reference Itoh1982). It identifies and removes
 $2\unicode[STIX]{x03C0}$
phase discontinuities along this time series. The resulting phase at this location is used as the starting value for the spatial unwrapping of each interferogram. The spatial 2D phase unwrapping is achieved by spatially integrating the phase gradient. This integration should be path-independent if the wrapped phase map is free from residues. These residues can be identified by performing the closed-loop integral/summation of the wrapped phase gradient for every
 $2\times 2$
pixels over the entire image (Ghiglia, Mastin & Romero Reference Ghiglia, Mastin and Romero1987; Goldstein, Zebker & Werner Reference Goldstein, Zebker and Werner1988). For the combined TPIV/MZI data, the phase map has very small (negligible) residues. Hence, a straightforward integration is performed to unwrap the phase, first along columns and then across rows. In the large FOV MZI experiments, the extended FOV reveals local imperfections on the compliant surface not visible in the previous test. They appear in a few spots as tightly packed and sometimes discontinuous fringes. Hence, the Goldstein’s algorithm (Goldstein et al.
Reference Goldstein, Zebker and Werner1988; Ghiglia & Pritt Reference Ghiglia and Pritt1998) is utilized to filter the impact of these points out for the large FOV dataset. This algorithm first connects nearby residues of different signs with straight lines, and then generates integration paths that do not cross those lines.
Time-averaging of the unwrapped phase distributions is used to determine the stationary term
 $\unicode[STIX]{x1D711}_{0}(x,z)$
in (2.1). Its distribution is subtracted from the instantaneous data, leaving only
 $\unicode[STIX]{x1D6FF}(x,z,t)$
. The surface deformation is then calculated using (2.2). Figure 3(e) shows the instantaneous deformation calculated from the interferogram presented in figure 3(c) and normalized with
 $\unicode[STIX]{x1D70C}u_{\unicode[STIX]{x1D70F}}^{2}l_{0}/E^{\prime }$
. The deformation is spatially linearly detrended to remove displacements larger than the current FOV, and highlight the local spatial variations. Extensive synthetic validations have been performed using fringes generated from known deformation fields (Zhang et al.
Reference Zhang, Miorini and Katz2015). The effect of background noise has been accounted for by adding a noisy background extracted from experimental data. The results indicate the fringe spacing, its radius of curvature, as well as its spatial gradient,
 $|\unicode[STIX]{x2202}S/\unicode[STIX]{x2202}x|$
, have the strongest impacts on the errors. Specifically, the error increases for decreasing
 $|SR|$
and increasing
 $|\unicode[STIX]{x2202}S/\unicode[STIX]{x2202}x|$
. For fringes similar to the present experimental data, the r.m.s. value of the measurement uncertainty determined from these validations is
 ${\sim}0.01~\unicode[STIX]{x03BC}\text{m}$
(Zhang et al.
Reference Zhang, Miorini and Katz2015). As discussed later, although the amplitude of the total deformations (
 ${\sim}100~\unicode[STIX]{x03BC}\text{m}$
) is much larger than the current uncertainty, the amplitude of the high-pass filtered deformations which are advected with the flow, is approximately
 $0.1~\unicode[STIX]{x03BC}\text{m}$
, only one order of magnitude larger than the estimated uncertainty.
A sample instantaneous realization of the combined TPIV/MZI data is shown in figure 5. The bottom wavy contour surface shows the deformation of the compliant wall high-pass filtered at
 $\unicode[STIX]{x1D714}h/U_{0}=4.3$
, where
 $\unicode[STIX]{x1D714}$
is the frequency in radians per second. As discussed later, this cutoff frequency enables us to focus on advected phenomena. The amplitude of the surface motion is exaggerated for clarity. The 3D vectors in the
 $x{-}y$
plane represent the velocity fluctuations, and only alternate vectors are shown in the streamwise direction. The colour contours indicate distribution of wall-normal velocity. The 3D blob represents iso-surfaces of
 $\unicode[STIX]{x1D706}_{2}/(U_{0}/h)^{2}=-6.2$
, which indicate the location of vortex structures (Jeong & Hussain Reference Jeong and Hussain1995). In this sample, the deformation peak and trough appear to be associated with the wall-normal velocity and predominantly strong vortices. Classification of these structures is the primary objective of this paper. A sample instantaneous realization of the large FOV high-pass filtered (at
 $\unicode[STIX]{x1D714}h/U_{0}=1.6$
) deformation is shown in figure 6. Here, the deformation pattern appears to be largely aligned in the spanwise direction, with a streamwise wavelength of approximately
 $1.9h$
. The movies indicate that this pattern is advected at approximately the centreline velocity (see supplementary movie 1 available on https://doi.org/10.1017/jfm.2017.299). A small circular region located at (
 $x/h=39.3$
,
 $z/h=-0.2$
) contains a local surface defect on the compliant wall.
A sample instantaneous realization of the flow field and detrended and high-pass filtered surface deformation. Colour contour in the
 $x$
–
 $y$
plane shows the distribution of
 $v^{\prime }$
. The 3D blobs are iso-surfaces of
 $\unicode[STIX]{x1D706}_{2}/(U_{0}/h)^{2}=-6.2$
. For clarity only alternate vectors are shown in the streamwise direction.

A sample instantaneous realization of the large field-of-view detrended and high-pass filtered (at
 $\unicode[STIX]{x1D714}h/U_{0}=1.6$
) deformation.

(a) The mean velocity profile measured using ‘standard’ TPIV, sum-of-correlation and single-pixel ensemble correlation. The results are compared with the log-law profile:
 $U^{+}=(1/\unicode[STIX]{x1D705})\ln y^{+}+B$
, (
 $\unicode[STIX]{x1D705}=0.41$
;
 $B=5.2$
) and
 $U^{+}=y^{+}$
. (b) Profiles of Reynolds stresses calculated using the ‘standard’ TPIV data, and r.m.s. values of pressure fluctuations calculated using omni-directional integration.

3 Results
3.1 Mean velocity and Reynolds stresses profiles
Profiles of the mean velocity and Reynolds stresses are presented in figure 7. The statistics are calculated from 17 689 velocity fields acquired over a duration of 2.95 s
 $(2.8\times 10^{4}\unicode[STIX]{x1D70F}_{\unicode[STIX]{x1D708}})$
. The spatially averaged integral time scale
 $\unicode[STIX]{x1D70F}=\int R_{u,u}\,\text{d}s$
, where
 $R_{u,u}(s)$
is the autocorrelation function of the streamwise velocity, is 0.0115 s. As a result, data acquisition time corresponds to
 $257\unicode[STIX]{x1D70F}$
. The spatially averaged mean velocity profile (figure 7
a) is compared with the log-law profile:
 $U^{+}=(1/\unicode[STIX]{x1D705})\ln y^{+}+B$
, where
 $\unicode[STIX]{x1D705}=0.41$
and
 $B=5.2$
, as well as with
 $U^{+}=y^{+}$
in the viscous sublayer (Pope Reference Pope2000). The wall-normal distance is normalized using
 $h$
, indicated in the bottom axis, and using
 $\unicode[STIX]{x1D6FF}_{\unicode[STIX]{x1D708}}$
shown in the top axis. This velocity profile calculated from the ‘standard’ TPIV shows a clear log-law region, but it is erroneous, as expected, in the buffer layer, where a vector spacing of
 $l^{+}=20.6$
is too coarse. Two related techniques are utilized to extract the near-wall velocity. The first one is the sum-of-correlation method (Meinhart, Wereley & Santiago Reference Meinhart, Wereley and Santiago2000), which determines the mean velocity at each location from an ensemble-averaged correlation map for small interrogation windows. To enhance the particle image concentrations, in the present calculation, the 3D particle distributions are projected onto 2D images by assigning the maximum intensity along the spanwise direction to each pixel. The ensemble-averaged distribution of correlations is calculated for an
 $8\times 8$
pixels interrogation window with 75 % overlap. An alternative approach is the ‘single-pixel ensemble correlation’ (Westerweel, Geelhoed & Lindken Reference Westerweel, Geelhoed and Lindken2004; Scharnowski, Hain & Kahler Reference Scharnowski, Hain and Kahler2012; Soria & Willert Reference Soria and Willert2012), which is equivalent to reducing the interrogation window down to one pixel. These calculations are also performed using the above-mentioned 2D projected images. Results of both techniques are also included in figure 7(a). Evidently, they extend the velocity profile down to the buffer layer, but deviate from the expected linear velocity profile for
 $y^{+}<\sim 2$
. This deviation is not surprising considering that the particle diameter is approximately
 $1.2\unicode[STIX]{x1D6FF}_{\unicode[STIX]{x1D708}}$
.
The Reynolds stresses profiles,
 $\langle u^{\prime }u^{\prime }\rangle /u_{\unicode[STIX]{x1D70F}}^{2}$
,
 $\langle v^{\prime }v^{\prime }\rangle /u_{\unicode[STIX]{x1D70F}}^{2}$
,
 $\langle w^{\prime }w^{\prime }\rangle /u_{\unicode[STIX]{x1D70F}}^{2}$
,
 $-\langle u^{\prime }v^{\prime }\rangle /u_{\unicode[STIX]{x1D70F}}^{2}$
, and
 $p_{rms}/\unicode[STIX]{x1D70C}u_{\unicode[STIX]{x1D70F}}^{2}$
are presented in figure 7(b). The distribution of
 $\langle u^{\prime }u^{\prime }\rangle /u_{\unicode[STIX]{x1D70F}}^{2}$
peaks near the wall, considering that the buffer layer is not resolved, followed by a plateau extending to
 $y/h\sim 0.1(y^{+}\sim 230)$
. Both have been observed before in experiments and simulations (e.g. Hutchins & Marusic Reference Hutchins and Marusic2007a
; Mathis, Hutchins & Marusic Reference Mathis, Hutchins and Marusic2009; Hultmark, Bailey & Smits Reference Hultmark, Bailey and Smits2010; Marusic, Mathis & Hutchins Reference Marusic, Mathis and Hutchins2010; Mathis, Hutchins & Marusic Reference Mathis, Hutchins and Marusic2011; Hultmark Reference Hultmark2012; Schultz & Flack Reference Schultz and Flack2013; Bernardini, Pirozzoli & Orlandi Reference Bernardini, Pirozzoli and Orlandi2014; Lee & Moser Reference Lee and Moser2015). The height of the plateau is also consistent with those of Schultz & Flack (Reference Schultz and Flack2013) for similar
 $Re_{\unicode[STIX]{x1D70F}}$
. By inspecting the energy spectra of the streamwise velocity at various elevations, Hutchins & Marusic (Reference Hutchins and Marusic2007a
) associate the plateau with energy contributed by large-scale log-layer motions. They also demonstrate that these large-scale structures modulate the amplitude of the near-wall streamwise velocity fluctuations, a phenomenon relevant to the present investigation. The Reynolds shear stress
 $-\langle u^{\prime }v^{\prime }\rangle /u_{\unicode[STIX]{x1D70F}}$
peaks around
 $y/h\sim 0.12(y^{+}\sim 280)$
. As shown in Zhang et al. (Reference Zhang, Miorini and Katz2015), we estimate the wall stress by extrapolating the total shear stress, namely the sum of the viscous and Reynolds stresses, to the wall. The result is used for normalizing all the present ensemble-averaged variables, and agrees with the mean velocity profile (figure 7
a). The elevation of the Reynolds stress peak is slightly higher than those found in Hoyas & Jiménez (Reference Hoyas and Jiménez2006) and Schultz & Flack (Reference Schultz and Flack2013) at similar Reynolds numbers (
 $Re_{\unicode[STIX]{x1D70F}}=2000$
). It is presumably associated with the size of the TPIV interrogation volume of
 $82.3\unicode[STIX]{x1D6FF}_{\unicode[STIX]{x1D708}}$
, which attenuates the small-scale fluctuations near the wall (Hong et al.
Reference Hong, Katz and Schultz2011; Talapatra & Katz Reference Talapatra and Katz2013). The values of
 $p_{rms}/\unicode[STIX]{x1D70C}u_{\unicode[STIX]{x1D70F}}^{2}$
decrease with elevation, consistent with those reported in Tsuji et al. (Reference Tsuji, Fransson, Alfredsson and Johansson2007) and Joshi et al. (Reference Joshi, Liu and Katz2014) for boundary layers at similar Reynolds numbers. DNS results for channel flow at
 $Re_{\unicode[STIX]{x1D70F}}=1020$
by Abe, Matsuo & Kawamura (Reference Abe, Matsuo and Kawamura2005) show a similar trend with elevation, but their magnitudes are lower by approximately 50 %. An increase in pressure fluctuations with increasing Reynolds number has been observed experimentally (Tsuji et al.
Reference Tsuji, Fransson, Alfredsson and Johansson2007) and in simulated data (Lozano-Durán & Jiménez Reference Lozano-durán and Jiménez2014).
3.2 Spectra of pressure and deformation
The spatial power spectral density (PSD) of pressure,
 $E_{pp}(k_{x})$
, normalized by
 $\unicode[STIX]{x1D70F}_{w}^{2}\unicode[STIX]{x1D708}/u_{\unicode[STIX]{x1D70F}}$
, at two elevations are presented in figure 8. Here,
 $k_{x}=2\unicode[STIX]{x03C0}/\unicode[STIX]{x1D706}_{x}$
is the streamwise wavenumber. For the current analysis, we opt to present directly measured spatial spectra because, as noted before, by setting the spatially averaged instantaneous pressure to zero, the pressure signal is spatially high-pass filtered. Hence, it is also expected to attenuate a not readily determined part of the frequency spectrum. The spectra are calculated using FFT without windowing using all the instantaneous realizations over the entire spanwise range, and then spatially and ensemble-averaged. The results are normalized with inner scaling and compared with the measured PSD of pressure calculated from planar PIV data (Joshi et al.
Reference Joshi, Liu and Katz2014) in the same facility, but for a developing boundary layer. The axes normalized with outer scaling are added for comparison, based on the present experimental conditions. The present results are also compared to the PSD of DNS-based wall pressure data of Abe et al. (Reference Abe, Matsuo and Kawamura2005) for channel flow. At low wavenumbers, the present results agree with those of Joshi et al. (Reference Joshi, Liu and Katz2014) for the same elevation. However, they deviate at high wavenumbers, with the present values being lower, presumably owing to differences in the dimensionless spatial resolution. In Joshi et al. (Reference Joshi, Liu and Katz2014), the interrogation window size is
 $35.8\unicode[STIX]{x1D6FF}_{\unicode[STIX]{x1D708}}$
versus
 $82.3\unicode[STIX]{x1D6FF}_{\unicode[STIX]{x1D708}}$
for the present data. Furthermore, the 75 % overlap utilized in the TPIV analysis also causes aliasing at high wavenumbers (Foucaut, Carlier & Stanislas Reference Foucaut, Carlier and Stanislas2004; Schrijer & Scarano Reference Schrijer and Scarano2008). The present PSD is higher than that of Abe et al. (Reference Abe, Matsuo and Kawamura2005), presumably due to differences in Reynolds number, consistent with trends shown by them.
The present power spectral density of pressure compared with previous experimental and DNS results.

The PSD of the deformation,
 $E_{dd}(\unicode[STIX]{x1D714})$
, normalized by
 $h(\unicode[STIX]{x1D70C}u_{\unicode[STIX]{x1D70F}}^{2}l_{0}/E^{\prime })^{2}/U_{0}$
, calculated from the small FOV data is shown in figure 9(a). The spectrum is calculated for each surface node for the entire duration of the measurement, and then spatially averaged. As is evident, the surface motions involve a broad range of time scales, with an r.m.s. value of
 $42~\unicode[STIX]{x03BC}\text{m}$
. Part of the motions are associated with channel vibrations, whose length scales are presumably much larger than the FOV. Hence, they displace or tilt the entire FOV. Bi-directional linear detrending of instantaneous realization filters these motions out, as done for the rest of this paper. The PSD of the detrended deformation is shown in figure 9(b). The corresponding r.m.s. value is
 $0.2~\unicode[STIX]{x03BC}\text{m}$
(
 $0.02\unicode[STIX]{x1D6FF}_{\unicode[STIX]{x1D708}}$
). Hence, the present detrended deformations are not expected to have a significant impact on the flow structure in the boundary layer, resulting in a ‘one-way coupling’, where the flow affects the wall, but not vice versa. After detrending, the spectrum has two troughs, at
 $\unicode[STIX]{x1D714}h/U_{0}\sim 1.6$
and
 ${\sim}4.3$
. i.e. it can be roughly divided into three frequency bands: (i)
 $f<25~\text{Hz}$
or
 $\unicode[STIX]{x1D714}h/U_{0}<1.6$
, (ii)
 $25~\text{Hz}<f<67~\text{Hz}$
and (iii)
 $f>67$
Hz or
 $\unicode[STIX]{x1D714}h/U_{0}>4.3$
, as indicated by two vertical lines. A visual inspection of the temporally filtered deformation for each of these bands (see supplementary movies 2–4) indicates that only deformations in the highest frequency band are dominated by downstream-travelling surface patterns. The dominant motions in the first and second bands seem to propagate in all directions, and sometimes behave like standing waves. It should be noted that these waves have much lower amplitude and they occur at much lower velocity (relative to the
 $c_{t}$
) than the static-divergence wave reported in Hansen & Hunston (Reference Hansen and Hunston1974, Reference Hansen and Hunston1983) and Gad-el-Hak et al. (Reference Gad-el-Hak, Blackwelder and Riley1984). The PSD of the detrended deformation for the large FOV is presented in figure 10. The corresponding r.m.s. value is
 $0.18~\unicode[STIX]{x03BC}\text{m}$
, still much smaller than the wall unit, and are not expected to have a significant effect on the flow structure. The location of trough at
 $\unicode[STIX]{x1D714}h/U_{0}\approx 1.6$
–1.8 is consistent with that shown in figure 9(b), but
 $\unicode[STIX]{x1D714}h/U_{0}=1.8$
also corresponds to a deformation with wavelength equal to the length of the sample area (90 mm) travelling at a velocity of 2.5 m s
 $^{-1}$
, the centreline velocity. The peaks at
 $\unicode[STIX]{x1D714}h/U_{0}<1.8$
correspond to non-advected phenomena, and do not have a consistent direction of propagation. In subsequent analysis, most of our attention focuses on the advected phenomena. The large FOV spectrum does not have a trough at
 $\unicode[STIX]{x1D714}h/U_{0}\sim 4.3$
, confirming that the dip in figure 9(b) is caused by detrending.
Power spectral density of the normalized deformation (a) before spatial detrending and (b) after spatial detrending. Reprinted with permission from Springer.

Power spectral density of the large field-of-view detrended deformation. The lines show predictions of the Chase (Reference Chase1991) model for flat pressure spectra with phase speeds of
 $0.72U_{0}$
(dash-dot line) and
 $U_{0}$
(dashed line), as well as the measured pressure spectra at
 $y/h=0.03$
for a phase speed of
 $0.72U_{0}$
(thick line).

The amplitude of deformation (normalized by
 $\unicode[STIX]{x1D70C}u_{\unicode[STIX]{x1D70F}}^{2}l_{0}/E^{\prime }$
) in response to pressure perturbation amplitude of
 $\unicode[STIX]{x1D70C}u_{\unicode[STIX]{x1D70F}}^{2}$
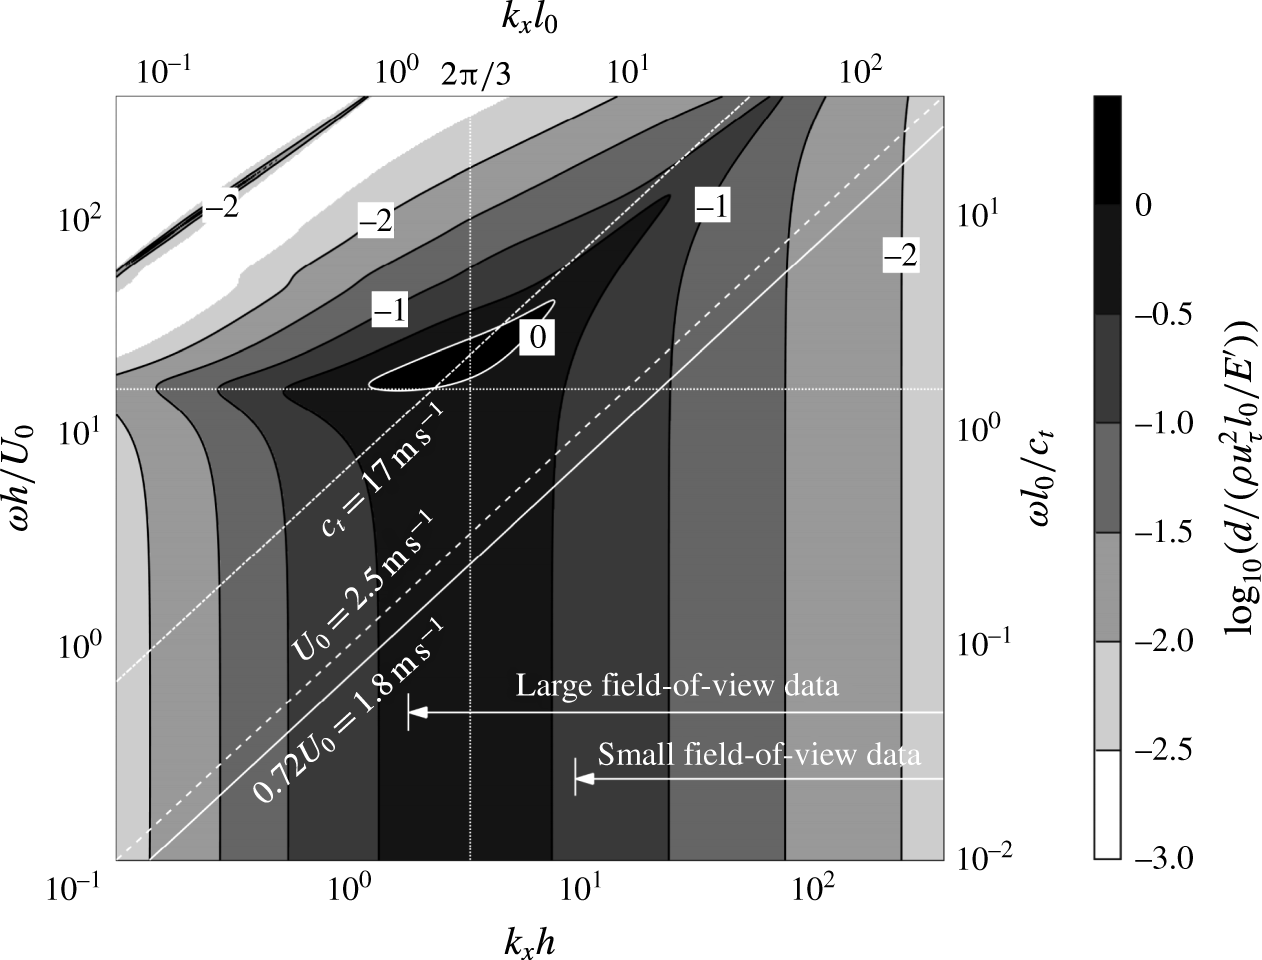
, as predicted by the Chase (Reference Chase1991) model. The inclined lines correspond to the specified advection speeds. The vertical and horizontal dotted lines represent
 $k_{x}l_{0}=2\unicode[STIX]{x03C0}/3$
and
 $\unicode[STIX]{x1D714}l_{0}/c_{t}=1.45$
, respectively.
To elucidate the shape of the spectrum for
 $\unicode[STIX]{x1D714}h/U_{0}>1.8$
, one can analyse the response of a compliant layer to pressure perturbations. Chase (Reference Chase1991) introduces a classical model for the response of a viscoelastic layer under prescribed pressure and wall shear stress fluctuations. Because of its significance to the present study, the model is summarized in appendix A. Briefly, this 2D model involves streamwise and wall-normal small-amplitude deformations in a domain with thickness of
 $l_{0}$
unbounded in the
 $x$
-direction. Using Helmholtz decomposition, the displacement and stresses of the compliant layer are solved for a viscoelastic material. The material damping is accounted for by allowing complex longitudinal and shear wave speeds in the Navier equation. The prescribed pressure, shear as well as fluid loading serve as boundary conditions. As shown in appendix A, for the present range of frequencies, wavenumbers, material properties, and magnitude of pressure fluctuations relative to those of shear stresses (Tsuji et al.
Reference Tsuji, Fransson, Alfredsson and Johansson2007, Reference Tsuji, Imayama, Schlatter, Alfredsson, Johansson, Marusic, Hutchins and Monty2012), the impact of pressure on the shape of the wall is higher by orders of magnitudes than that of shear stresses. Hence, the present analysis focuses on the effect of pressure. Figure 11 shows the normalized wavenumber–frequency spectrum of wall deformation predicted by the Chase (Reference Chase1991) model for sinusoidal pressure excitation with equal amplitude (
 $=\unicode[STIX]{x1D70C}u_{\unicode[STIX]{x1D70F}}^{2}$
) at all wavenumbers and frequencies. Both the frequency and wavenumber are normalized using two different variables, with those involving
 $l_{0}$
and
 $c_{t}$
being associated with the model directly, and those involving
 $h$
and
 $U_{0}$
being added in order to relate the results to the flow conditions. The peak response occurs at
 $k_{x}l_{0}\approx 2\unicode[STIX]{x03C0}/3$
. At higher wavenumbers, i.e. to the right of the vertical dotted line, the surface response peaks when the pressure phase speed is slightly lower than
 $c_{t}$
. The latter is highlighted by the inclined dash-dot line. Evidently, since the present centreline velocity, which is indicated by a dash line, is much lower than
 $c_{t}$
, the interactions between the compliant wall and the flow are substantially weaker than the peak values.
For
 $\unicode[STIX]{x1D714}l_{0}/c_{t}<1.45$
, the surface response over the entire domain has a broad peak centred at
 $k_{x}l_{0}\approx 2\unicode[STIX]{x03C0}/3$
. For the current study, the peak wavelength,
 $3l_{0}$
, is equal to
 $1.89h$
. Hence, this wavelength is covered by the large FOV, but not by the small FOV, as highlighted in figure 11. Consequently, the deformation features dominating the large FOV data (figure 6) have a wavelength of
 ${\sim}1.9h$
, which cannot be observed in the small FOV. The vertically aligned spectral peak at low frequencies (
 $\unicode[STIX]{x1D714}l_{0}/c_{t}<1.45$
) indicates that the wavenumber corresponding to the spectral peak is only a function of
 $l_{0}$
, and does not depend on the phase speed of the pressure perturbation. Consequently, within this spectral domain, one can readily tailor the surface response to flow excitation by varying the compliant layer thickness. This statement is relevant to cases involving stiff compliant material, where the shear speed is significantly higher than the flow speed. At low wavenumbers (
 $k_{x}l_{0}<2\unicode[STIX]{x03C0}/3$
), the surface response is high at a frequency of
 $\unicode[STIX]{x1D714}l_{0}/c_{t}\approx 1.45$
, i.e. slightly below
 $\unicode[STIX]{x03C0}/2$
, as indicated by a horizontal dotted line. This frequency corresponds to two roundtrips across the compliant layer at a phase speed of
 $c_{t}$
. For the present experimental conditions, advected phenomena in the relevant frequency range have a very short wavelength. Hence, the present conditions do not fall in the relevant frequency–wavenumber bandwidth to excite these modes.
For flow features propagating at the centreline velocity or similar values (
 $U_{0}$
and
 $0.72U_{0}$
are shown in figure 11), the intersection of the phase speed with the wavenumber–frequency spectrum provides a prediction for the frequency spectrum. This prediction assumes that the amplitude of pressure perturbations does not vary with frequency. The resulting spectra are presented as the flat
 $E_{pp}$
lines in figure 10 for pressure excitation with advection speeds of
 $0.72U_{0}$
and
 $U_{0}$
, and amplitude of 1.3
 $\unicode[STIX]{x1D70C}u_{\unicode[STIX]{x1D70F}}^{2}$
. This amplitude is selected to match that of the measured
 $E_{dd}$
. As is evident, the shapes of the predicted and measured deformation spectra appear to agree for frequencies falling in the
 $1<\unicode[STIX]{x1D714}h/U_{0}<12$
range. The frequency of the peak response at
 $\unicode[STIX]{x1D714}h/U_{0}\approx 4$
, is better predicted when
 $U_{0}$
is used as the advection speed. The analysis can be repeated for frequency- (or wavenumber-)dependent pressure amplitude using the measured pressure spectrum (figure 8). The result, which is also presented in figure 10 and labelled as ‘measured
 $E_{pp}$
’ is based on the pressure spectrum, including amplitude, at
 $y/h=0.03$
(
 $y^{+}=70$
). This spectrum has a similar shape as the others, but values are lower, and the peak location agrees with that corresponding to an advection speed of
 $0.72U_{0}$
. It appears that the Chase (Reference Chase1991) model predicts the response of the present ‘stiff’ compliant wall to advected pressure excitation. Conversely, below
 $\unicode[STIX]{x1D714}h/U_{0}\approx 1$
, the model and measured spectra diverge, presumably, since this range is dominated by features that are not advected with the flow, as the deformation movies show (supplementary movie 2). They might be associated with, for example, resonances or reflected waves associated with the finite boundaries of the compliant wall.
The measured streamwise wavenumber–frequency spectra of detrended deformation,
 $E_{dd}(k_{x},\unicode[STIX]{x1D714})$
, normalized by
 $[h(\unicode[STIX]{x1D70C}u_{\unicode[STIX]{x1D70F}}^{2}l_{0}/E^{\prime })]^{2}/U_{0}$
for the small and large FOV are presented in figure 12(a,b), respectively. They are calculated separately for each spanwise location using FFT in the streamwise and time directions. The resulting spectra are then spanwise-averaged. The small FOV data, which is presented on linear scales, has two inclined bands representing two advection modes of different speeds, which are presumably associated with flow structures located at different elevations in the boundary layer. In subsequent discussions, we refer to them as a ‘slow mode’, with an advection speed of
 $0.72U_{0}$
, and a ‘fast mode’ with speed of
 $U_{0}$
. The choices of pressure advection speeds in figure 11 are based on these modes. The fast mode band extends to higher frequencies and wavenumbers than the slow mode. The simulation of Kim & Choi (Reference Kim and Choi2014) also show a preferred advection speed of
 $0.72U_{0}$
, for stiff compliant surfaces, consistent with the present slow mode, but do not show a fast mode. At low frequencies, i.e.,
 $\unicode[STIX]{x1D714}h/U_{0}<4.3$
, the spectral contours are largely aligned in the horizontal direction, indicating that this range is dominated by non-advected features with nearly zero phase speed. Such bands have also been observed in the DNS results of Kim & Choi (Reference Kim and Choi2014), which they attribute to resonances of the spring and damper system that they utilize to model the compliant wall.
The measured wavenumber–frequency spectra of detrended deformation, with contours indicating the values of
 $\log _{10}\{E_{dd}(k_{x},\unicode[STIX]{x1D714})U_{0}/[h(\unicode[STIX]{x1D70C}u_{\unicode[STIX]{x1D70F}}^{2}l_{0}/E^{\prime })]^{2}\}$
. (a) Small field-of-view data on linear axes, with an incremental increase between contour lines of 0.15. (b) Large field-of-view data on logarithmic axes, with an incremental increase between contour lines of 0.3. The inclined solid and dashed lines represent advection speeds of
 $0.72U_{0}$
and
 $U_{0}$
, respectively. The vertical lines in each figure show the wavenumber of the corresponding field of view.

(a–c) Wavenumber–frequency spectra of pressure at (a)
 $y/h=0.35$
, (b)
 $y/h=0.12$
and (c)
 $y/h=0.05$
. (d–f) Pressure–deformation wavenumber–frequency cross-spectra at (d)
 $y/h=0.35$
, (e)
 $y/h=0.12$
and (f)
 $y/h=0.05$
. The dashed lines, solid lines and dotted lines correspond to phase speeds of
 $U_{0}$
,
 $0.72U_{0}$
and the local mean velocity, respectively. The vertical lines in each figure show the wavenumber of the corresponding field of view. The grey scales on (a–c) and (d–f) indicate the values of
 $\log _{10}\{E_{pp}(k_{x},\unicode[STIX]{x1D714})U_{0}/[h(\unicode[STIX]{x1D70C}u_{\unicode[STIX]{x1D70F}}^{2})]^{2}\}$
and
 $\log _{10}\{E_{pd}(k_{x},\unicode[STIX]{x1D714})U_{0}/[h^{2}(\unicode[STIX]{x1D70C}u_{\unicode[STIX]{x1D70F}}^{2})(\unicode[STIX]{x1D70C}u_{\unicode[STIX]{x1D70F}}^{2}l_{0}/E^{\prime })]\}$
, respectively.

The
 $k_{x}$
-
 $\unicode[STIX]{x1D714}$
spectrum for the large FOV (figure 12
b) is presented in logarithmic scale to highlight the low-frequency/wavenumber range. Here, at low wavenumber/frequency, the advection band is dominated by the fast mode, which is marked by a white dashed line. At high frequencies, the peak appears to tilt towards lower phase speeds, which falls between the fast and slow modes, the latter being marked by a solid white line. The differences between figure 12(a,b) for overlapping wavenumber ranges, in particular the lack of a distinct slow mode in the latter, can be attributed to the scale of the low-pass filtering and detrending. For a given frequency, large scales are attenuated more than small ones with decreasing filter size. Consequently, the fast mode is attenuated more than the slow mode in the detrended small FOV data, making the latter more visible. This effect has been verified by detrending the large FOV data at the small FOV scales. Results (not shown) confirm that the slow mode becomes more noticeable. Figure 12(b) also shows that energy corresponding to the fast mode extends to scales that are larger than the small FOV (
 $k_{x}h<9.4$
), consistent with the visual observations of large-scale deformation features moving at the centreline velocity (e.g. figure 6). With increasing FOV, the measurements should cover advected features that have frequencies falling below
 $\unicode[STIX]{x1D714}h/U_{0}\sim 4.3$
. Indeed, figure 12(b) shows that part of the energy at
 $\unicode[STIX]{x1D714}h/U_{0}<4.3$
corresponds to advected modes at low wavenumbers, where the spectral peak is located, but a substantial fraction is not. These features cannot be seen in the detrended small FOV surface shape, leaving only non-advected features at frequencies falling below
 $\unicode[STIX]{x1D714}h/U_{0}\sim 4.3$
(67 Hz), and creating the spectral dip at this frequency in figure 9(b).
In subsequent discussions, we correlate the flow structure and pressure field to the surface deformation. Considering that for the small FOV experiment, which provides the relevant data, frequencies corresponding to
 $\unicode[STIX]{x1D714}h/U_{0}<4.3$
do not contain advected modes. In the analysis that follows, the pressure and deformation are high-pass filtered at
 $\unicode[STIX]{x1D714}h/U_{0}=4.3$
. Intuitively, correlating the flow with the surface shape has to start with the pressure field. Hence, the pressure
 $k_{x}-\unicode[STIX]{x1D714}$
spectra,
 $E_{pp}(k_{x},\unicode[STIX]{x1D714})$
at three elevations, namely
 $y/h=0.35$
, 0.12 and 0.05, are presented in figure 13(a–c), respectively. They are calculated separately for each spanwise location, and then spatially averaged. The corresponding pressure–deformation cross
 $k_{x}-\unicode[STIX]{x1D714}$
spectra,
 $E_{pd}(k_{x},\unicode[STIX]{x1D714})$
, aimed at identifying pressure modes that affect the deformation, are presented in figure 13(d–f). They show the amplitude of the Fourier transform of the cross-correlation between deformation and pressure at the specified elevation. Each plot shows the centreline velocity (or the fast mode) as a dashed line, the slow mode,
 $0.72U_{0}$
, as a solid line, and the local mean velocity as a dotted line. All the pressure spectra show elevated energy at low wavenumber over a broad frequency range. This artefact is a direct result of setting the spatially averaged pressure over the entire sample volume to zero in the present analysis. In reality, this unavailable reference pressure varies in time, and zeroing it introduces a low wavenumber jitter. To partially resolve this problem, Ghaemi & Scarano (Reference Ghaemi and Scarano2013) use the Bernoulli equation to obtain a boundary condition away from the wall. Using this approach to estimate the reference pressure (e.g. on the upper surface) or frequency low-pass filtering of the signal decreases the magnitude of this band (not shown). This band has no significant effect on the present analysis, and we opt not to manipulate the signals further. At all elevations, the pressure spectra contain clear advection bands at speeds that decrease with elevation, and do not differ substantially from the corresponding mean velocity. This advection band is not as distinct at the lowest elevation (figure 13
c), but is still evident. The pressure–deformation cross-spectra in figures 13(d–f) also show clear advection bands at all elevations, with a phase speed that decreases with elevation. For the pressure at
 $y/h=0.12$
and 0.05, the phase speeds do not differ significantly from the slow mode or the local mean velocity. As for the pressure at
 $y/h=0.35$
, the advection band is largely concentrated in the low-frequency/wavenumber range, and the advection speed appears to span between the slow mode and the local mean velocity. With increasing frequency, the band tilts more towards the local mean velocity. A comparison between figures 13(a) and 13(d) suggests that the compliant wall is preferentially affected by the large-scale pressure features. With decreasing distance from the wall, the range of scales affecting the wall deformation expands. Assuming that the strength of eddies increases with their size, but their influences decrease with distance from their centre (the latter being clearly true for vortices), the expanding influence band with decreasing distance from the wall should be expected. These findings are consistent with findings of previous wall pressure fluctuations claiming that the observed scale dependence of the advection speeds is associated with the location of eddies in the boundary layer, with the smaller ones being preferentially located closer to the wall (e.g. Willmarth & Wooldridge Reference Willmarth and Wooldridge1962; Bull Reference Bull1967; Blake Reference Blake1970; Wills Reference Wills1970; Dinkelacker et al.
Reference Dinkelacker, Hessel, Meier and Schewe1977; Choi & Moin Reference Choi and Moin1990; Jeon et al.
Reference Jeon, Choi, Yoo and Moin1999; Ghaemi & Scarano Reference Ghaemi and Scarano2013; Salze et al.
Reference Salze, Bailly, Marsden and Juve2015).
3.3 Conditional correlations between deformation and flow variables
This section examines the relations between deformation and flow structure based on spatial correlations between the surface shape and flow variables (pressure, velocity, vorticity, etc.), as well as between pressure and other flow variables. The spatial conditional correlation between two functions,
 $f(x,y,z,t)$
and
 $g(x,y,z,t)$
, is defined as
 $$\begin{eqnarray}\displaystyle & & \displaystyle R_{f,g}(\unicode[STIX]{x0394}x,\unicode[STIX]{x0394}y,\unicode[STIX]{x0394}z)|_{f>\unicode[STIX]{x1D70E}_{f}}\nonumber\\ \displaystyle & & \displaystyle \quad \displaystyle =\frac{\langle f(x_{0},y_{0},z_{0},t)g(x_{0}+\unicode[STIX]{x0394}x,y_{0}+\unicode[STIX]{x0394}y,z_{0}+\unicode[STIX]{x0394}z,t)\rangle |\,f(x_{0},y_{0},z_{0},t)>\unicode[STIX]{x1D70E}_{f}}{\unicode[STIX]{x1D70E}_{f}(x_{0},y_{0},z_{0})\unicode[STIX]{x1D70E}_{g}(x_{0}+\unicode[STIX]{x0394}x,y_{0}+\unicode[STIX]{x0394}y,z_{0}+\unicode[STIX]{x0394}z)}\end{eqnarray}$$
the parameters involved are specified in the subscript,
 $\unicode[STIX]{x1D70E}_{f}$
and
 $\unicode[STIX]{x1D70E}_{g}$
are the r.m.s. values of
 $f$
and
 $g$
. In all cases, the correlations are calculated based on fluctuating components of each variable, but there is no need to subtract mean values for pressure and deformation because both are high-pass filtered. To highlight phenomena, in many of the correlations, we impose a condition of, for example, a deformation larger or smaller than its r.m.s. value, i.e.
 $d(x_{0},y_{0},z_{0})>\unicode[STIX]{x1D70E}_{d}$
or
 $d(x_{0},y_{0},z_{0})<-\unicode[STIX]{x1D70E}_{d}$
, respectively. The condition is indicated in the definition of the variable. In such cases, the r.m.s. values of
 $f$
and
 $g$
are still calculated from the original un-conditioned data. In correlations that do not involve any conditions,
 $R_{f,g}$
is used instead.
Conditional correlations between the detrended and high-pass filtered (at
 $\unicode[STIX]{x1D714}h/U_{0}=4.3$
) deformation at
 $(0,0)$
and pressure, based on (a,b) strong positive deformation (
 $d>\unicode[STIX]{x1D70E}_{d}$
) and (c,d) strong negative deformation (
 $d<-\unicode[STIX]{x1D70E}_{d}$
). The
 $y$
–
 $z$
planes in (b,d) correspond to
 $\unicode[STIX]{x0394}x/h=0.1$
, which is marked by dashed lines in (a,c). The position of peak value is indicated by a
 $+$
.

The loss tangent of PDMS based on the current measurement and several other sources.

Distributions of deformation–pressure conditional correlations based on large positive (
 $d>\unicode[STIX]{x1D70E}_{d}$
) event,
 $R_{d,p}|_{d_{{>}}\unicode[STIX]{x1D70E}d}$
, for the (
 $\unicode[STIX]{x0394}x,\unicode[STIX]{x0394}y,\unicode[STIX]{x0394}z=0$
) and (
 $\unicode[STIX]{x0394}x=0.1h,\unicode[STIX]{x0394}y,\unicode[STIX]{x0394}z$
) planes are presented in figure 14(a,b), respectively. Results conditioned on
 $d<-\unicode[STIX]{x1D70E}_{d}$
events,
 $R_{d,p}|_{d<-\unicode[STIX]{x1D70E}d}$
, are shown in figure 14(c,d), respectively. In all cases, the correlations are calculated for all surface points and then spatially averaged. As is evident, for positive deformation (bump), the negative correlation peak is located at
 $\unicode[STIX]{x0394}x/h\approx 0.1$
and
 $\unicode[STIX]{x0394}y/h\approx 0.12$
, i.e. the deformation lags behind the negative pressure influencing it most by
 ${\sim}0.1h$
in the streamwise direction. A second positive correlation peak with lower magnitude is located upstream, representing a high-pressure region. The streamwise separation between the positive and negative correlation peaks is approximately
 $0.25h$
, suggesting that the length scale of the pressure field relevant to the deformation is approximately
 $0.5h$
. The mean velocity at
 $\unicode[STIX]{x0394}y/h=0.12$
,
 $0.77U_{0}$
, is close to that of the deformation phase speed of the slow mode,
 $0.72U_{0}$
. It appears that structures affecting the wall deformation are located in the log-layer, at nearly the same elevation of the Reynolds shear stress peak (figure 7
b), and slightly above the plateau in streamwise velocity fluctuations. The resolution of present velocity and pressure measurements is too coarse for probing the buffer layer. However, the resolution of deformation measurements is sufficient for identifying structures as small as
 $0.015h$
. Yet, the wavenumber–frequency spectra of deformations (figure 12
a) indicate that they are dominated by phenomena having characteristic length scale larger than
 $0.13h(290\unicode[STIX]{x1D6FF}_{\unicode[STIX]{x1D708}})$
. Eddies with such scales are likely to reside in the log and/or outer layer, and are less likely to be located in the buffer layer. The
 $y{-}z$
distribution of correlation in figure 14(b) is presented in a plane (
 $\unicode[STIX]{x0394}x=0.1h$
) that coincides with the streamwise peak in figure 14(a). The
 $y{-}z$
correlation peak is located at the same elevation as that in the perpendicular plane and centred around
 $\unicode[STIX]{x0394}z=$
0. The distributions corresponding to negative deformation (figure 14
c,d) appear to be quite similar to those associated with positive deformation, with the same streamwise offsets. However, since
 $d<-\unicode[STIX]{x1D70E}_{d}$
, a negative correlation indicates positive pressure. Furthermore, the elevation of the correlation peak is slightly higher, which is located at
 $\unicode[STIX]{x0394}y/h\approx 0.14$
.
The next discussion is aimed at explaining the streamwise offset between pressure and deformation. It involves both the effect of damping by the compliant wall, as well as the structure of the pressure field in the boundary layer. Starting with the damping effect, one can use the Chase (Reference Chase1991) model to estimate phase lag. It requires knowledge of the viscoelastic properties of the compliant material, which are characterized by using complex moduli, i.e.,
 $E^{\prime }+\text{i}E^{\prime \prime }$
, (e.g. Fung Reference Fung1965; Ferry Reference Ferry1970), with
 $E^{\prime }$
being the storage modulus, and
 $E^{\prime \prime }$
the loss modulus. The key parameter is the frequency-dependent loss tangent,
 $\unicode[STIX]{x1D701}=E^{\prime \prime }/E^{\prime }$
. As shown in figure 15, the loss tangent of the PDMS utilized in the present study has only been measured in a low-frequency range (0.1–12 Hz), using the only instrument available to us. Data from several other sources (Fitzgerald & Fitzgerald Reference Fitzgerald, Fitzgerald and Meng1998; Conte & Jardret Reference Conte and Jardret2002; Kulik et al.
Reference Kulik, Semenov, Boiko, Seoudi, Chun and Lee2009; Du et al.
Reference Du, Cheng, Lu and Zhang2013; Rubino & Loppolo Reference Rubino and Loppolo2016) are compiled in the same plot in order to extend the frequency to conditions that are relevant for the present study. The shaded area in figure 15 covers the range of results of a series of measurements performed by Kulik et al. (Reference Kulik, Semenov, Boiko, Seoudi, Chun and Lee2009) for samples of various sizes. It appears that various results collapse below 10 Hz, but are scattered over a broad range above 67 Hz. To estimate the damping-induced phase lag, we start with
 $\unicode[STIX]{x1D701}=0.3$
, but repeat the calculation for other values as well. The streamwise offset between wall pressure and surface deformation based on the Chase (Reference Chase1991) model,
 $\unicode[STIX]{x0394}x_{\unicode[STIX]{x1D701}}$
, is shown in figure 16. Figure 16(a) demonstrates the effect of
 $\unicode[STIX]{x1D701}$
for pressure waves with wavelengths of
 $\unicode[STIX]{x1D706}/h=0.5$
, 1.0 and
 $2.0h$
and advection speeds of
 $0.72U_{0}$
(lines) and
 $U_{0}$
(symbols). As is evident, the values
 $\unicode[STIX]{x0394}x_{\unicode[STIX]{x1D701}}/\unicode[STIX]{x1D706}$
nearly collapse for the relevant range of phase speeds, i.e.
 $\unicode[STIX]{x0394}x_{\unicode[STIX]{x1D701}}/\unicode[STIX]{x1D706}$
is only weakly dependent on the frequency. The magnitude of
 $\unicode[STIX]{x0394}x_{\unicode[STIX]{x1D701}}/\unicode[STIX]{x1D706}$
increases with increasing
 $\unicode[STIX]{x1D701}$
, an expected trend because the associated increase in relaxation time (Ferry Reference Ferry1970). The weak effect of frequency is demonstrated in figure 16(b), which shows the distribution of
 $\unicode[STIX]{x0394}x_{\unicode[STIX]{x1D701}}/h$
for a fixed loss tangent of 0.3. Clearly, the contour lines are nearly vertical for the relevant range, indicating that varying the phase speed while keeping the wavelength constant has little effect on
 $\unicode[STIX]{x0394}x_{\unicode[STIX]{x1D701}}$
. Based on figure 14, choosing
 $\unicode[STIX]{x1D706}=0.5h$
, the model predicts a spatial offset of
 $0.024h$
, roughly 24 % of the observed value. Using higher (but reasonable) values for
 $\unicode[STIX]{x1D701}$
, for example,
 $\unicode[STIX]{x1D701}=0.4$
, would increase
 $\unicode[STIX]{x0394}x_{\unicode[STIX]{x1D701}}$
to 0.03
 $h$
, i.e. it still explains only a fraction of the measured offset. The rest must be related to the structure of the pressure field in the boundary layer.
The streamwise offset between deformation and pressure correlation peak predicted by the Chase (Reference Chase1991) model: (a) values of
 $\unicode[STIX]{x0394}x_{\unicode[STIX]{x1D701}}/\unicode[STIX]{x1D706}$
for pressure perturbations with the specified wavelengths and advection speeds, and (b) values of
 $\unicode[STIX]{x0394}x_{\unicode[STIX]{x1D701}}/h$
as functions of wavenumber and frequency for
 $\unicode[STIX]{x1D701}=0.3$
.

The structure of the pressure field in the channel flow can be inferred from two-point correlation of pressure,
 $R_{p,p}$
, which is plotted in figure 17 for a reference point located at
 $y_{0}/h=0.12$
. Consistent with many previous results (e.g. Kim Reference Kim1989; Tsuji et al.
Reference Tsuji, Fransson, Alfredsson and Johansson2007; Ghaemi & Scarano Reference Ghaemi and Scarano2013; Joshi et al.
Reference Joshi, Liu and Katz2014), the correlation contours are inclined at a rather large angle relative to the mean flow. Using the locus of points along which the correlation value has the slowest decay (white line), the estimated inclination angle around
 $y_{0}/h=0.12$
is
 $68^{\circ }$
. A linear extrapolation of this line to
 $y=0$
suggests that the wall pressure lags by
 $0.048h$
behind the field pressure at
 $y_{0}/h=0.12$
. A more accurate approach involves calculation of the distribution of pressure phase in the wavenumber–frequency cross-spectra of pressure at two different elevations,
 $$\begin{eqnarray}\displaystyle C_{p,p}(k_{x},\unicode[STIX]{x1D714};y) & = & \displaystyle \left[\int p(x,y,z_{0},t)\text{e}^{-\text{i}k_{x}x}\text{e}^{-\text{i}\unicode[STIX]{x1D714}t}\,\text{d}x\,\text{d}t\right]^{\ast }\nonumber\\ \displaystyle & & \displaystyle \times \,\left[\int p(x,y_{0}=0.12h,z_{0},t)\text{e}^{-\text{i}k_{x}x}\text{e}^{-\text{i}\unicode[STIX]{x1D714}t}\,\text{d}x\,\text{d}t\right].\end{eqnarray}$$
Here,
 $\ast$
denotes complex conjugate. The magnitude of the complex
 $C_{p,p}$
quantifies the level of correlation between the two signals. Its argument is the phase difference,
 $\unicode[STIX]{x0394}\unicode[STIX]{x1D6F7}(y)=\unicode[STIX]{x1D6F7}_{0.12_{h}}-\unicode[STIX]{x1D6F7}$
, between pressure at
 $y_{0}/h=0.12$
and other elevations, as a function of
 $k_{x}$
,
 $\unicode[STIX]{x1D714}$
and
 $y$
. Taking into account the fact that different modes are not equally correlated, the characteristic streamwise offset is estimated from the
 $|C_{p,p}|$
-weighted average of
 $\unicode[STIX]{x0394}\unicode[STIX]{x1D6F7}/k_{x}$
over the entire spectrum. The procedure is performed separately for each spanwise location and then averaged. The resulting profile of
 $\unicode[STIX]{x0394}x_{p,p}=\unicode[STIX]{x0394}\unicode[STIX]{x1D6F7}/k_{x}$
is presented in figure 18. Evidently, the wall pressure lags by
 $0.077h$
behind the pressure at
 $y/h=0.12$
. This value is higher than the result obtained from extrapolating the two-point correlations, because the magnitude of
 $R_{p,p}$
is dominated by local events, where the correlations are high. Hence, it is biased towards small-scale structures. Conversely, the spectral-based weighted-average value of
 $\unicode[STIX]{x0394}x_{p,p}$
favours highly correlated events across two elevations, namely large-scale structures as the distribution of
 $|C_{p,p}|$
demonstrates (not shown). This bias is consistent with the scales dominating the pressure–deformation cross-spectrum shown in figure 13(e), justifying the use of the spectral-based
 $\unicode[STIX]{x0394}x_{p,p}$
to estimate the streamwise offset. Figure 19 compares the measured streamwise offset (grey horizontal line) to the distribution of
 $\unicode[STIX]{x0394}x_{\unicode[STIX]{x1D701}}$
(for
 $\unicode[STIX]{x1D701}=0.3$
) and to the combined effect of material damping and structure of the pressure field, i.e.
 $\unicode[STIX]{x0394}x_{\unicode[STIX]{x1D701}}+\unicode[STIX]{x0394}x_{p,p}$
. The latter is provided for two values of
 $\unicode[STIX]{x1D701}$
to show that its value does not have a significant effect on the conclusions. As is evident, the combined effect agrees with the observed lag for the relevant frequency range
 $4.3<\unicode[STIX]{x1D714}h/U_{0}<40$
, shown in figure 13(e). The phase lag between pressure and deformation appears to be caused in part (
 ${\sim}24\,\%$
) by material damping, but for the most part by hydrodynamic phase lag between pressure in the log-layer, where the correlation peaks, and the wall pressure.
Distribution of two-point correlation of pressure (
 $R_{p,p}$
) for a reference point located at
 $(0,0.12h,0)$
.
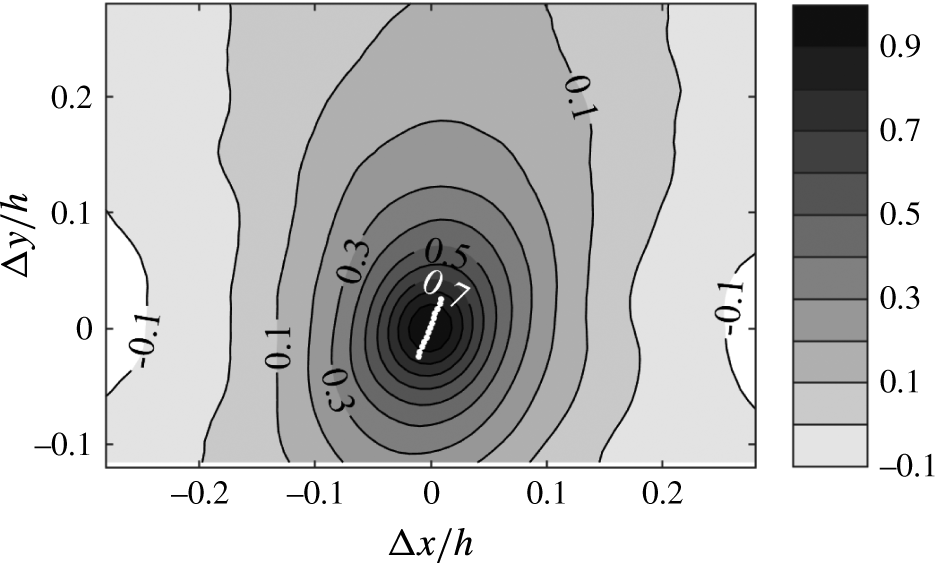
Profile of the average streamwise offset between the pressure at
 $y_{0}/h=0.12$
and that at other elevations. The values are calculated from the amplitude-weighted argument of pressure–pressure cross-spectrum.

A comparison of the measured streamwise offset of the deformation–pressure correlation peak to that caused by damping only, and the combined effects of hydrodynamic phase lag and material damping. The latter is provided for two values of loss tangent.

Correlations between surface deformation and flow velocity and/or vorticity distributions have been used in efforts aimed at identifying coherent flow structures associated with the wall shape. Here again, trends associated with large positive (
 $d>\unicode[STIX]{x1D70E}_{d}$
) and large negative (
 $d<-\unicode[STIX]{x1D70E}_{d}$
) deformations are displayed and discussed separately. The conditional correlations between wall deformation and three components of the velocity in selected planes are presented in figures 20 and 21. In these plots, the deformation is high-pass filtered at
 $\unicode[STIX]{x1D714}h/U_{0}=4.3$
, but the velocity is not, to account for effects of structures larger than FOV (further discussion follows). The analysis is performed for all planes and then spatially averaged. In addition to correlations, figures 20 and 21 also show the conditionally averaged projection of streamlines onto the
 $x{-}y$
and
 $y{-}z$
planes, respectively, calculated from the corresponding velocity components. The
 $y{-}z$
planes in figure 21 are presented at two streamwise locations,
 $\unicode[STIX]{x0394}x/h=0$
, where the deformation is measured, and
 $\unicode[STIX]{x0394}x/h=0.1$
, which is selected based on the peak of deformation–pressure correlations. In general, all the correlations associated with dimples are higher than those corresponding to bumps. Out of the velocity components,
 $v^{\prime }$
has the strongest correlation with the wall shape, followed by
 $u^{\prime }$
and
 $w^{\prime }$
. For positive deformations, the streamlines and signs of correlations in figure 20(a,c) appear like a swirling flow with preferentially negative
 $\unicode[STIX]{x1D714}_{z}^{\prime }$
centred at
 $\unicode[STIX]{x0394}x/h\,\approx \,0.1$
and
 $\unicode[STIX]{x0394}y/h\,\approx \,0.11$
, very close to the peak of
 $R_{d,p}|_{d>\unicode[STIX]{x1D70E}d}$
in figure 14(a). Above the deformation, where the correlation values are high, there is a steep ejection-like flow (Q2, with
 $u^{\prime }<0$
and
 $v^{\prime }>0$
). In the correlation maps involving spanwise velocity (figure 21
a,c) the magnitudes are quite low. Based on the streamlines in figure 21(a), and the signs of
 $R_{d,v}|_{d>\unicode[STIX]{x1D70E}d}$
in figure 20(c), the flow direction above the deformation peak (
 $\unicode[STIX]{x0394}x/h=0$
) is consistent with ‘anti-splatting’, i.e. a flow converging from both spanwise directions and turning upward. Although the signs of
 $R_{d,w}|_{d>\unicode[STIX]{x1D70E}d}$
at
 $\unicode[STIX]{x0394}x/h=0$
and
 $\unicode[STIX]{x0394}x/h=0.1$
are similar, the vertical velocity at the latter is nearly zero.
Conditional deformation–velocity correlations at
 $(\unicode[STIX]{x0394}x,\unicode[STIX]{x0394}y,\unicode[STIX]{x0394}z=0)$
for positive (a,c) and negative (b,d) deformations: (a)
 $R_{d,u}|_{d>\unicode[STIX]{x1D70E}d}$
, (b)
 $R_{d,u}|_{d<-\unicode[STIX]{x1D70E}d}$
, (c)
 $R_{d,v}|_{d>\unicode[STIX]{x1D70E}d}$
and (d)
 $R_{d,v}|_{d<-\unicode[STIX]{x1D70E}d}$
. The streamlines show the corresponding conditionally averaged flow fields.

Conditional deformation–spanwise velocity correlations for positive (
 $R_{d,w}|_{d>\unicode[STIX]{x1D70E}d}$
, a,c) and negative (
 $R_{d,w}|_{d<-\unicode[STIX]{x1D70E}d}$
, b,d) deformations: (a,b)
 $\unicode[STIX]{x0394}x=0$
, bottom row; (c,d)
 $\unicode[STIX]{x0394}x=0.1h$
. The streamlines show the corresponding conditionally averaged flow fields.

For negative deformations, both the streamlines and distribution of correlation in figure 20(b,d) show a sweeping flow (Q4, with
 $u^{\prime }>0$
and
 $v^{\prime }<0$
) above the deformation, and a transition between an upstream sweeping flow and a downstream ejection at
 $\unicode[STIX]{x0394}x/h\approx 0.1$
. The zero-crossing of
 $R_{d,v}|_{d<-\unicode[STIX]{x1D70E}d}$
at
 $\unicode[STIX]{x0394}x/h\approx 0.1$
coincides with the streamwise plane of maximum deformation–pressure correlation. The
 $y{-}z$
plane distribution of
 $R_{d,w}|_{d<-\unicode[STIX]{x1D70E}d}$
and streamlines at
 $\unicode[STIX]{x0394}x/h=0$
(figure 21
b) show a splatting flow impinging on the surface and turning outward in the spanwise direction. As shown in figure 22, the magnitude of the
 $R_{d,u}|_{d>\unicode[STIX]{x1D70E}d}$
and
 $R_{d,u}|_{d<-\unicode[STIX]{x1D70E}d}$
peaks increase significantly if the conditional correlations are calculated based on high-pass filtered velocity at
 $\unicode[STIX]{x1D714}h/U_{0}=4.3$
, similar to what is done for the deformation. The same increase occurs for correlations involving the other velocity components (not shown). For
 $d>\unicode[STIX]{x1D70E}_{d}$
, the dominant phenomenon in the region of peak correlation and above the deformation is an ejection. For
 $d<-\unicode[STIX]{x1D70E}_{d}$
, the flow direction reverses to a sweep over the same area. Apart from the higher correlation magnitudes, the only appreciable effect of filtering in the spatial distributions is a shift of
 $R_{d,u}|_{d>\unicode[STIX]{x1D70E}d}$
slightly upstream and away from the wall.
Distributions of conditional deformation–streamwise velocity correlations for high-pass filtered velocity at
 $\unicode[STIX]{x1D714}h/U_{0}=4.3$
: (a)
 $R_{d,u}|_{d>\unicode[STIX]{x1D70E}d}$
and (b)
 $R_{d,u}|_{d<-\unicode[STIX]{x1D70E}d}$
.

Given the connections established between deformation and pressure as well as between deformation and velocity, the ‘loop’ is closed by showing the distributions of conditional pressure–velocity (unfiltered) correlation in figure 23. They are based on the pressure measured at
 $y_{0}/h=0.12$
, where
 $\unicode[STIX]{x0394}x=\unicode[STIX]{x0394}y=0$
, and we follow the same procedures described for the deformation–velocity correlations, including spatial averaging over all planes, and calculation of the projection of conditionally averaged streamlines. This elevation is selected in view of the deformation–pressure correlations. To facilitate comparisons with figure 20, panels (a,c) show results for
 $p<-\unicode[STIX]{x1D70E}_{p}$
, and panels (b,d) correspond to
 $p>\unicode[STIX]{x1D70E}_{p}$
. The wall-normal velocity component has the strongest correlation with pressure, in agreement with trends reported in Joshi et al. (Reference Joshi, Liu and Katz2014), and consistent with trends of the deformation–velocity correlations. Although the shapes of streamlines differ, in part due to the elevation of the pressure conditioning point, the main flow feature in figure 23 for
 $p<-\unicode[STIX]{x1D70E}_{p}$
(distributions of
 $R_{p,u}|_{p<-\unicode[STIX]{x1D70E}p}$
and
 $R_{p,v}|_{p<-\unicode[STIX]{x1D70E}p}$
and corresponding streamlines) is a large-scale swirl, similar to that observed for
 $d>\unicode[STIX]{x1D70E}_{d}$
in figure 20, with the streamwise shift noted. In the same manner, the primary phenomenon for
 $p>\unicode[STIX]{x1D70E}_{p}$
is a saddle point with the flow above it resembling a sweep-ejection transition, consistent with the trends observed for
 $d<-\unicode[STIX]{x1D70E}_{d}$
. It should be noted that formation of a pressure maximum at the sweep to ejection transition has been observed in several prior studies, e.g. Kim (Reference Kim1983, Reference Kim1989), Kobashi & Ichijo (Reference Kobashi and Ichijo1986), Ghaemi & Scarano (Reference Ghaemi and Scarano2013), Joshi et al. (Reference Joshi, Liu and Katz2014), and Naka et al. (Reference Naka, Stanislas, Foucaut, Coudert, Laval and Obi2015).
The pressure–velocity conditional correlations, based on the pressure at
 $y=0.12h$
: (a)
 $R_{p,u}|_{p<-\unicode[STIX]{x1D70E}p}$
, (b)
 $R_{p,u}|_{p>\unicode[STIX]{x1D70E}p}$
, (c)
 $R_{p,v}|_{p<-\unicode[STIX]{x1D70E}p}$
, (d)
 $R_{p,v}|_{p>\unicode[STIX]{x1D70E}p}$
, (e)
 $R_{p,w}|_{p<-\unicode[STIX]{x1D70E}p}$
and (f)
 $R_{p,w}|_{p>\unicode[STIX]{x1D70E}p}$
. In (a–d)
 $\unicode[STIX]{x0394}z=0$
and in (e,f)
 $\unicode[STIX]{x0394}x=0$
.

Distributions of pressure–wall-normal velocity conditional correlations on the
 $\unicode[STIX]{x0394}z=0$
plane, based on the pressure at
 $(0,0.2h,0)$
: (a)
 $R_{p,v}|_{p<-\unicode[STIX]{x1D70E}p}$
; (b)
 $R_{p,v}|_{p>\unicode[STIX]{x1D70E}p}$
. Streamlines show the corresponding conditionally averaged flow field.

(a,b) Conditional deformation–spanwise vorticity correlations and (c,d) corresponding deformation-
 $\unicode[STIX]{x1D706}_{2}$
correlations: (a)
 $R_{d,\unicode[STIX]{x1D714}z^{\prime }}|_{d>\unicode[STIX]{x1D70E}d}$
, (b)
 $R_{d,\unicode[STIX]{x1D714}z^{\prime }}|_{d<-\unicode[STIX]{x1D70E}d}$
, (c)
 $R_{d,\unicode[STIX]{x1D706}2}|_{d>\unicode[STIX]{x1D70E}d}$
and (d)
 $R_{d,\unicode[STIX]{x1D706}2}|_{d<-\unicode[STIX]{x1D70E}d}$
.

There are a few more notable trends. First, for all velocity components, the correlation peaks associated with
 $p>\unicode[STIX]{x1D70E}_{p}$
are higher than those of
 $p<-\unicode[STIX]{x1D70E}_{p}$
, also in agreement with corresponding deformation–velocity correlations. Second, the magnitude of the
 $R_{p,u}|_{p<-\unicode[STIX]{x1D70E}p}$
(figure 23
a) peak is stronger under the ‘vortex’ than that above it, presumably since the horizontal velocity in regions located close to the wall is constructively influenced by the ‘image vortex’ on the other side of the surface. Third, the distribution of
 $R_{p,w}|_{p<-\unicode[STIX]{x1D70E}p}$
(figure 23
e) depicts an anti-splatting flow, but the magnitudes are low, and that of
 $R_{p,w}|_{p>\unicode[STIX]{x1D70E}p}$
(figure 23
f) appears like a splatting flow, with correlation magnitudes that are twice as high. The main difference between deformation–velocity and pressure–velocity correlations is the height of the peak. In the deformation–velocity correlations (figure 20), the centre of the swirl for
 $d>\unicode[STIX]{x1D70E}_{d}$
is located at
 $\unicode[STIX]{x0394}y/h\sim 0.11$
, whereas the swirl centre for
 $p<-\unicode[STIX]{x1D70E}_{p}$
and the saddle point at the centre of the
 $p>\unicode[STIX]{x1D70E}_{p}$
plot shift upward with the pressure conditioning point. For example, figure 24 provides the pressure–wall-normal velocity correlation and conditionally sampled streamlines for pressure measured at
 $y/h=0.2$
, showing similar flow features shifted to a higher elevation, and an increasing distance between positive and negative correlation peaks. The latter trend is expected due to increase in the size of characteristic eddies with distance from the wall (Townsend Reference Townsend1976; Perry & Chong Reference Perry and Chong1982).
The conditional correlations between deformation and vorticity components have been calculated in order to further characterize flow structures associated with the deformation. Figure 25(a,b) show the deformation–spanwise vorticity correlations conditioned on
 $d>\unicode[STIX]{x1D70E}_{d}(R_{d,\unicode[STIX]{x1D714}z^{\prime }}|_{d>\unicode[STIX]{x1D70E}d})$
and
 $d<-\unicode[STIX]{x1D70E}_{d}(R_{d,\unicode[STIX]{x1D714}z^{\prime }}|_{d<-\unicode[STIX]{x1D70E}d})$
, respectively. The peak of
 $R_{d,\unicode[STIX]{x1D714}z^{\prime }}|_{d>\unicode[STIX]{x1D70E}d}$
is located at
 $\unicode[STIX]{x0394}x/h\approx 0.1$
and
 $\unicode[STIX]{x0394}y/h\approx 0.1$
, very close to the centre of the spiral streamlines in figure 20(a,c) and the pressure–deformation correlation peak (figure 14
a). It is characterized by negative correlation values, suggesting that the bump is located preferentially behind/upstream of a region of negative spanwise vorticity fluctuation. To determine whether this vorticity is indeed associated with vortices, we also calculate the distribution of the conditional correlation between deformation and
 $\unicode[STIX]{x1D706}_{2}$
, which is a popular method for identifying vortices introduced by Jeong & Hussain (Reference Jeong and Hussain1995). Results for
 $d>\unicode[STIX]{x1D70E}_{d}$
, presented in figure 25(c), show that
 $\unicode[STIX]{x0394}x/h\approx 0.1$
is characterized by negative values of
 $\unicode[STIX]{x1D706}_{2}$
, confirming the preferred presence of a vortex. Distributions of
 $R_{d,\unicode[STIX]{x1D714}z^{\prime }}|_{d>\unicode[STIX]{x1D70E}d}$
in an
 $x{-}z$
plane for
 $\unicode[STIX]{x0394}y/h=0.1$
(figure 26
a) indicate the correlation peaks near
 $\unicode[STIX]{x0394}z=0$
, but it has a broad spanwise extent. Hence, the ejection regions above bumps are preferentially associated with negative spanwise vortices located downstream of the positive deformation. For negative deformations, figure 25(b) shows a region of preferentially positive
 $\unicode[STIX]{x1D714}_{z}^{\prime }$
, also at
 $\unicode[STIX]{x0394}x/h\approx 0.1$
and
 $\unicode[STIX]{x0394}y/h\approx 0.1$
. However, the corresponding values of
 $R_{d,\unicode[STIX]{x1D706}2}|_{d<-\unicode[STIX]{x1D70E}d}$
at
 $\unicode[STIX]{x0394}x/h\sim 0.1$
, which are presented in figure 25(d), are negative. Hence,
 $\unicode[STIX]{x1D706}_{2}$
is preferentially positive, i.e. the dimples are not associated with the presence of vortices, consistent with the shape of streamlines presented (figure 20). This observation indicates that the
 $\unicode[STIX]{x1D714}_{z}^{\prime }>0$
region at the sweep-ejection transition around
 $\unicode[STIX]{x0394}x/h=0.1$
is associated with low vorticity magnitude. It is presumably caused by a decrease in near-wall velocity gradients as the flow is slowing down under the influence of adverse pressure gradients, culminating with separation/ejection. The spanwise extent of this low-velocity-gradient region is broad, as demonstrated by the
 $x{-}z$
distribution of
 $R_{d,\unicode[STIX]{x1D714}z^{\prime }}|_{d<-\unicode[STIX]{x1D70E}d}$
presented in figure 26(b).
Conditional deformation–spanwise vorticity correlations in an
 $x{-}z$
plane located at
 $\unicode[STIX]{x0394}y/h=0.1$
: (a)
 $R_{d,\unicode[STIX]{x1D714}z^{\prime }}|_{d>\unicode[STIX]{x1D70E}d}$
; (b)
 $R_{d,\unicode[STIX]{x1D714}z^{\prime }}|_{d<-\unicode[STIX]{x1D70E}d}$
.

Conditional deformation–streamwise vorticity correlations in an
 $x{-}z$
plane located at
 $\unicode[STIX]{x0394}y/h=0.08$
: (a)
 $R_{d,\unicode[STIX]{x1D714}x^{\prime }}|_{d>\unicode[STIX]{x1D70E}d}$
; (b)
 $R_{d,\unicode[STIX]{x1D714}x^{\prime }}|_{d<-\unicode[STIX]{x1D70E}d}$
.

The conditional correlations between deformation and streamwise vorticity based on large positive (
 $R_{d,\unicode[STIX]{x1D714}x^{\prime }}|_{d>\unicode[STIX]{x1D70E}d}$
) and negative (
 $R_{d,\unicode[STIX]{x1D714}x^{\prime }}|_{d<-\unicode[STIX]{x1D70E}d}$
) deformations are shown in figure 27(a,b), respectively. Results are presented in an
 $x{-}z$
plane located at
 $\unicode[STIX]{x0394}y/h=0.08$
, which is the elevation where the correlation magnitudes peak. Distributions in other nearby elevations have similar shapes (not shown). In both cases, correlation extrema with low magnitudes are preferentially located in a different spanwise plane relative to the deformation conditioning point. The two correlation peaks with opposite signs at
 $-0.1<\unicode[STIX]{x0394}x/h<0.1$
in figure 27(a) indicate that bumps are preferentially developed in regions where the streamwise-vortex-induced wall-normal velocity is positive (ejections). Further downstream, at
 $\unicode[STIX]{x0394}x/h>0.1$
, the correlation extrema have opposite signs, consistent with a sweeping motion. As demonstrated later, and consistent with the spanwise vortex at
 $\unicode[STIX]{x0394}x/h\sim 0.1$
(figures 25
a and 26
a), the bumps preferentially form under and upstream of the head of a hairpin vortex.
(a–c) Results of analysis conditioned on
 $d(0,0)>\unicode[STIX]{x1D70E}_{d}$
and
 $\unicode[STIX]{x1D714}_{x}^{\prime }(0,0.08h,0.05h)>0$
: (a)
 $d$
–
 $\unicode[STIX]{x1D714}_{x}^{\prime }$
correlation in the
 $\unicode[STIX]{x0394}z/h=0.05$
plane; (b)
 $d$
–
 $\unicode[STIX]{x1D714}_{z}^{\prime }$
correlation at
 $\unicode[STIX]{x0394}z/h=0$
; (c) iso-surfaces of
 $\overline{\unicode[STIX]{x1D714}_{x}^{\prime }h/U_{0}}=-0.17$
,
 $=0.25$
and
 $\overline{\unicode[STIX]{x1D714}_{z}^{\prime }h/U_{0}}=-0.20$
, along with the corresponding vortex lines; and (d) pressure–spanwise vorticity correlation conditioned on
 $p<-\unicode[STIX]{x1D70E}_{p}$
(at
 $y=0.12h$
, as indicated by a
 $+$
) in the
 $\unicode[STIX]{x0394}z=0$
plane.

This relationship between
 $\unicode[STIX]{x1D714}_{x}^{\prime }$
,
 $\unicode[STIX]{x1D714}_{z}^{\prime }$
, and positive deformation is further investigated by calculating the deformation–vorticity correlations, conditioned on both
 $d(0,0)>\unicode[STIX]{x1D70E}_{d}$
, and
 $\unicode[STIX]{x1D714}_{x}^{\prime }(0,0.08h,0.05h)>0$
. Results for
 $d$
–
 $\unicode[STIX]{x1D714}_{x}^{\prime }$
correlation in the
 $\unicode[STIX]{x0394}z/h=0.05$
plane is presented in figure 28(a), and that for
 $d$
–
 $\unicode[STIX]{x1D714}_{z}^{\prime }$
in the
 $\unicode[STIX]{x0394}z/h=0$
plane in figure 28(b). The vertical coordinates are expressed both in terms of
 $\unicode[STIX]{x0394}y/h$
and
 $y/h$
. The fact that the
 $d$
–
 $\unicode[STIX]{x1D714}_{x}^{\prime }$
correlation peaks at the conditioning point is not meaningful because the positive values are imposed. However, figure 28(a) also shows an inclined layer of elevated correlations extending from both sides of the peak having the familiar angle of
 $15^{\circ }$
–
 $20^{\circ }$
(exact value depends on the criterion used) with the horizontal direction. The same angle has been seen for
 $R_{u,u}$
in many studies (e.g. Kim Reference Kim1989; Liu, Adrian & Hanratiy Reference Liu, Adrian and Hanratiy2001; Hutchins & Marusic Reference Hutchins and Marusic2007b
; Wu & Christensen Reference Wu and Christensen2010; Ghaemi & Scarano Reference Ghaemi and Scarano2013; Sillero, Jiménez & Moser Reference Sillero, Jiménez and Moser2014), and have been attributed to hairpin vortices (Adrian, Meinhart & Tomkins Reference Adrian, Meinhart and Tomkins2000). Furthermore, figure 28(b) shows a region of high correlation with negative spanwise vorticity downstream, above and spanwise offset from the
 $\unicode[STIX]{x1D714}_{x}^{\prime }$
conditioning point. The elevation of this peak,
 $y/h\,=\,0.13$
, falls within the broad minimum in figure 25(a) (both are conditioned on
 $d>\unicode[STIX]{x1D70E}_{d}$
), but adding the offset
 $\unicode[STIX]{x1D714}_{x}^{\prime }$
constraint increases the
 $d$
–
 $\unicode[STIX]{x1D714}_{z}^{\prime }$
correlation peak magnitude by
 ${\sim}100\,\%$
. Hence, the elevated
 $d$
–
 $\unicode[STIX]{x1D714}_{x}^{\prime }$
correlation appears to be a leg of a hairpin vortex, and the
 $d$
–
 $\unicode[STIX]{x1D714}_{z}^{\prime }$
correlation peak is the head of this vortex. Additional confirmation can be obtained by plotting the conditionally averaged flow field under the same conditions. Figure 28(c) shows iso-surfaces of
 $\overline{\unicode[STIX]{x1D714}_{x}^{\prime }h/U_{0}}=-0.17$
and 0.25, as well as
 $\overline{\unicode[STIX]{x1D714}_{z}^{\prime }h/U_{0}}=-0.2$
in different colours (overbar indicates conditionally averaged variable). It confirms the preferred presence of an inclined quasi-streamwise vortex as well as a counter-rotating (negative) vortex on the other side of the deformation, located at a distance of
 $\unicode[STIX]{x0394}z=0.15h(\unicode[STIX]{x0394}z^{+}=350)$
from the conditioning point. It also shows the region with high
 $\overline{\unicode[STIX]{x1D714}_{z}^{\prime }h/U_{0}}$
at the head of the hairpin. Finally, figure 28(c) also shows several conditionally averaged vortex lines originating from the vicinity of the vorticity conditioning point, passing through the hairpin head, and turning back into the other leg. Clearly, the positive deformation is located upstream of a negative spanwise vortex and flanked by streamwise vortices of opposite signs, consistent with the features of a hairpin-like structure. If the analysis is repeated by imposing
 $\unicode[STIX]{x1D714}_{x}^{\prime }(0,0.08h,-0.05h)<0$
, the 3D depiction appears to be quite similar (not shown) except for a swap in the size of the iso-surfaces of
 $\overline{\unicode[STIX]{x1D714}_{x}^{\prime }h/U_{0}}$
, corresponding to the location of the conditioning point. The picture becomes complete by plotting the distribution of pressure–spanwise vorticity correlation, conditioned on
 $p(0,0.12h,0)<-\unicode[STIX]{x1D70E}_{p}$
in figure 28(d). It shows that the pressure minimum is located in the same streamwise plane but slightly below the negative spanwise vorticity peak, and falls within the broad deformation–pressure correlation peak in figure 14(a). Hence, the pressure minimum preferentially causing the bump upstream of the hairpin head is located slightly below the point of peak spanwise vorticity. Such a vertical offset between the locations of pressure and spanwise vorticity minima in a hairpin structure is consistent with trends reported by Ghaemi & Scarano (Reference Ghaemi and Scarano2013). Their measurements focus on the
 $y^{+}<149$
region, and show a distance of
 $\unicode[STIX]{x0394}z^{+}\approx 80$
between the hairpin legs, and the present observations extend to higher elevation with the corresponding larger distance between legs.
For negative deformations, we have already established that there is no spanwise vortex in front of dimples in the vicinity of the
 $d$
–
 $\unicode[STIX]{x1D714}_{z}^{\prime }$
correlation peak (figure 25
b,d). The pressure maximum causing this dimple is preferentially associated with a transition between sweep and ejection (figure 23
b,d). The positive spanwise vorticity fluctuation ahead of the dimple is located in the ejection region, where the averaged vorticity is lower than the mean (negative) value. As illustrated in numerous papers, for example, Kim (Reference Kim1983, Reference Kim1989), Kobashi & Ichijo (Reference Kobashi and Ichijo1986), Chang, Piomelli & Blake (Reference Chang, Piomelli and Blake1999), Ghaemi & Scarano (Reference Ghaemi and Scarano2013), Joshi et al. (Reference Joshi, Liu and Katz2014) and Naka et al. (Reference Naka, Stanislas, Foucaut, Coudert, Laval and Obi2015), an inclined shear layer forms at the interface between an upstream sweep to a downstream ejection. The vicinity of the origin of this layer is shown in figures 20(b) and 23(b), and a more extended view is evident from the conditionally average pressure distribution and streamlines presented in figure 29 for
 $p(0,0.02h,0)>\unicode[STIX]{x1D70E}_{p}$
. Inclination of this shear layer might be contributing to the (hydrodynamically induced) streamwise phase lag between dimples and the positive pressure fluctuations at
 $y/h>0.12$
, the location of peak correlation (figure 14
c,d). In addition, the correlation peaks at
 $-0.1<\unicode[STIX]{x0394}x/h<0.1$
in figure 27(b) indicate that dimples preferentially form in regions with streamwise-vortex-induced downward sweeping flows. Such a phenomenon is not necessarily associated with sweep-ejection transition. However, as figure 27(b) shows, the deformation–streamwise vorticity correlation sign changes at
 $\unicode[STIX]{x0394}x/h>0.1$
. Such a change might occur, for example, at a sweep-ejection transition, where the direction of velocity fluctuation changes abruptly.
The conditionally averaged pressure distribution and streamlines, based on
 $p(0,0.02h,0)>\unicode[STIX]{x1D70E}_{p}$
.

4 Summary and concluding remarks
The effect of a turbulent channel flow on deformation of a compliant wall is investigated experimentally using simultaneous time-resolved TPIV to measure the 3D flow and MZI to map the distribution of surface deformation. As summarized in appendix B, the TPIV data is used for determining the pressure distributions by calculating the spatial distribution of material acceleration and integrating it spatially. In a separate experiment MZI alone is used for mapping the wall shape for a larger FOV. The present PDMS wall could be characterized as ‘stiff’ because its shear speed (
 $17~\text{m}~\text{s}^{-1}$
) is much higher than the channel centreline velocity (
 $2.5~\text{m}~\text{s}^{-1}$
). Hence, after detrending and filtering out the channel vibrations, the amplitudes of wall deformations are much smaller than the wall unit, resulting in one-way coupling between the flow and the wall. Accordingly, the profiles of mean velocity and Reynolds stresses are consistent with those of typical turbulent channel flows.
The surface dynamics consist of several components. The low-frequency (
 $\unicode[STIX]{x1D714}h/U_{0}<1.6$
) part does not appear to travel with the flow. At higher frequencies, two deformation advection speeds are prevalent. The ‘fast’ mode travels at
 $U_{0}$
, and has a characteristic length scale of approximately
 $1.9h$
. This mode is larger than the FOV of the combined TPIV/MZI experiment, and is only captured by the MZI measurements with a large FOV. Based on the Chase (Reference Chase1991) model, which is described in appendix A, a stiff compliant wall is most sensitive to pressure perturbations with a wavelength of approximately three times the coating thickness. In the present study, this length scale happens to corresponds to
 ${\sim}1.9h$
, consistent with measured wavelength of the fast mode. Hence, one could tune the compliant surface response and match it with desired flow features by varying its thickness. For the present conditions, the advected response of the wall to boundary layer turbulent structures occurs at a ‘slow’ mode, which travels at
 $0.72U_{0}$
based on the slope of the wavenumber–frequency spectra, and has a length scale approximately
 $0.5h$
. The spatial conditional correlations between deformation and pressure peak at
 $y/h\sim 0.12$
(
 $y^{+}\sim 280$
) for bumps and
 ${\sim}0.14$
for dimples, where the mean flow velocity (
 ${\sim}0.77U_{0}$
) is only slightly higher than the speed of the slow mode. Hence, turbulent structures at this elevation, which are located in the log-layer, and correspond to the peak in Reynolds shear stress and the end of the plateau in the streamwise velocity fluctuations, have dominant effects on the wall deformation. The
 $\langle u^{\prime }u^{\prime }\rangle /u_{\unicode[STIX]{x1D70F}}$
plateau has been attributed to large-scale motions in the outer part of the boundary layer (Marusic et al.
Reference Marusic, Mathis and Hutchins2010; Hultmark Reference Hultmark2012). However, the pressure–deformation cross-spectra show that the surface response to turbulent pressure fluctuations is broad, and the range of scales involved expands to higher wavenumbers with decreasing distance from the wall.
The spatial correlation peak shows a streamwise phase lag between deformation and pressure at
 $y/h\sim 0.12$
. For the present conditions, only a small fraction of this offset (
 ${\sim}24\,\%$
) is attributed to the viscoelastic damping by the material, as predicted from the Chase (Reference Chase1991) model. This contribution is weakly dependent on the material loss tangent, and decreases slightly with increasing frequency. Most of the offset (
 ${\sim}76\,\%$
) is associated with variations of pressure phase with elevations, namely a phase lag of the near-wall pressure relative to that in the log-layer. This lag is evident both in the spatial two-point correlation of pressure, which is inclined slightly, and the corresponding cross-spectra. Both the material and hydrodynamic phase lags should be accounted for while developing flow control strategies involving compliant surfaces. It should be noted that phase lags between near-wall small-scale structures and log-layer turbulence have been reported before based on velocity measurements (e.g. Mathis et al.
Reference Mathis, Hutchins and Marusic2011; Ganapathisubramani et al.
Reference Ganapathisubramani, Hutchins, Monty, Chung and Marusic2012).
Conceptual models for the relationships between coherent flow structure and wall deformation: (a) a bump formed between the legs of a hair pin vortex; (b) a dimple forming at the transition between a sweep and an ejection; and (c) negative deformations on the sweeping side of streamwise vortices.

A series of conditional correlations are used for identifying flow structures affecting the formation of bumps and dimples on the surface. The spatial relationships between the flow and deformation field are summarized in conceptual models shown in figure 30. The bumps are preferentially situated in ejection regions upstream of log-layer negative spanwise vortices, and pressure minima located slightly below the vortex centre (figure 30 a). When the conditional correlation includes streamwise vorticity, the 3D flow phenomenon involved appears like a hairpin vortex, with the bump being flanked by quasi-streamwise vortices, below and behind the hairpin head. Conversely, the dimples are preferentially associated with pressure maxima developing at the transition between sweep and ejection regions (figure 30 b). The phase lag is attributed to the inclination of the shear layer at the sweep-ejection interface. Dimples also form on the sweeping flow side of streamwise vortices (figure 30 c).
Although the Chase (Reference Chase1991) model, as it is presently implemented (see appendix A), is two-dimensional and has an infinite domain, using it has been instrumental for (i) elucidating the frequency spectrum of the deformation, (ii) quantifying the contribution of material damping on the deformation–pressure phase lag, (iii) highlighting the effect of varying the wall thickness on the wavelength of peak response for stiff materials, and the frequency of peak response at low wavenumbers, and (iv) showing that for the present conditions, the effect of shear stresses is much smaller than that of the pressure. Finally, the frequency–wavenumber spectrum obtained from this model provides insightful guidance in selecting flow and compliant wall parameters for future research. For example, to increase the wall response to pressure fluctuations, one has to match the shear speed of the wall with that of either the mean flow speed or with the velocity at an elevation where the turbulence parameters have the highest correlation with the wall deformation. Conversely, to explain and elucidate for non-advected parts of the measured deformation, one would have to account for the three dimensionality of stress/strain field within the compliant wall, including the effects of its finite boundaries.
Acknowledgements
This project is supported by the Office of Naval Research under grant no. N000140910621. Dr D. Nalchajian is the programme officer. Funding for purchasing the instrumentation associated with the TPIV and MZI systems has been provided in part by NSF MRI grant, and in part by an ONR DURIP grant.
Supplementary movies
Supplementary movies are available at https://doi.org/10.1017/jfm.2017.299.
Appendix A. The Chase (Reference Chase1991) model
This appendix summarizes our implementation of the Chase (Reference Chase1991) classical model of the response of a viscoelastic layer to fluctuating pressure and wall shear stresses, because of its significance to interpretation of the present data. The geometry of the infinitely large compliant layer is two-dimensional, with only streamwise and wall-normal deformation components, denoted as
 $d_{x}(x,y,t)$
and
 $d_{y}(x,y,t)$
, respectively. In the rest of this paper we use
 $d=d_{y}(x,y=0,t)$
to describe the surface deformation. The prescribed 1D pressure and shear waves at the interface with the fluid are
 $p_{0}\exp [\text{i}(kx-\unicode[STIX]{x1D714}t)]$
and
 $\unicode[STIX]{x1D70F}_{0}\exp [\text{i}(kx-\unicode[STIX]{x1D714}t)]$
, respectively, where
 $p_{0}$
and
 $\unicode[STIX]{x1D70F}_{0}$
represent small wave amplitudes. The material behaviour is modelled using the Navier equation for an elastic material (Landau & Lifshitz Reference Landau and Lifshitz1970):
 $$\begin{eqnarray}\displaystyle \unicode[STIX]{x1D70C}_{c}\frac{\unicode[STIX]{x2202}^{2}\boldsymbol{d}}{\unicode[STIX]{x2202}t^{2}}=\frac{E}{2(1+\unicode[STIX]{x1D70E})}\unicode[STIX]{x1D735}^{2}\boldsymbol{d}+\frac{E}{2(1+\unicode[STIX]{x1D70E})(1-2\unicode[STIX]{x1D70E})}\unicode[STIX]{x1D735}(\unicode[STIX]{x1D735}\boldsymbol{\cdot }\boldsymbol{d}), & & \displaystyle\end{eqnarray}$$
where
 $\boldsymbol{d}=d_{x}\boldsymbol{i}+d_{y}\boldsymbol{j}$
is the displacement vector (boldface denotes a vector),
 $\unicode[STIX]{x1D70C}_{c}$
is the material density,
 $\unicode[STIX]{x1D70E}$
is the Poisson’s ratio and
 $E$
is the Young’s modulus. Viscoelasticity is accounted for by replacing
 $E$
with a complex modulus
 $\tilde{E}=E^{\prime }+\text{i}E^{\prime \prime }$
, introducing the loss tangent,
 $\unicode[STIX]{x1D701}=E^{\prime \prime }/E^{\prime }$
. The wall deformation is solved by expressing the
 $\boldsymbol{d}$
in terms of a scalar potential,
 $\unicode[STIX]{x1D711}$
, and a vector potential,
 $\unicode[STIX]{x1D713}$
, using the Helmholtz decomposition,
 $$\begin{eqnarray}d_{x}=\frac{\unicode[STIX]{x2202}\unicode[STIX]{x1D711}}{\unicode[STIX]{x2202}x}+\frac{\unicode[STIX]{x2202}\unicode[STIX]{x1D713}}{\unicode[STIX]{x2202}y};\quad d_{y}=\frac{\unicode[STIX]{x2202}\unicode[STIX]{x1D711}}{\unicode[STIX]{x2202}y}-\frac{\unicode[STIX]{x2202}\unicode[STIX]{x1D713}}{\unicode[STIX]{x2202}x}.\end{eqnarray}$$
Substituting (A 2) into (A 1), one can show that both
 $\unicode[STIX]{x1D711}$
and
 $\unicode[STIX]{x1D713}$
are solutions of the wave equation with complex wave speeds,
 $c_{l}$
and
 $c_{t}$
, respectively. Their relations to the material properties are
 $$\begin{eqnarray}\displaystyle & \left.\begin{array}{@{}l@{}}\displaystyle c_{l}=\sqrt{\frac{E(1-\unicode[STIX]{x1D70E})}{\unicode[STIX]{x1D70C}(1+\unicode[STIX]{x1D70E})(1-2\unicode[STIX]{x1D70E})}}\\ \displaystyle c_{t}=\sqrt{\frac{E}{2\unicode[STIX]{x1D70C}(1+\unicode[STIX]{x1D70E})}}.\end{array}\right\} & \displaystyle\end{eqnarray}$$
The solutions to the wave equations are
 $$\begin{eqnarray}\displaystyle & \left.\begin{array}{@{}l@{}}\displaystyle \unicode[STIX]{x1D711}(x,y,t)=\hat{\unicode[STIX]{x1D711}}(y)\text{e}^{\text{i}(kx-\unicode[STIX]{x1D714}t)}\\ \displaystyle \unicode[STIX]{x1D713}(x,y,t)=\hat{\unicode[STIX]{x1D713}}(y)\text{e}^{\text{i}(kx-\unicode[STIX]{x1D714}t)},\end{array}\right\} & \displaystyle\end{eqnarray}$$
with amplitudes
 $$\begin{eqnarray}\displaystyle & \left.\begin{array}{@{}l@{}}\displaystyle \hat{\unicode[STIX]{x1D711}}(y)=a_{l}\sinh [K_{l}(y+l_{0})]+b_{l}\cosh [K_{l}(y+l_{0})]\\ \displaystyle \hat{\unicode[STIX]{x1D713}}(y)=a_{t}\sinh [K_{t}(y+l_{0})]+b_{t}\cosh [K_{t}(y+l_{0})].\end{array}\right\} & \displaystyle\end{eqnarray}$$
Here,
 $K_{l}=(k^{2}-\unicode[STIX]{x1D714}^{2}/c_{l}^{2})^{1/2}$
and
 $K_{t}=(k^{2}-\unicode[STIX]{x1D714}^{2}/c_{t}^{2})^{1/2}$
. The four unknown constants,
 $a_{l}$
,
 $b_{l}$
,
 $a_{t}$
and
 $b_{t}$
, are determined based on the boundary conditions. At the interface with the fluid (
 $y=0$
), the normal and shear stresses,
 $\unicode[STIX]{x1D70E}_{yy}$
and
 $\unicode[STIX]{x1D70E}_{xy}$
, are
 $$\begin{eqnarray}\displaystyle & \left.\begin{array}{@{}c@{}}\displaystyle \unicode[STIX]{x1D70E}_{yy}(y=0)=[-p_{0}+\text{i}\unicode[STIX]{x1D714}\,d_{y}(y=0)z_{+}]\text{e}^{\text{i}(kx-\unicode[STIX]{x1D714}t)}\\ \unicode[STIX]{x1D70E}_{xy}(y=0)=\unicode[STIX]{x1D70F}_{0}\text{e}^{\text{i}(kx-\unicode[STIX]{x1D714}t)},\end{array}\right\} & \displaystyle\end{eqnarray}$$
where
 $z_{+}$
is the acoustic impedance of the liquid, which accounts for the fluid loading. Assuming that the bottom surface is rigid,
 $d_{x}(x,-l_{0},t)=d_{y}(x,-l_{0},t)=0$
. A MATLAB code has been written to calculate the amplitudes of pressure and shear-induced deformations. To validate that the model is implemented correctly, we have repeated all calculations discussed in Chase (Reference Chase1991), and compared them to those provided in the original plots, including cases with non-rigid bottom boundary conditions. The results agree to the precision possible by digitizing the original plots. Subsequently, the MATLAB code has been used to calculate the wavenumber–frequency spectrum provided in figure 11 for pressure perturbation. The corresponding response to shear only has also been calculated. The wavenumber–frequency distribution of the ratio between pressure-induced and shear-induced deformation in response to excitation with the same amplitude (
 $p_{0}=\unicode[STIX]{x1D70F}_{0}$
) is presented in figure 31. Clearly, the compliant surface is much more sensitive to the pressure perturbations in the wavenumber and frequency ranges relevant to the present study. Hence, the effect of shear stresses on the surface deformation is neglected.
The ratio between deformation amplitudes in response to pressure and shear perturbations of equal amplitudes, as predicted by the Chase (Reference Chase1991) model.

Appendix B. Calculation of pressure field
The instantaneous pressure field is spatially integrated from its gradient,
 $\unicode[STIX]{x1D735}p=-\unicode[STIX]{x1D70C}(\text{D}\boldsymbol{u}/\text{D}t-\unicode[STIX]{x1D708}\unicode[STIX]{x1D735}^{2}\boldsymbol{u})$
, using the measured velocity distributions to calculate the material acceleration (
 $\text{D}\boldsymbol{u}/\text{D}t$
). Although calculated to determine its magnitude/influence, the viscous diffusion term is neglected since it is typically several orders of magnitude smaller than the instantaneous material acceleration. The pressure reconstruction involves two steps, i.e. calculation of material acceleration and pressure integration. As discussed in Liu & Katz (Reference Liu and Katz2013) and de Kat & van Oudheusden (Reference de Kat and van Oudheusden2010), the material acceleration at time
 $t_{n}$
is calculated from five consecutive 3D particle distributions
 $I_{n-2}$
,
 $I_{n-1}$
,
 $I_{n}$
,
 $I_{n+1}$
,
 $I_{n+2}$
recorded at times
 $t_{n-2}$
,
 $t_{n-1}$
,
 $t_{n}$
,
 $t_{n+1}$
,
 $t_{n+2}$
, respectively, which are separated by a constant time interval
 $\unicode[STIX]{x0394}t$
. The positions of a group of particles located around
 $\boldsymbol{x}_{n}$
at
 $t_{n}$
, in frames recorded at
 $t_{n-1}$
and
 $t_{n+1}$
are calculated, using TPIV, from the corresponding displacement vectors,
 $\boldsymbol{D}_{n,n-1}(\boldsymbol{x}_{n})$
and
 $\boldsymbol{D}_{n,n+1}(\boldsymbol{x}_{n})$
. Using the same initial instant and location, as defined by the first subscript, and calculating the displacements both forward and backward in time assure that the procedure follows the motion of the same particle group. In other words, the interrogation volume at
 $t_{n}$
remains at
 $\boldsymbol{x}_{n}$
for both calculations, and displaced to
 $\boldsymbol{x}_{n}+\boldsymbol{D}_{n,n-1}$
at
 $t_{n-1}$
and to
 $\boldsymbol{x}_{n}+\boldsymbol{D}_{n,n+1}$
at
 $t_{n+1}$
. The velocity of this particle group at
 $t_{n}$
is estimated using second-order central differencing, namely
 $\boldsymbol{u}_{n}\approx [\boldsymbol{D}_{n,n+1}(\boldsymbol{x}_{n})-\boldsymbol{D}_{n,n-1}(\boldsymbol{x}_{n})]/(2\unicode[STIX]{x0394}t)$
. The corresponding material acceleration is estimated from
 $$\begin{eqnarray}\displaystyle & \text{D}\boldsymbol{u}/\text{D}t(\boldsymbol{x}_{n},t_{n})\approx [\boldsymbol{u}_{n+1}(\boldsymbol{x}_{n}+\boldsymbol{D}_{n,n+1},t_{n+1})-\boldsymbol{u}_{n-1}(\boldsymbol{x}_{n}+\boldsymbol{D}_{n,n-1},t_{n-1})]/(2\unicode[STIX]{x0394}t). & \displaystyle\end{eqnarray}$$
Since the particle displacement between exposures involves a fraction of the vector spacing, the velocity at
 $\boldsymbol{x}_{n}+\boldsymbol{D}_{n,n-1}$
and
 $\boldsymbol{x}_{n}+\boldsymbol{D}_{n,n+1}$
is obtained using tri-cubic interpolation of values calculated at the regular TPIV grid points.
To spatially integrate the material acceleration, we have developed a GPU-based 3D virtual-boundary omni-directional integration method, extending the 2D procedures described in Liu & Katz (Reference Liu and Katz2013). To minimize effects of errors occurring along certain integration path, the pressure at every point is determined based on spatial integration from the boundaries in all directions, and averaging results obtained for all paths. To prevent directional bias, the integration starts from uniformly distributed points on the surface of a sphere surrounding the sample volume, and proceeds along parallel lines in all directions, from one surface grid point to all the others. A similar integration procedure is described in Liu, Moreto & Siddle-Mitchell (Reference Liu, Moreto and Siddle-Mitchell2016). To obtain the pressure on the boundary for the initial iteration, we start at a certain point and integrate the pressure gradients (acceleration) over the surface. Subsequently, the surface values are updated based on the results of 3D omni-directional integration. The corrected values are used in the next iteration, and the process is repeated, typically requiring two iterations to achieve converged values. Further reduction in errors can be achieved by avoiding (circumventing) regions where the acceleration errors are particularly high. These regions can be readily identified based on local closed-loop integration of material acceleration. Due to the large number of integration paths involved, the omni-directional integration procedure is implemented on a Tesla K40c GPU board. It reduces the processing time of one instantaneous realization from approximately 6 h on a quad-core personal computer to approximately 2 min.
An alternative approach for calculating the pressure is based on solving the pressure Poisson equation, which requires the estimation of the second-order derivative of the velocity, along with proper combination of Neumann and/or Dirichlet-type boundary conditions (e.g. Baur & Köngeter Reference Baur and Köngeter1999; Gurka et al. Reference Gurka, Liberzon, Hefetz, Rubinstein and Shavit1999; Koschatzky et al. Reference Koschatzky, Moore, Westerweel, Scarano and Boersma2011; Ghaemi et al. Reference Ghaemi, Ragni and Scarano2012; de Kat & van Oudheusden Reference de Kat and van Oudheusden2012; Ghaemi & Scarano Reference Ghaemi and Scarano2013). Different approaches for calculating pressure have been compared by Charonko et al. (Reference Charonko, King, Smith and Vlachos2010) and reviewed by van Oudheusden (Reference van Oudheusden2013). Comparisons based on synthetic data have shown that in regions located away from the planes where the Dirichlet boundary conditions are imposed, results obtained from both approaches are essentially identical.



