I. INTRODUCTION
ZnO is a promising material for optoelectronic applications due to its large exciton binding energy (60 meV), low refractive index (1.9), and stability under intense ultraviolet exposure. Although it is relatively simple to grow high-quality single crystal n-type ZnO, fabricating stable p-type material is proving to be difficult despite an intense research effort. Along with native defects such as oxygen vacancy (V O), zinc interstitial (Zni), and zinc vacancy (V Zn), hydrogen has been proposed to be an important source of n-type conductivity in ZnO.Reference Van de Walle1 First-principles investigations based on density functional theory have revealed that hydrogen in ZnO, unlike in other semiconductors, acts exclusively as a shallow donor impurity,Reference Van de Walle1 which has recently been confirmed by experiments.Reference Strzhemechny, Mosbacker, Look, Reynolds, Litton, Garces, Giles, Halliburton, Niki and Brillson2 Hydrogen can also have a pronounced effect on the optical and electronic properties of ZnO,Reference Strzhemechny, Mosbacker, Look, Reynolds, Litton, Garces, Giles, Halliburton, Niki and Brillson2–Reference Ip, Overberg, Heo, Norton, Pearton, Stutz, Kucheyev, Jagadish, Williams, Luo, Ren, Look and Zavada4 especially it has a very high diffusivity in ZnO and is a common impurity usually present during the processing of ZnO crystals.Reference Jagadish and Pearton5 Understanding the properties of hydrogen in ZnO is pivotal to lowering the background n-type conductivity levels and improving the possibility of producing p-type ZnO.
It has been reported that the near-band-edge (NBE) luminescence efficiency in ZnO is significantly enhanced by the incorporation of hydrogen,Reference Sekiguchi, Ohashi and Terada6, Reference Ohashi, Ishigaki, Okada, Sekiguchi, Sakaguchi and Haneda7 but there is little systematic data available on its effects on defect-related visible emissions. Two commonly observed defect-related emissions in ZnO are: (i) ubiquitous green luminescence that has been assigned to native defectsReference Janotti and Van de Walle8, Reference Ton-That, Phillips, Foley, Moody and Stampfl9 and (ii) yellow luminescence attributed to the presence of Al or Li impurities.Reference Nayak, Kimura, Nozaki, Ono and Uchida10 The aim of the present study is to evaluate the role of hydrogen incorporation in the defect-related and NBE emissions in ZnO. Cathodoluminescence (CL) in a scanning electron microscope (SEM) is a powerful technique used extensively to study structural defects and the optical properties of semiconductor materials and devices.Reference Yacobi and Holt11 The depth profile of a particular luminescence center can be obtained nondestructively by measuring CL spectra as a function of the electron penetration range. This CL method is conducted by changing the electron beam energy while adjusting the beam current to maintain the beam power and hence the electron-hole pair injection rate.Reference Davidson and Dimitriadis12 In this way, the in-depth distribution of luminescence centers in a specimen can be analyzed. In this work, we show that the green and yellow emissions exhibit different behaviors upon hydrogen incorporation and different dependencies on the photon generation depth. Understanding these variations is vital for a correct interpretation of luminescence data from ZnO.
II. EXPERIMENTAL
ZnO crystals used in this work were hydrothermally grown by the MTI Corporation. Samples (MTI Corp., Richmond, CA) were polished both sides, 0.5 mm thick, 1 cm × 1 cm square sections. The normally undoped a-plane crystal (resistivity 160 Ω·cm) was exposed to a hydrogen radio-frequency plasma of power 15 mW for 10 min at 200 °C. Under these conditions, the incorporation depth of hydrogen is expected to be >10 μm.Reference Ip, Overberg, Heo, Norton, Pearton, Stutz, Kucheyev, Jagadish, Williams, Luo, Ren, Look and Zavada4 No morphological changes due to the plasma treatment were detected by SEM observation. CL was performed at 80 K using a Quanta 200 SEM (FEI Corp., Hillsboro, OR) equipped with a liquid nitrogen cold stage and an Ocean Optics SD2000 (Dunedin, FL) Diode Array Spectrometer. CL measurements were performed by two methods: (i) changing the beam accelerating voltage with a constant beam power to probe the in-depth distribution of luminescence centers in the crystal and (ii) changing the electron beam current while maintaining the accelerating voltage to analyze excitation density dependencies of particular emissions. All collected data was corrected for the response of the system.
III. RESULTS AND DISCUSSION
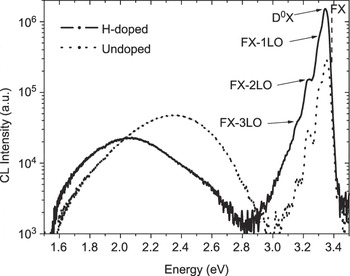
Figure 1 shows the CL spectra of the ZnO crystal before and after hydrogen incorporation. These spectra, collected from a 5 μm × 5 μm scan region at 80 K with the same resolution and the SEM operated at 20 kV and 1.3 nA, display similar spectral features in the NBE region for the undoped and H-doped crystals. The NBE CL consists of a donor bound exciton (D0X) emission overlapped with free exciton (FX) emission at 3.37 eV, along with FX replicas (FX-1LO, FX-2LO, and FX-3LO) separated by an equal energy space of the longitudinal optical-phonon energy E LO = 72 eV.Reference Phillips, Gelhausen and Goldys13, Reference Wang and Giles14 Upon hydrogen incorporation, the NBE intensity increases by almost an order of magnitude. The high energy side of the peak is enhanced only moderately due to the effect of optical self-absorption. Monochromatic CL images taken at 3.37 eV reveal uniform emission from the crystal surface, indicating a high degree of the uniformity of hydrogen incorporation.
Cathodoluminescence (CL) spectra obtained at 80 K from the ZnO crystal (electron beam energy = 20 keV, beam current = 1.3 nA) before and after hydrogen plasma treatment. The near-band-edge (NBE) intensity increases by a factor of 10 following hydrogen incorporation while the defect-related emission is quenched.

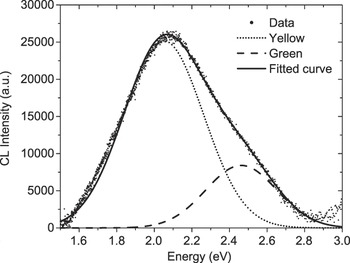
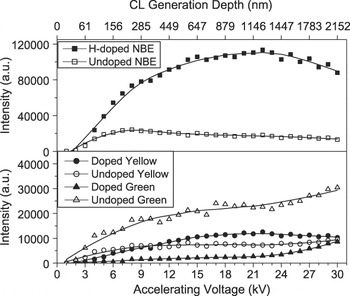
A broad defect-related visible band is observed in both undoped and H-doped crystals. While the peak position of the NBE was unchanged following the hydrogen incorporation, the defect band not only strongly red shifts but also has a significant reduction in intensity. This band can be fitted by two Gaussian components centered at 2.1 eV (yellow) and 2.5 eV (green) (Fig. 2), which have been recently attributed to radiative recombination involving lithium acceptorReference Nayak, Kimura, Nozaki, Ono and Uchida10, Reference Borseth, Svensson, Kuznetsov, Klason, Zhao and Willander15, Reference Sekiguchi, Miyashita, Obara, Shishido and Sakagami16 and centers involving zinc/oxygen vacancies,Reference Janotti and Van de Walle8, Reference Vanheusden, Warren, Seager, Tallant, Voigt and Gnade17 respectively. Hydrothermally grown ZnO, synthesized in a solution containing LiOH, is known to have Li-related defects, which are responsible for the yellow luminescence.Reference Borseth, Svensson, Kuznetsov, Klason, Zhao and Willander15 The observed red shift is due to variations in the relative intensities of the yellow and green emissions. These results are illustrated more fully in Fig. 3, which presents the depth-resolved CL results for these two components as well as for the NBE. This figure also contains a secondary x-axis for the CL generation depth corresponding to the distance over which 70% of the CL intensity is generated. These data were obtained from simulations of 5000 trajectories of electrons in ZnO using the Monte Carlo stimulation CASINO.Reference Drouin, Couture, Joly, Tastet, Aimez and Gauvin18 (In addition to the spatial spread of the injected electrons, the diffusion of carriers was also considered for the determination of the CL generation depth.) The green emission is dominant throughout the generation depth up to 1500 nm for the undoped sample but quenched considerably following hydrogen incorporation. The yellow defect emission is slightly enhanced at depths greater than about 300 nm. The reduction in the green intensity is fairly constant within in the depth range 300–2100 nm, indicating a uniform hydrogen concentration, in good agreement with depth profiling measurements.Reference Ip, Overberg, Heo, Norton, Pearton, Stutz, Kucheyev, Jagadish, Williams, Luo, Ren, Look and Zavada4
The broad defect-related visible band of H-doped ZnO following plasma treatment in Fig. 1 can be fitted with two Gaussian components centered at 2.1 eV (yellow) and 2.4 eV (green), which are related to Li impurity and native defects, respectively.

Integrated intensities of the NBE, yellow, and green luminescence as a function of electron beam energy obtained at 80 K. The beam current, I B, was adjusted to provide a constant beam power of 70 μW. Also shown is the luminescence generation depth in ZnO corresponding to 70% CL intensity obtained by Monte Carlo simulations.

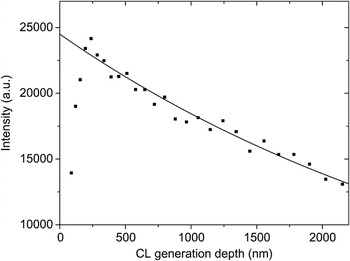
The decreases in the intensity of the NBE emission at depths greater than 250 nm for the undoped crystal and 1200 nm for the H-doped crystal are due to strong self-absorption of the emitted photons by ZnO. The NBE intensity is attenuated by exp(−α·d), where α is the absorption coefficient and d is the photon generation depth. Figure 4 represents the fit to the NBE intensity data of the undoped crystal with d being taken as the CL generation depth, yielding α = (2.8 ± 0.4) × 103 cm−1, which is in good agreement with the previously measured value for 3.3 eV photons by ultraviolet–visible absorption spectroscopy.Reference Nadarajah and Konenkamp19 It is worth noting that accurate determination of the absorption coefficient is not possible from depth-resolved CL since photons are generated up to the electron range. The weak luminescence in the near-surface region (<250 nm) is due to nonradiative recombination centers created by surface polishing.Reference Mass, Avella, Jimenez, Callahan, Grant, Rakes, Bliss and Wang20 These results show that the NBE emission is only detected close to the surface, whereas the green and yellow emissions can originate from much greater depths (micron scale) in the crystal because such photons are not absorbed.
For depths >250 nm, the NBE intensity of the untreated crystal can be fitted by an exponential function, which yields the absorption coefficient α = (2.8 ± 0.4) × 103 cm−1.

The considerable increase in the NBE intensity following hydrogen incorporation can be attributed to the introduction of an efficient radiative recombination pathway, which mainly arises from hydrogen shallow donors located at the bond-centered site (HBC).Reference Van de Walle1 This explanation is supported by Hall-effect measurements, which show the carrier density increases from 2.0 × 10¹⁴ to 1.7 × 1017 cm3 upon plasma treatment. The elimination of competitive radiative recombination channels as evidenced by the dramatic reduction of the green emission will also contribute to the increase in the NBE emission and yellow luminescence. It is worth noting that the treatment temperature 200 °C is not sufficient to introduce more defects in the crystal since the thermal energy is considerably smaller than the formation energies of intrinsic point defects in ZnO.Reference Janotti and Van de Walle8 Defect centers involving surface oxygen and bulk zinc vacancies are the most likely candidates for the green luminescence as they are theoretically predicted to have the lowest formation energy and should be the most abundant native defects.Reference Janotti and Van de Walle8, Reference Prades, Cirera, Morante and Comet21 However, the reduction of the green emission from the bulk of the crystal following hydrogen incorporation demonstrates that it cannot originate from surface oxygen vacancies. On the other hand, zinc vacancies are double acceptors and occur in the 2−charge state (V Zn2−). Hydrogen, known to act almost exclusively as positive charge state (H+),Reference Van de Walle1 would preferentially interact with V Zn2− rather than VO+ or VO++ centers. This interpretation is in agreement with first-principles calculations, which indicate the existence of a complex involving V Zn2− and two hydrogen atoms.Reference Lavrov, Weber, Borrnert, Van de Walle and Helbig22 This explanation is further supported by the stability of hydrogen in the ZnO crystal as evidenced by the fact that the CL spectrum of the hydrogen-doped ZnO crystal remains unchanged 6 weeks after plasma treatment.
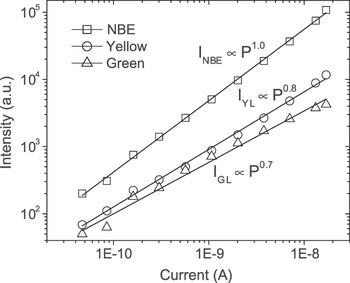
Figure 5 shows the variations of the NBE, yellow, and green intensities on the beam current over a scan area of a 5 μm × 5 μm. In this measurement, the accelerating voltage was fixed at 30 kV, while the beam current was varied from 50 pA to 20 nA. A power-law model (I CL ∝ I Bm), where I CL is the peak intensity and I B the beam current, is used to evaluate the excitation power dependence of the CL intensity. Power-law fits, shown by straight lines in the I CL versus I B log–log plots, reveal that the green and yellow intensities exhibit strongly sublinear behaviors, with I yellow ∝ I B0.8 and I green ∝ I B0.7. The dependence of the NBE on beam current is linear, I NBE ∝ I B. The strongly sublinear dependencies of the yellow and green emissions are not unexpected and characteristic of recombination channels involving deep levels. This sublinear behavior of CL spectra discussed here has been observed for other semiconductors and interpreted in terms of saturation kinetics.Reference Kucheyev, Toth, Phillips, Williams and Jagadish23 While the ratio of the NBE-to-defect emissions is frequently used to determine the quality of ZnO, this nonlinearity with electron beam density must be taken into account for a correct interpretation of CL data from ZnO.
Intensities of the NBE, green, and yellow emissions at 80 K as a function of electron beam current obtained with beam energy of 30 keV. Power-law fits by straight lines show variations with the beam current (I B): I NBE ∝ I BReference Van de Walle1, I GL ∝ I B0.7, I YL ∝ I B0.8. The power-law exponents indicate that the yellow and green emission peaks saturate with increasing I B, where as the NBE has a linear dependence consistent with an excitonic emission.

IV. CONCLUSION
In conclusion, depth-resolved CL spectra of ZnO crystals were investigated under different accelerating voltages and beam currents before and after hydrogen plasma treatment. The green and yellow intensities and its intensity ratio to the NBE vary with excitation depth for both undoped and H-doped ZnO specimens. From the comparison with the CL spectra before and after hydrogen incorporation, it is strongly suggested that the quenching of the green luminescence is due to the formation of nonradiative defect complexes involving zinc vacancies and hydrogen.
ACKNOWLEDGMENT
This work was supported by the Australian Research Council.