Introduction
Ground beetles (Carabidae: Coleoptera) are well known both taxonomically and ecologically (Lövei & Sunderland, Reference Lövei and Sunderland1996; Niemelä, Reference Niemelä, Halme and Haila1996) and have been widely used as bioindicators (Humphrey et al., Reference Humphrey, Hawes, Peace, Ferris-Kaan and Jukes1999; Magura et al., Reference Magura, Tóthmérész and Bordán2000; Ward & Ward, Reference Ward and Ward2001; Vanbergen et al., Reference Vanbergen, Woodcock, Watt and Niemela2005). They are distributed over broad geographic ranges and all major terrestrial habitats (Lövei & Sunderland, Reference Lövei and Sunderland1996); react sensitively to anthropogenic disturbance and environmental change (Thiele, Reference Thiele1977; Eyre & Ruston, Reference Eyre and Ruston1989); and, with most species being predominantly insectivorous predators, potentially contribute to pest control in agro-ecosystems (Kromp, Reference Kromp1999).
Studies investigating carabid diversity principally rely on pitfall trapping as the standard sampling method (Rainio & Niemelä, Reference Rainio and Niemelä2003). These traps are easy to operate (Greenslade & Greenslade, Reference Greenslade and Greenslade1971) and are regarded as a highly effective and cheap means to survey arthropods dwelling on the soil surface. They are, hence, seen as a powerful tool to gain standardized quantitative samples of ground arthropod assemblages, in general, and carabid beetles, in particular (Thiele, Reference Thiele1977; Southwood, Reference Southwood1978; Luff, Reference Luff and Eyre1996). In pitfall traps, the effective capture rates depend both on activity patterns and population densities of the species captured (Mitchell, Reference Mitchell1963; Greenslade, Reference Greenslade1964), so that pitfall trapping results do not necessarily reflect the prevailing density of species in a habitat. Furthermore, size, shape and material of pitfalls, and the liquid used in the collecting jars, as well as the type of cover, also affect the sampling results to some extend (Briggs, Reference Briggs1961; Luff, Reference Luff1975; Baars, Reference Baars1979; Pekár, Reference Pekár2002). These initial constraints, combined with habitat-related differences in the activity patterns of carabid species, render it somewhat difficult to use and compare pitfall trapping results of different studies investigating carabid species composition (Niemelä et al., Reference Niemelä, Halme and Haila1990; Spence & Niemelä, Reference Spence and Niemelä1994) and to evaluate their overall indicative value (Duelli, Reference Duelli1997; Duelli & Obrist, Reference Duelli and Obrist1998).
The trapping of insects at light sources is also a relatively cheap and robust sampling method used to record a wide range of primarily nocturnal arthropods. In the past, few studies reported on the use of light trap sampling to assess the diversity of ground beetles, although these beetles do arrive at such devices in significant numbers, as our results clearly indicate.
The aim of this study was to compare catches of carabid beetles derived from both pitfall trapping and light trapping, with regard to diversity and species composition, in order to evaluate how representative and effective both techniques are in the recording of species ensembles of carabids in the agricultural landscape. The central hypothesis is that pitfall traps, as the established method of carabid recording, are superior with regard to both the number of species caught and the diversity of samples, with light traps catching a mere sub-set of species recorded in pitfall traps, and with a shift in dominance structure in light trap samples as they only record nocturnal, phototaxis species.
Study sites and methodology
Study sites
The study was performed at the agricultural research station of the China Agricultural University at Quzhou County (36°20′N, 114°00′E). The county represents a typical agricultural area in the North China Plain. The natural vegetation has been almost entirely replaced by agricultural fields and orchards. According to the Handan Statistical Bureau (1998), cropland accounted for 75.5% of the total land cover in Quzhou in 1997, with a multi-cropping index of 1.62. Furthermore, the landscape is highly fragmented because fields are continually subdivided within families. In this setting, four treatments were selected for carabid sampling. These were fields under rotational cultivation of winter wheat and summer maize (WM), cotton fields (C), orchards (O) and woodlands (WD) in the vicinity of the research station. Wheat/maize rotation fields, cotton fields and orchards represent the most common planting systems in the area, accounting for 42, 21 and 17% of the total sowing area, respectively. Four (woodland: 3) replicate plots of each treatment were selected for carabid sampling. Each plot had a size of 20×20 m2. Plot centres were located at least 50 m apart to rule out a direct interference of light sampling on neighbouring plots.
Carabid sampling
Light trapping
A light tower positioned in the centre of each plot was used for the collection of the carabid beetles (refer to Axmacher & Fiedler (Reference Axmacher and Fiedler2004) for a more detailed description of the light towers used). Ground beetles sitting on the light tower were sampled using jars prepared with diethyl-ether. Sampling lasted from the beginning of May to early October 2005, starting six days before the new moon. In each month, the sampling was separate to two phases, five days before and after the last day of the corresponding lunar month to ensure that light trapping was not affected by lunar background illumination. Light towers were operated over a period of 3 h each night, with sampling starting just before sunset. Each night, three plots representing different treatments were sampled, with each plot being sampled once per phase and hence twice per month. This resulted in an overall of 30 samples per month, leading to a total of 180 light trap samples. All carabids caught were transferred into bottles prepared with 75% alcohol to preserve the specimens. Later, the beetles were mounted and determined to species level, where possible, following the nomenclature of Lindroth (Reference Lindroth1974).
Pitfall traps
Pitfall trapping was performed during the same two five-day periods when light trapping occurred each month. Although an influence of the two sampling devices could not completely be ruled out, this can be assumed to be consistent between plots, as light towers were operated for one night on each of the plots in each of the pitfall trapping intervals. On each plot, a total of eight pitfalls with a diameter of 8 cm and a height of 11.5 cm were placed at a distance of 4 m and 7 m from the plot centre along two N-S and E-W facing diagonal lines intersecting in the middle of the plot. Each pitfall was protected from rain by a simple aluminium roof positioned about 5 cm above the trap. Pitfall traps were partly filled with 75% alcohol to kill and preserve the catch (Southwood, Reference Southwood1978). For statistical analysis, all beetles from the eight pitfall traps of the same plot were later combined, so that the total number of samples in the analysis again reached 180.
Data analysis
As already indicated, results of virtually all sampling techniques used to record mobile organisms are not only governed by species richness and abundance patterns, but also reflect activity patterns and, in the case of active sampling devices, the specific power of attraction of the respective device employed. This must be taken into consideration for both sampling methods employed in this study, where, furthermore, activity levels are assumed to rely on numerous environmental factors, such as prevailing weather conditions during sampling, agricultural management and the condition of the respective micro-habitats where pitfall traps and the light towers were placed. This means that the direct number of individuals and species per sample gives only a very poor estimate of species diversity (Gotelli & Colwell, Reference Gotelli and Colwell2001). As a reaction of these restrictions, a number of specific analytical tools have been developed to standardize samples, hence allowing a direct comparison of alpha diversity between samples originating from different habitats and gained under varying weather conditions (Hayek & Buzas, Reference Hayek and Buzas1997). In this study, Hurlbert rarefaction (Hurlbert, Reference Hurlbert1971) was employed, which is a method standardizing the number of species in samples of a standardized sample size to account for the aforementioned differences and also, in the case of the light traps, for differences in the skills of the persons actively sampling. Rarefied species numbers were calculated using the software Species Diversity & Richness 3 (Henderson & Seaby, Reference Henderson and Seaby2002), with rarefied species numbers calculated for the largest overall common sample size.
In addition, differences in the composition of samples were compared using the chord-normalized expected species shared (CNESS) index of dissimilarity (Trueblood et al., Reference Trueblood, Gallagher and Gould1994), an index developed again to account for the above-mentioned problems related to the sampling of mobile organisms. The CNESS index was calculated with the help of the program COMPAH (Gallagher, Reference Gallagher1998). Dissimilarity matrices derived were then analyzed using nonlinear multidimensional scaling (NMDS) (Trueblood et al., Reference Trueblood, Gallagher and Gould1994) using Statistica (Statsoft, 2001) to highlight similarities between communities at different sites.
Results
Species composition
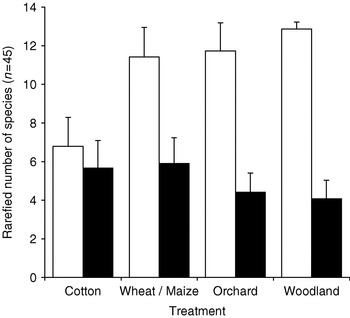
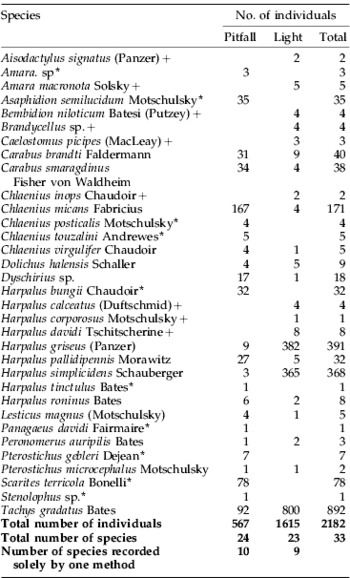
Overall, 2182 carabids belonging to 18 genera and 33 species were caught in the study area (table 1). Among these, 567 individuals, representing 24 species, were caught in pitfall traps, while the remaining 1615 individuals, representing 23 species, were caught at the light tower. Ten species were solely caught in pitfall traps, and a further nine species were restricted to light tower samples, while only 14 species were recorded by both methods. A clear tendency for higher numbers of individuals caught with light towers was consistent for all habitats investigated (fig. 1) although accumulated sampling time was only 144 h (woodland: 108 h) per habitat, as compared to approximately 76,800 h (woodland: 57,600 h) of accumulated pitfall trapping sampling time per habitat. The dominance structure of the carabid assemblages was also very different in relation to the method used. In pitfall traps, the most common species were Chlaenius micans Fabricius, Tachys gradatus Bates and Scarites terricola Bonelli, which accounted for 29.5, 16.2 and 13.8%, respectively, or a total of about 60% of the catch. At the light tower, T. gradatus again was one of the most dominant species, followed by Harpalus griseus (Panzer) and H. simplicidens Schauberger. These three species already accounted for 49.5, 23.7 and 22.6%, respectively, hence representing more than 95% of all individuals caught.
Rarefied number of carabid species for the largest common number of individuals n=45 generated from pitfall trap and light tower samples at the different habitats. Bars indicate standard error (1 SE). (□, Pitfall samples; ■, light tower samples.)

Individuals of the different carabid species trapped by pitfall traps and on the light towers throughout the sampling season in 2005 for all plots combined.

+ species caught solely on the light tower
* species caught solely by pitfall traps.
Alpha diversity
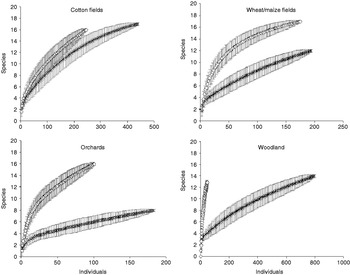
The largest common sample size for all habitats was 45. A comparison of rarefied species for this sample size (fig. 1) clearly shows that with the exception of cotton fields, the diversity of carabid assemblages collected with pitfall traps was significantly higher than the light trap samples. A comparison of the rarefaction curves gained by both methods for each of the habitats, allowing the interpretation of the increase of rarefied species numbers with increasing sample sizes, further elucidates the significantly higher diversity in carabid samples recorded by pitfall trapping for the maximum shared sample size for all habitats (fig. 2).
Comparison of rarefaction curves for carabid assemblages sampled via pitfall traps and light towers at the different habitats. Bars indicate standard error (1 SE). (◊, Pitfall trap; *, light tower.)

Species turnover
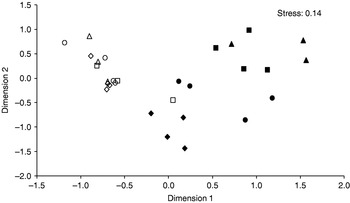
Nonlinear multidimensional scaling (NMDS) based on the CNESS index of dissimilarity for a minimum sample size parameter m=1 (fig. 3) showed that the plots for different agricultural treatments when sampled by pitfall traps were clustered in separate groups along the two dimensions. A slight overlap, nevertheless, occurred between samples from orchards and woodland.
Non-linear multi-dimensional scaling (NMDS) of the CNESS index of dissimilarity for a sample size parameter m=1 of the carabid assemblages recorded at different treatments and with different methods. LT, light tower; PF, pitfall trap. (◊, Cotton LT; □, orchard LT; △, woodland LT; ○, wheat/maize LT; ◆, cotton PF; ■, orchard PF; ▲, woodland PF; ●, wheat/maize PF.)

With exception of one orchard site, all plots sampled by light towers were grouped very closely together in comparison to the samples from the pitfall traps and could not be clearly distinguished according to the different treatments. Overall, the ordination, hence, indicates that the dominance pattern of carabid species in different plots was very similar when comparing light tower catches and much more heterogeneous in pitfall trap samples, and that changes in the composition of pitfall samples varied according to the different treatments, which does not occur in light tower catches.
Seasonal dynamics in carabid assemblages
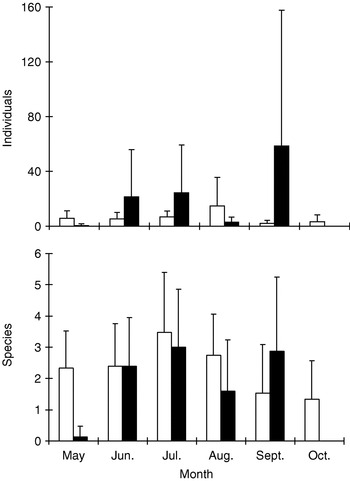
Individuals and species caught in pitfall traps and at light towers displayed markedly different seasonal dynamics (fig. 4). Seasonal variation in both species and individuals caught was greater in light tower catches. In the light tower samples, catches from June, July and September already accounted for 97% of all specimen caught. In these months, the number of individuals caught on the light towers greatly exceeded sample sizes from pitfall trapping; while in the remaining months, more individuals were encountered in the pitfall traps. With regard to species, light towers only attracted a greater number of species in September and an equal number in June; whereas, in all other months, more species were encountered in the samples from pitfall traps.
Monthly variation in the number of individuals and species caught with the two sampling methods. Bars indicate standard deviation. (□, Pitfall samples; ■, light tower samples.)

Discussion
Pitfall samples are assumed to generate a representative picture of activity patterns of the carabid community in the habitats sampled and, hence, provide a useful tool for detecting variations related to differences in environmental conditions (Gutiérrez et al., Reference Gutiérrez, Menéndez and Méndez2004; Lassau et al., Reference Lassau, Hochuli, Cassis and Reid2005). In addition, they are believed to present a suitable technique to obtain carabid species inventories (Duelli et al., Reference Duelli, Obrist and Schmatz1999; Bergthaler & Rėlys, Reference Bergthaler, Rėlys, Toft and Scharff2002). The great variation in dominant species at different treatments in the pitfall samples depicted in the ordination underlines the usefulness of this method to indicate changes in habitat conditions, whereas light tower catches were dominated by the same very restricted set of species at all habitats. The rarefaction curves, furthermore, demonstrated that pitfall traps always sampled more diverse subsets of the carabid communities than light tower samples. This strongly indicates that pitfall traps provide a much more efficient way to record and compare diversity levels of carabids in the agrarian landscape than catches at light sources. Nevertheless, one severe disadvantage of pitfall traps also became apparent, namely their extremely low capture rates, in our case highlighted by an average of only 0.031 beetles caught per trap per day in the woodland habitats. This potentially results in limitations in the statistical analysis, which has to be taken into account in the design of carabid studies using pitfall traps. Seasonal changes in carabid beetle samples indicated more stable sampling results in pitfall traps as compared to light catches. The obvious disadvantages of light tower samples may be explained via either a strong effect of variations in weather conditions or a high variation in flight activity, especially in autumn when species search for over-wintering sites. The latter seems the more probable explanation, as both temperature and humidity showed no significant correlations with either the number of individuals (Spearman Rank Correlation: R=−0.19, p=0.13 (temperature); R=0.01, p=0.91 (humidity)) or the number of species (R=−0.06, p=0.62 (temperature); R=0.08, p=0.52 (humidity)) caught at the light tower. Another potential effect was the radius around the light source from which carabids were attracted. This diameter could be hypothesized to have increased with decreasing density in the vegetation. Nevertheless, the highest sampling success was recorded from woodlands rather than from cotton or wheat fields where the vegetation was much lower and the light was more visible from greater distances. This supports the belief that light towers only effectively attract arthropods from a short radius (Baker & Sadovy, Reference Baker and Sadovy1978; Muirhead-Thompson, Reference Muirhead-Thomson1991), particularly when weak light sources are used as in the present study. While this renders the method as potentially very suitable to detect differences in species composition of neighbouring sites, the similarity in species composition observed at light towers at a variety of habitats at Quzhou was remarkably high, contradicting a high sensitivity. Nevertheless, the similarity in sample composition was only observed for the three dominant species on the tower, which must be assumed to have very high flight activities, and managed to dominate across all habitat boundaries due to their extremely high densities. These three species were two members of the genus Harpalus, representing specialized seed-feeders as potential pest species and Tachys gradatus, which is very small. Obviously, these three were well adapted to inhabit the crop monocultures surrounding the study area and had great dispersal ability. Hence, the light tower proved to be extremely effective in monitoring the occurrence of potential pest species exhibiting both extremely high population numbers and dispersal activity. One main drawback of light tower sampling was seen in the missing standardization in the sampling effort, as sampling was performed manually; and, hence, sampling success depended not least on the skills of the person sampling the respective tower. While the same persons sampled the same sites throughout our experiment, the statistical methods employed in the analysis, rarefaction and the CNESS index, will widely cater for sampler-specific differences. However, for future sampling, it seems advisable to use automatic light traps rather than manual sampling, which will also allow sampling periods to be extended over whole nights. Nevertheless, even when considering the shortcomings in standardization of light tower sampling and the strong bias of this method towards the most actively dispersing species, our results strongly suggest that the method is extremely helpful, if not essential, for carabid species inventories. As the results showed, although pitfall traps, in general, caught more diverse carabid assemblages, they seriously failed in giving a complete inventory of carabid assemblages of the study area. Nine species, accounting for roughly a quarter of all species recorded, were solely caught at the light towers, which also led to much higher overall numbers of individuals.
Also, in agreement with Duelli & Obrist (Reference Duelli and Obrist2003), the choosing of a suitable sampling method for carabids must strongly depend on the goals and motivations of the study to be conducted. The results presented here indicate that if the recording of distribution patterns of all carabid species were the motivation, including rare species potentially of great conservation interest, complete inventories are needed and, hence, a combination of both methods seems most advisable. If monitoring of potential pest organisms with a high density and dispersal ability is the main focus, light tower sampling seems to be far superior. The main strengths of pitfall trapping can, on the other hand, be seen in the high effectiveness of the method to draw standardized samples of ground-dwelling carabids, and in being a very effective method of detecting differences in the species composition at different sites due to changes in habitat conditions, although these differences should be considered carefully because they are both affected by carabid activity and density. Therefore, pitfalls are clearly superior in ecological studies and when carabids are to be used as biological indicators for changes in habitat conditions.
Conclusion
Both methods of carabid sampling investigated in this study can be seen as useful tools for the recording and monitoring of ground beetles, but displayed greatly different strengths. Pitfalls, although known for their shortcomings (Briggs, Reference Briggs1961; Mitchell, Reference Mitchell1963; Greenslade, Reference Greenslade1964; Luff, Reference Luff1975; Baars, Reference Baars1979; Niemelä et al., Reference Niemelä, Halme and Haila1990; Spence & Niemelä, Reference Spence and Niemelä1994), proved to be highly effective sampling devices in evaluating differences in the diversity and composition of carabid assemblages and, hence, were useful for ground beetle-based indication and detection of habitat changes. Light towers, on the other hand, enabled the sampling of very high numbers of species with high dispersal ability, a group including potential pest species; therefore, light trapping seems superior in pest species monitoring. Finally, as less than half of the species recorded at Quzhou occurred in samples from both methods and more than a quarter were only present in pitfall samples and light tower samples, respectively, a combination of these two methods is regarded as highly recommendable when species inventories are to be conducted, e.g. to evaluate the distribution patterns of rare species to develop effective conservation measures.
Acknowledgements
The authors are greatly indebted to the National Natural Science Foundation of China (30570318), national project (2øø6BAJ1øBø5) and the First Sino-German International Research Training Group (GRK1070), Sustainable Resource Use in North China jointly supported by the German Research Council (DFG) and the Chinese Ministry of Education (985). We are also very grateful to Dr Liang Hongbin from the Institute of Zoology at the China Academy of Sciences for his great help with the determination of carabid specimens. We also would like to thank two anonymous reviewers and the editor for their valuable comments and suggestions, which were of great help in improving the paper.