Introduction
Expansive soils are key research objects in civil engineering and geology because of their unique microstructures and mechanical properties. The microscopic characteristics of expansive soils, such as their mineral composition and pore structure, directly affect their expansiveness, permeability, and mechanical strength (Zheng et al., Reference Zheng, Zaoui and Shahrour2011; Yotsuji et al., Reference Yotsuji, Tachi, Sakuma and Kawamura2021). Among these, the mechanical properties of clay minerals exhibit a strong sensitivity to moisture content (Zhang et al., Reference Zhang, Xie, Hu, Shao and Gatmiri2012; Zheng and Zaoui, Reference Zheng and Zaoui2018). The micromechanical behavior of clay particles is governed not only by the degree of interlayer hydration (Katti et al., Reference Katti, Schmidt, Ghosh and Katti2007; Ebrahimi et al., Reference Ebrahimi, Pellenq and Whittle2012), but is even more sensitive to variations in charge distribution arising from the species of hydrated exchange cations. Although the properties of expansive soils have garnered significant attention in civil engineering, research on the relationship between their microstructure and macroscopic mechanical behavior remains insufficient.
Expansive soil contains mainly montmorillonite (Mnt), illite, kaolinite, quartz, and feldspar, with minor mica. The Mnt controls the volume changes in the soil. Its superimposed layers are held by exchangeable cations and weak van der Waals forces. This allows Mnt to swell markedly when wet and shrink when dry. Illite adsorbs almost no water because its interlayer K+ ions bind tightly. Kaolinite has a 1:1 layer structure with strong hydrogen bonds that block water entry. Mica has platy layers but contributes little to swelling. Quartz and feldspar are rigid framework silicates with stable volumes and negligible swelling effects. The stress–strain response of Mnt depends on its crystal structure and hydration state. Key structural features include interlayer spacing, coordination environment, and the hydrogen bond network. Quantifying the mechanical behavior of Mnt accurately under various hydration levels is, therefore, essential.
Mnt exhibits a large cation exchange capacity and significant hydration ability, and its crystal structure is influenced by factors such as interlayer hydration and the type and distribution of interlayer cations (Boulet et al., Reference Boulet, Greenwell, Stackhouse and Coveney2006; Li et al., Reference Li, Nair, Kadoura, Yang and Sun2019; Yang et al., Reference Yang, Nair and Sun2019b). These factors determine directly the expansiveness and mechanical properties of the expansive soils. The swelling behavior of clay minerals occurs in two stages: crystalline expansion and osmotic expansion (Norrish, Reference Norrish1954; Fink and Thomas, Reference Fink and Thomas1964; Saiyouri et al., Reference Saiyouri, Tessier and Hicher2004). In the crystalline expansion stage, the amount of water adsorbed between the mineral layers increases gradually, driven by the hydration forces of exchangeable cations and negatively charged surfaces, resulting in the formation of one to three hydration layers and an increase in the layer spacing from 9 Å to ~19 Å. When the interlayer spacing of clay particles is larger, osmotic expansion is driven by electrical double layer forces, potentially increasing the volume of clay particles by ~20 times (Norrish, Reference Norrish1954). However, owing to the complex and diverse microstructure of expansive soil, it is difficult to characterize accurately their microscopic features and internal mechanisms using traditional macroscopic testing methods. Therefore, an in-depth study of the crystal structure of Mnt under hydration conditions and its impact on the mechanical properties is crucial for uncovering the macroscopic engineering characteristics of expansive soils and understanding their behavior under various environmental conditions.
With the advancement of computer simulation technology, molecular dynamics (MD) simulations have been used widely as a powerful numerical analysis tool in the study of soil microscopic behavior (Manevitch and Rutledge, Reference Manevitch and Rutledge2004; Hantal et al., Reference Hantal, Brochard, Laubie, Ebrahimi, Pellenq, Ulm and Coasne2014; Han et al., Reference Han, Yang and He2019). Compared with the limitations of traditional experimental methods, MD can simulate processes such as mineral hydration, dehydration, and ion exchange at the atomic scale (Yang et al., Reference Yang, He, Lu and Gong2019a; Liu et al., Reference Liu, Zhang, Jiang, Li, Dai and Jia2021), thereby revealing the impact of microstructural changes on the macroscopic properties of clay minerals (Xu et al., Reference Xu, Niu, Pan, Zhao, Wei, Li, Tan, Chen, Liu and Wu2021; Mao et al., Reference Mao, Huang, Luo and Zhang2021). For instance, MD can simulate the interactions between parallel Mnt clay layers (Whitley and Smith, Reference Whitley and Smith2004; Smith et al., Reference Smith, Wang, Chaturvedi and Whitley2006; Ebrahimi et al., Reference Ebrahimi, Whittle and Pellenq2014; Sun et al., Reference Sun, Hirvi, Schatz, Kasa and Pakkanen2015; Feng et al., Reference Feng, Al-Zaoari and Chen2024), thereby providing deeper insights into their mechanical behavior. The MD simulation method provides a more convenient and efficient approach for calculating the nanomechanical properties and nanostructured strength of Mnt (Hou et al., Reference Hou, Zhang, Pan, Zhang and Zhang2020; Underwood and Bourg, Reference Underwood and Bourg2020). It is possible to simulate extreme temperature and pressure conditions that are difficult to achieve in experiments. This is particularly beneficial for exploring the mechanical structural characteristics of expansive soils under extreme conditions.
Recent studies have found that hydration not only affects the interlayer spacing of, but also exerts a profound influence on, its macroscopic mechanical properties by altering its crystal structure (Li et al., Reference Li, Li, Bai, Han and Lu2023; Yang et al., Reference Yang, Nair and Sun2019b). The stress–strain response of rock-forming minerals was first explored through MD simulations by Seo et al. (Reference Seo, Ichikawa and Kawamura1999). Schmidt et al. (Reference Schmidt, Katti, Ghosh and Katti2005) explored the evolution of the interlayer mechanical responses of Na-Mnt with increasing hydration. Katti et al. (Reference Katti, Schmidt, Ghosh and Katti2007) used tensile MD simulations to study the mechanical responses of dehydrated and hydrated Mnt interlayers. Zheng and Zaoui (Reference Zheng and Zaoui2018) investigated the mechanical properties of Na-Mnt at different moisture contents and observed a hysteresis phenomenon in its elastic constants during swelling and shrinkage. Additionally, Wei et al. (Reference Wei, Zhang, Zheng, Diao, Zhuang and Yin2021) investigated the effects of the normal load and sliding velocity on the friction behavior of hydrated Mnt and validated their findings against other experimental and simulation results. Zhu et al. (Reference Zhu, Shen, Shao and He2021) discovered that the mechanical behavior of Mnt crystals exhibits significant asymmetry between compression and tension. In addition, there is an important dependence on the average stress. Li et al. (Reference Li, Li, Bai, Han and Lu2023) used MD simulations to study the structural evolution and mechanical behavior of different hydrated Mnt under compressive strain and found that the ultimate compressive strength in the Z-direction was greater than that in the X- and Y-directions. Yang et al. (Reference Yang, Nair and Sun2019b) investigated the effects of different cations on the expansion and mechanical properties of Mnt. In comparison, there were significant differences in the expansiveness and mechanical properties of Na-Mnt and Ca-montmorillonite (Ca-Mnt). Ca-Mnt typically exhibits a greater hydration capacity and greater expansion potential, making it more adaptable, whereas Na-Mnt is relatively stable and its expansiveness depends primarily on its exchangeable cations (Yotsuji et al., Reference Yotsuji, Tachi, Sakuma and Kawamura2021; Zhao et al., Reference Zhao, Cui, Jiang, Awadalseed, Guo, Yang and Kang2023; Wang et al., Reference Wang, Myshkin, Bespala, Poberezhnikov, Baraban, Shukshina and Semenov2023; Li et al., Reference Li, Li, Gui, Zhan, Gu, Yu and Rowe2024). The strong hydration layers formed during the hydration of Ca-Mnt enhance its compressive strength and toughness, improving its performance in civil engineering applications.
Although numerous studies have explored the relationship between the microstructural expansion characteristics and mechanical properties of Mnt using MD simulations, there remains a lack of comprehensive understanding of the micromechanical properties of Ca-Mnt under different hydration states. In the context of studying mechanical properties through MD simulations in particular, the stresses at the micro-level are of the order of GPa, whereas the stresses in macro-scale soils are only in the MPa range (Ebrahimi et al., Reference Ebrahimi, Pellenq and Whittle2012; Zhang et al., Reference Zhang, Xie, Hu, Shao and Gatmiri2012). This difference in mechanical properties across scales is related closely to the hierarchical structure of the soil. The extensive presence of macropores and micropores in soils can lead to significant reductions in the mechanical properties obtained from micro-simulations when assessed at the macro-scale, making it difficult to validate the MD simulation results through macro-experiments.
Addressing the unresolved mechanism for how microstructural evolution affects the stress–strain response of Ca-Mnt under varying hydration states, the present study, through multi-scale MD modeling, aimed to investigate systematically the influence of degree of hydration on the interlayer structural reorganization, uniaxial stress–strain response characteristics, and equivalent damping ratio of Ca-Mnt, with particular emphasis on revealing the structure–property relationships between microstructural parameters and macroscopic energy dissipation behaviors. A further objective was to validate the engineering applicability of molecular simulation methods in predicting the mechanical properties of Mnt by integrating experimental data from resonant column (RC) tests and dynamic mechanical analysis (DMA), with the goal of providing theoretical foundations for cross-scale prediction of cohesive soil dynamics under complex environmental conditions.
Materials and methods
The present study used Ca-Mnt primarily as a case example for MD simulations. The focus was on analyzing the evolution of the crystal structure and stress–strain response of Ca-Mnt at varying degrees of hydration.
Model building
The MD simulations were conducted using Materials Studio 2019 software to explore the microscopic mechanisms of hydration performance and changes in the mechanical properties of Ca-Mnt. The Mnt unit-cell structure was obtained from the American Mineralogist Crystal Database (https://www.rruff.net/), with the molecular formula: Ca0.375[Si7.75 Al0.25][Al3.5Mg0.5]O20(OH)4 (Viani et al., Reference Viani, Gualtieri and Artioli2002). The initial three-dimensional (3D) model of the single unit cell features lattice constants of α=β=γ=90°, a≈5.18 Å, b≈8.98 Å, c≈15.0 Å, where the c-value is variable, influenced by the number of water molecules and the types of exchangeable cations in the interlayers. Lattice substitutions were performed in accordance with the lattice substitution rules of the Mnt structure, ensuring that neighboring atoms in either the octahedral or tetrahedral sheets were not substituted simultaneously. In the model, for every 32 Si4+, one is replaced by Al3+, and for every 8 Al3+, one is replaced by Mg2+, resulting in a layer charge of –0.75 e per unit cell balanced by interlayer Ca2+ ions.
For the Mnt supercell structure with dimensions 4a×2b×1c, hydration models of Ca-Mnt were constructed using the Adsorption Locator module by incorporating 98, 108, 117, 127, 137, and 147 water molecules, corresponding to water contents of 30% (300 mgwater per gclay), 33% (330 mgwater per gclay), 36% (360 mgwater per gclay), 39% (390 mgwater per gclay), 42% (420 mgwater per gclay), and 45% (450 mgwater per gclay), respectively, in the simulation system. To ensure the consistency of the simulation conditions, the same dry density was set for different hydrated Ca-Mnt.
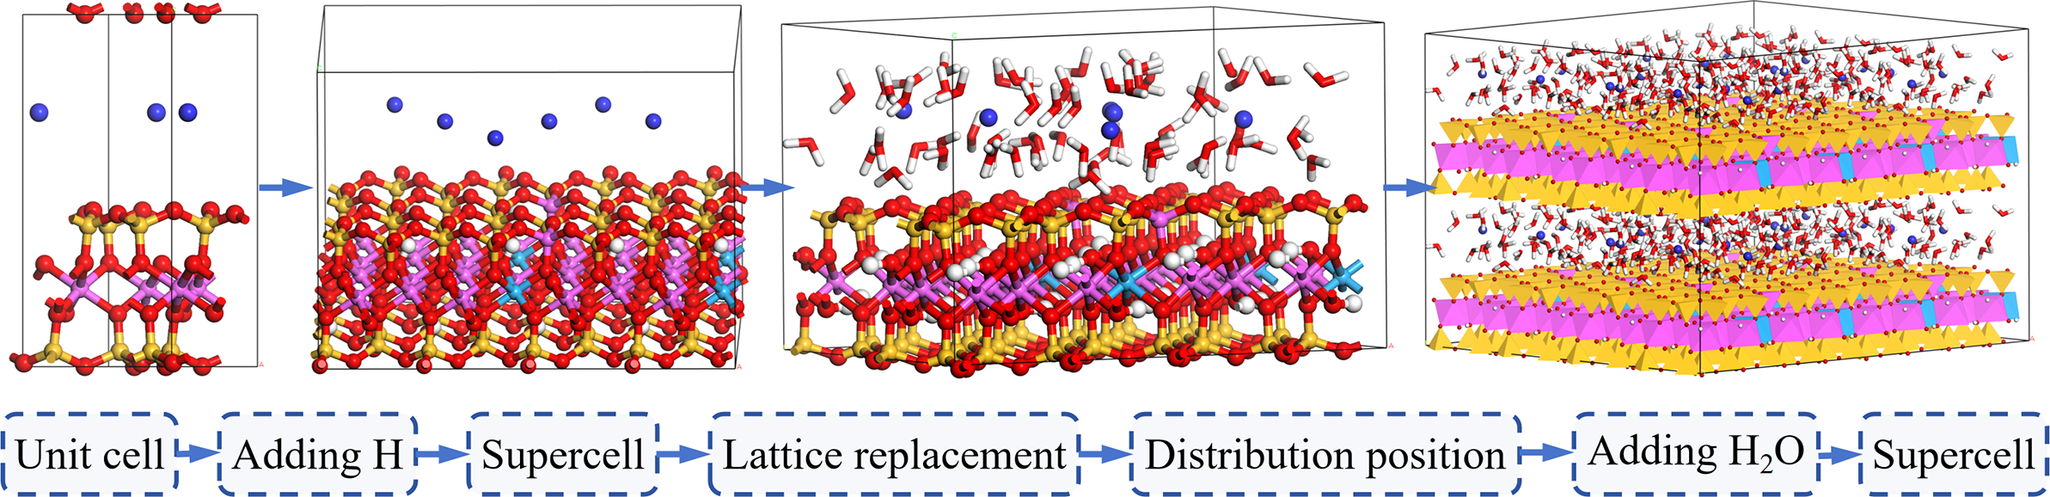
Finally, by introducing hydrogen bonds sequentially, expanding the unit cell, performing lattice substitutions, assigning force fields, adding water molecules, and further cell expansion (Fig. 1), an 8a×4b×2c hydrated Ca-Mnt supercell was constructed for subsequent analyses of hydration-induced swelling and mechanical property simulations.
Modeling the process of the hydrated Ca-Mnt supercell.

Simulation parameters
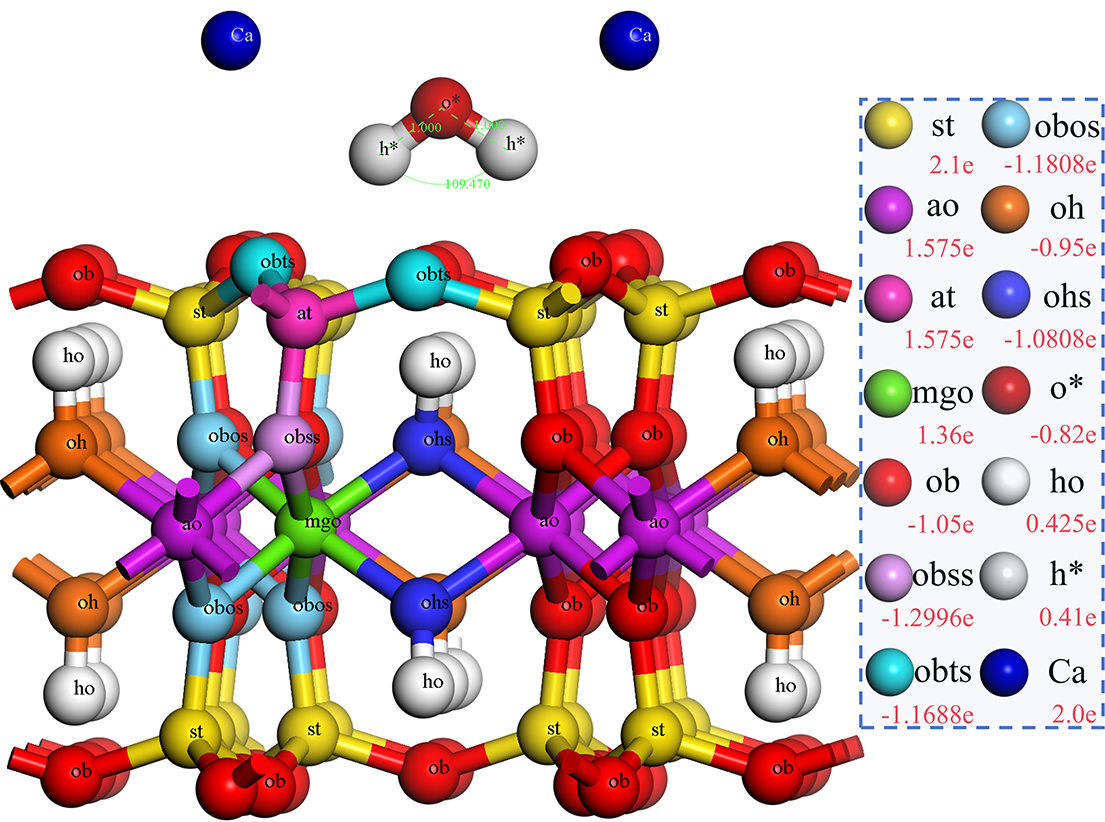
To mitigate the influence of surface effects, 3D periodic boundary conditions were applied to the model. The simulations were conducted using the Forcite module, with the ClayFF force field (Cygan, Reference Cygan2001; Cygan et al., Reference Cygan, Liang and Kalinichev2004). The ClayFF force field was designed specifically for hydrated minerals and clay mineral systems, enabling accurate simulations of interactions between mineral interfaces and aqueous solutions. By integrating the structural and spectral data of simple hydrated compounds, the atomic interaction potentials were parameterized (Hantal et al., Reference Hantal, Brochard, Laubie, Ebrahimi, Pellenq, Ulm and Coasne2014). The simulations utilized a Flexible Simple Point Charge (SPC) water model to describe the interactions between water molecules, hydroxyl groups, and oxygen–oxygen interactions (Berendsen et al., Reference Berendsen, Grigera and Straatsma1987). The detailed force field parameter setting and Mnt force field distribution are shown in Tables S1–S3 (Supplementary material) and Fig. 2.
Force-field parameters of ClayFF in the hydrated Ca-Mnt supercell (Cygan et al., Reference Cygan, Liang and Kalinichev2004).

The hydrated Ca-Mnt supercell model consists of a single mineral phase (Ca-Mnt) and water molecules. Energy minimization and geometric structure optimization were conducted using the Energy and Optimize Geometry modules in Forcite (Biova Materials Studio: Forcite – https://www.gga.asia/upload/pdf/478/forcite_20170927140508.pdf). The optimization employed the Smart energy minimization algorithm with the following parameters: an energy difference tolerance of 0.0001 kcal mol–1, a root mean square (RMS) force of 0.005 kcal mol–1 Å–1, an RMS stress of 0.005 GPa, and an RMS displacement of 0.00005 Å. Coulombic interactions were calculated using the Ewald summation method, van der Waals forces were summed using the atom-based method, and the cut-off radius for interactions was set to 10.5 Å. The maximum number of iterations was 50,000.
The simulation first adopted the NPT ensemble for 100 ps to stabilize the system volume, followed by the NVT ensemble for another 100 ps. The temperature throughout the simulation was maintained at 298 K using the Nosé-Hoover-Langevin (NHL) thermostat, known for its excellent temperature stability. The external pressure was set at 1 atm, with the Souza-Martins pressure control method applied to allow anisotropic pressure adjustments, facilitating rapid system equilibration and cell dimension adjustments. To further optimize the system, annealing was performed within a temperature range of 298–378 K. Five cycles were conducted, with temperature increments of 5 K per step and 100 ps of dynamic equilibration at each step, to determine the most stable structure.
The final production run involved a 500 ps MD simulation for data collection and output, with a time step of 0.5 fs. The energy variation results of Forcite geometric optimization and energy components (NVT) from Forcite molecular mechanics ensemble (Fig. S1, Supplementary material) confirmed that the system reached a stable state. Using the Adsorption Locator module, water molecules were adsorbed in varying quantities to investigate the hydration expansion behavior of Mnt. Additional analyses were performed using Perl scripts embedded/implemented through the Forcite module in Biovia Materials Studio, including hydrogen-bond calculations, radial distribution function (RDF) analysis, interfacial energy variations, and uniaxial compression stress–strain relationship analysis.
Experimental materials and methods
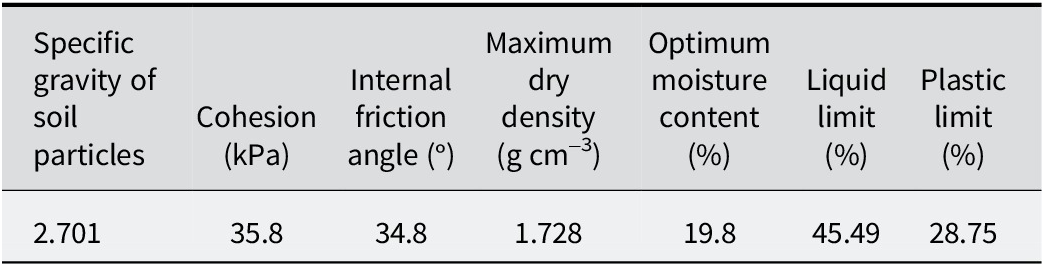
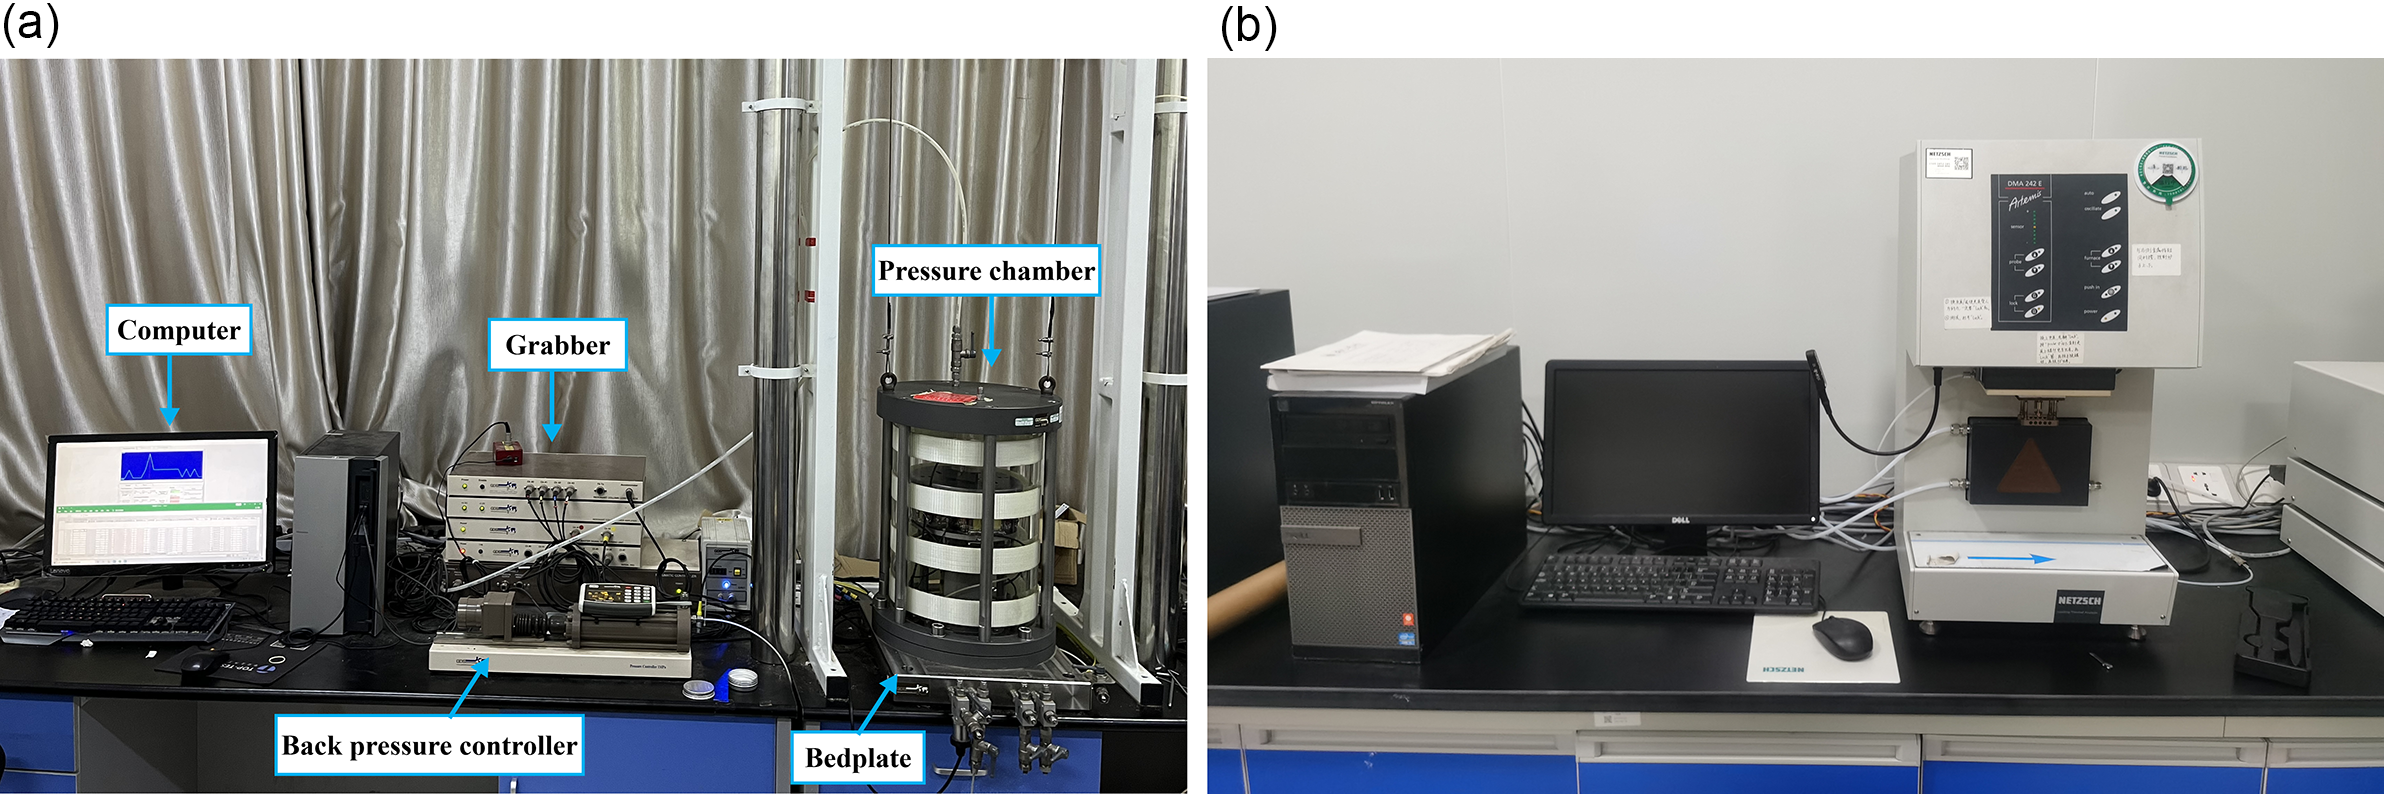
The damping characteristics of expansive soil were studied systematically using conventional resonant column tests and dynamic mechanical analysis (DMA). Key data, such as the damping ratio variation curves, were obtained. The physical and mechanical parameters of soil foundation are detailed in Table 1. The resonant column test was conducted using the GDSRCA Resonant Column Testing System developed by GDS Instruments in the UK (Fig. 3a). Based on the principle of resonance, cylindrical specimens were subjected to excitation, and the excitation frequency was adjusted to achieve resonance. Parameters such as dynamic elastic modulus and damping ratio were then calculated accordingly.
Basic physical parameters of expansive soil

(a) Resonance column test system; (b) dynamic mechanical analysis test system.

Dynamic mechanical analysis was performed using the DMA242E Dynamic Mechanical Analyzer manufactured by NETZSCH (Fig. 3b), Germany. The three-point bending mode was applied to carry out amplitude/strain scanning of expansive soil at room temperature.
Results and discussion
Hydration expansion analysis
Hydrogen bonds
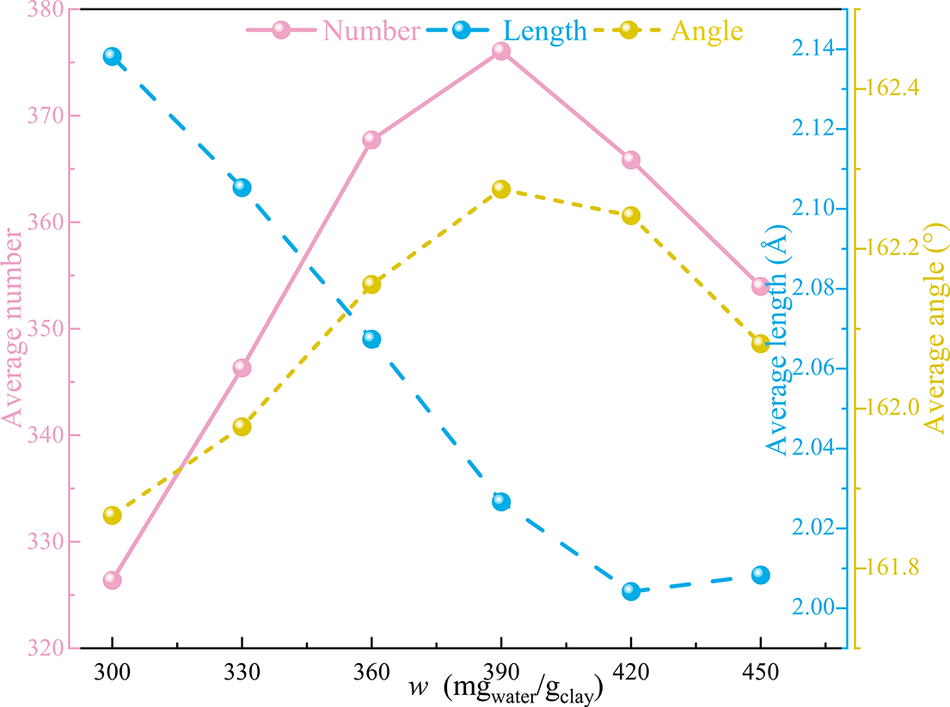
The definition of hydrogen bonds (Kumar, Reference Kumar, Schmidt and Skinner2007) establishes that the maximum donor–acceptor distance is 3.1 Å, and that the donor–H-acceptor angle is >150° or the acceptor–donor-H angle is <30°. Shorter hydrogen bond lengths indicate stronger interactions and greater bond energies. Hydrogen bonding analysis employed the Hydrogen Bond Analysis tool in Forcite (Biova Materials Studio). Custom Perl scripts extracted dynamically atomic coordinates from trajectory files, utilizing a KD-tree algorithm to optimize neighbor search, enabling rapid identification of triplets per frame. Outputs from the scripts are time-resolved bond counts, average lengths, and angular distribution matrices. By performing hydrogen bonding statistics on the kinetic trajectory files of Ca-Mnt with different hydration levels, the curves of the average number of hydrogen bonds, the average bond length, and the average bond angle at the interface between Ca-Mnt and water molecules with the degree of hydration were analyzed and obtained (Fig. 4).
Variation curves of hydrogen-bonding parameters at the water–Mnt interfaces in various degrees of hydration of Ca-Mnt.

The variations in hydrogen bond parameters at the water–Mnt interface in the hydrated Ca-Mnt system revealed the unit-cell structural adjustment process of interlayer interactions during hydration. As the water content increased, the average number of hydrogen bonds at the water–Mnt interface increased initially and then decreased, consistent with the trend observed in the average bond angle. Meanwhile, the average bond length exhibited a decreasing then increasing trend, reducing from 2.14 to 2.00 Å before increasing slightly to 2.01 Å, with the turning point occurring at a hydration level of 420 mgwater per gclay. This indicated that the hydrogen bond energy first strengthened and then weakened.
With increasing water content, the H2O–Mnt interfacial interactions evolved in discrete stages, encompassing both water–Mnt binding and water–water association. The intrinsic hydrogen bond network within the montmorillonite framework remained essentially unchanged; the net increase occurred in hydrogen bonds among water molecules and at the H₂O–Mnt interface. During the initial swelling of Ca-Mnt, water molecules preferentially formed hydrogen bonds with bridging oxygen atoms on the clay surface, driving a steady increase in total hydrogen bond count. As hydration proceeded, available bridging oxygen sites became fully occupied and interfacial hydrogen bond coordination saturated. Additional water molecules then linked to one another via hydrogen bonds, generating water-cluster networks within the galleries. Once a critical water content was reached, water–water hydrogen bonding dominated, the number of effective Ca-Mnt–water hydrogen bonds reduced, and the average interfacial hydrogen bond count began to decline.
Crystal structure
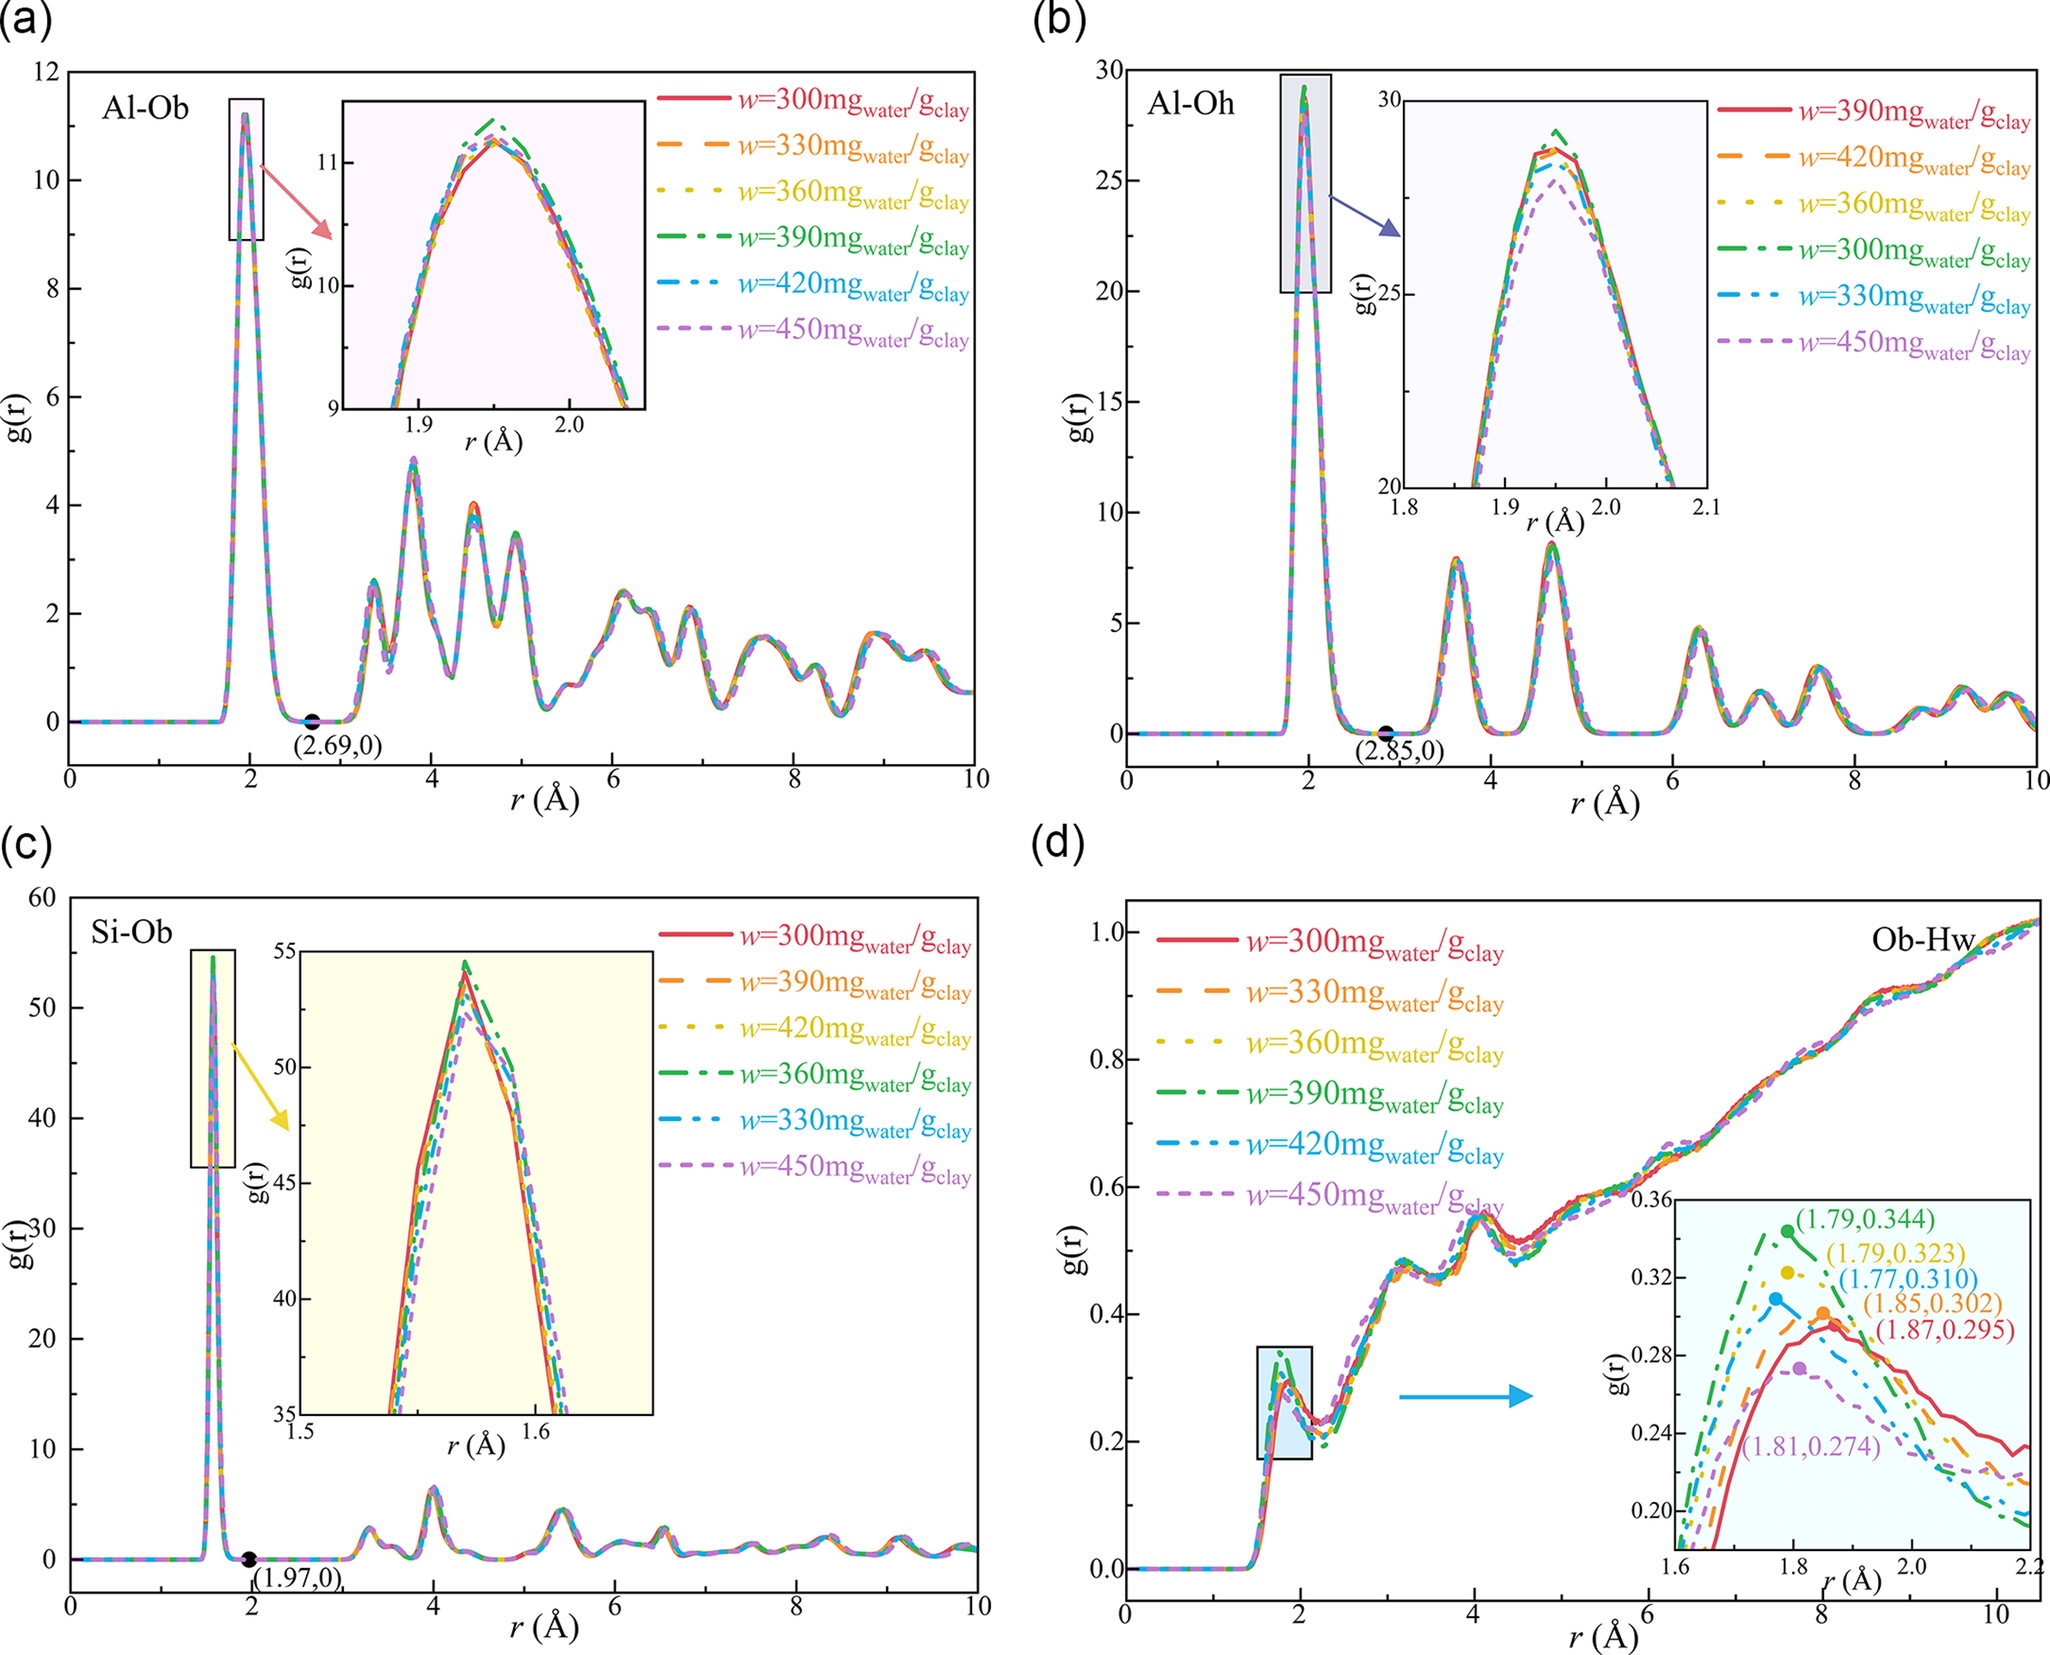
In hydrated Ca-Mnt systems, the Radial Distribution Function (RDF) is a crucial analytical tool used to describe the spatial distribution relationships between different atoms or molecules. The RDF g(r) quantifies the local structural order by measuring the probability density of atomic pairs at distance r (Graczyk and Moss, Reference Graczyk and Moss1969). g(r) is the ratio of the number density of atoms in the calculated group at each spherical position to its average density, which describes how the density varies with the distance from the reference particle. Yang et al. (Reference Yang, Nair and Sun2019b) proposed an atomic pair fracture hypothesis based on the RDF curves. To investigate the interfacial properties of hydrated Ca-Mnt further, the RDF curves for four primary atomic coordination pairs were calculated: Al-Ob, Al-Oh, Si-Ob, and Ob-Hw (Fig. 5). Among them, the different pairing modes of atoms were distinguished by force field distribution. The Al-Ob and Al-Oh coordination pairs primarily form Al-O octahedra, whereas Si-Ob coordination pairs predominantly form Si-O tetrahedra. The Ob-Hw coordination pair represents non-bonding interactions between the hydrogen in water molecules and oxygen on the Ca-Mnt surface.
(a) RDF curves of Al-Ob atomic coordination pairs; (b) RDF curves of Al-Oh atomic coordination pairs; (c) RDF curves of Si-Ob atomic coordination pairs; (d) RDF curves of Ob-Hw atomic coordination pairs.

The analysis of the RDF curves revealed that in hydrated Ca-Mnt, the main peak positions for Al-Ob, Al-Oh, and Si-Ob remained stable, with the first minima occurring at 2.69, 2.85, and 1.97 Å, respectively. This indicated that there are differences in the main peak positions of the various atomic pairs in the order of Al-Oh>Al-Ob>Si-Ob (Wei et al., Reference Wei, Zheng, Xiong, Zhou, Al-Zaoari and Zaoui2022). The main peak positions of the Al-Ob, Al-Oh, and Si-Ob coordination pairs remained relatively stable throughout hydration, suggesting that the introduction of water molecules did not alter significantly the structures of the Al-O octahedra and Si-O tetrahedra within Ca-Mnt. Notably, the peak of the Si-Ob coordination pair was sharp and intense, demonstrating the high stability of the silicon-oxygen tetrahedral structure.
The first peak of the Ob-Hw coordination pair appeared between 1.7 and 2.0 Å, indicating significant non-bonding interactions between water molecules and the bridging oxygen atoms on the clay surface through hydrogen bonding, which aligns with typical hydrogen bond distances (Kumar, Reference Kumar, Schmidt and Skinner2007). The shape of the RDF curves revealed that as hydration increased, the position of the first peak of Ob-Hw coordination pair first advanced and then retreated, and the intensity of the first peak for the Ob-Hw coordination pair initially increased and then decreased. Hydrogen bond strength increases as bond length decreases, so the variation in first-peak intensity of the RDF mirrors the trend in H2O–Mnt interfacial hydrogen bond energy. At low degrees of hydration, water–Mnt interactions were weak and the RDF first peak was broad and of low intensity. As hydration increased, the primary RDF peak became sharper and its intensity increased, indicating strengthening of hydrogen bond interactions between water molecules and surface bridging oxygens. At high hydration levels, water–water interactions dominated; the RDF first-peak intensity then declined, signifying a reduction in hydrogen bonding between water and the Ca-Mnt surface.
Interaction at the water–Mnt interface
Interaction energy is commonly used to describe the total energy of interaction between two or more particles. As the interaction force between the particles increases, the interaction energy becomes larger. A negative value indicates an adsorption interaction, while a positive value represents a repulsive interaction. Polymer-solution interaction energies were computed using the Energy Calculation module of MS Forcite, with energy components isolated via Fragment Analysis. Perl scripts sampled total energy every 100 fs through the MS API, applying Savitzky-Golay filtering (1 ps window) for noise reduction. The interaction energy between a polymer and a solution can be calculated using the following formula:
 $$ {E}_{\mathrm{int}}={E}_{\mathrm{A}+\mathrm{B}}-{E}_{\mathrm{A}}-{E}_{\mathrm{B}} $$
where E int represents the interaction energy, E A+B is the total energy of the hydrated Ca-Mnt system, E A is the energy of the anhydrous Ca-Mnt, and E B is the energy of the water molecules.
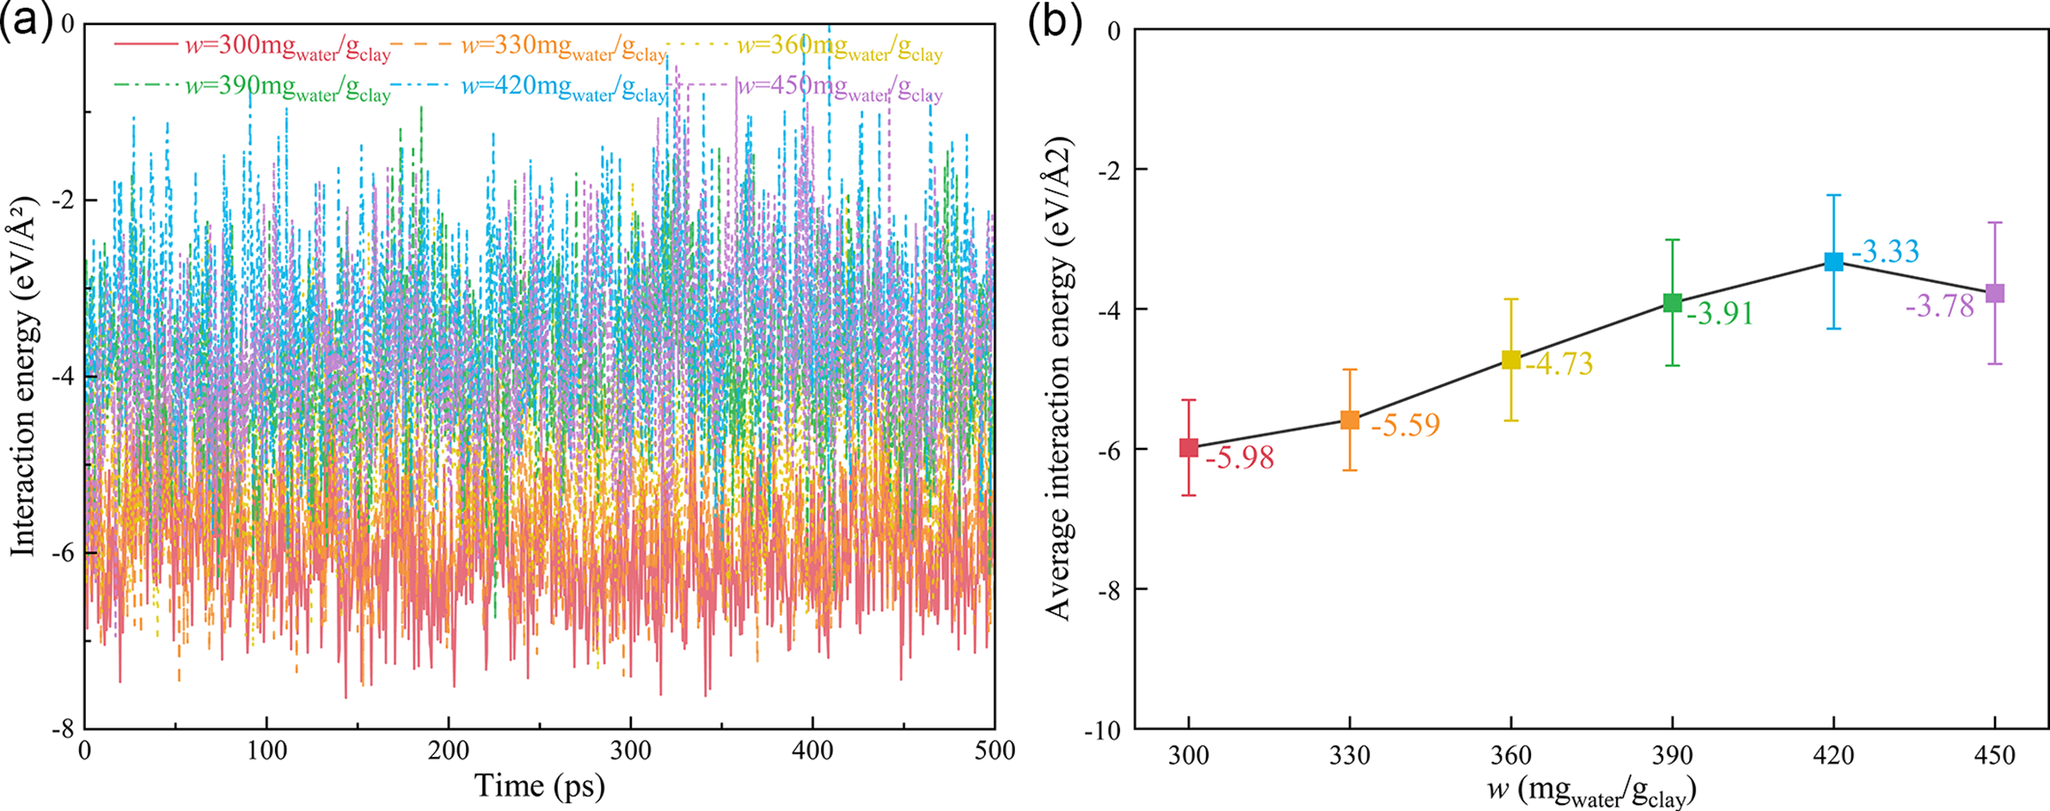
The average interfacial interaction energy between Ca-Mnt and water molecules exhibited significant variations at different hydration degrees. The interaction energy between Ca-Mnt and water molecules changes over time at various hydration degrees (illustrated in Fig. 6), revealing the influence of hydration on the interaction at the water–Mnt interface. The interfacial interaction energy is negative, and its magnitude reflects the strength of attraction. Within the studied hydration range, the absolute value of the mean interfacial energy first decreased with increasing water content – from 300 mg water per gram of clay to 420 mg water per gram of clay; it fell by ~2.65 eV Å–2 – but then showed a slight increase at greater hydration levels.
(a) Interactions of the time-dependent interface energy; (b) average interfacial interaction energy.

At low hydration, water molecules form one to two layers; those closest to the clay remain directly coordinated to Ca2+ and the silicate sheets, while any outer-layer molecules interact primarily via hydrogen bonds. In this regime, strong Ca2+–H2O electrostatic attraction and hydrogen bonding to surface bridging oxygens give a large interfacial energy magnitude. As more water enters, gallery expansion carries some molecules away from the surface, weakening Mnt–water interactions even as a hydrogen bond network among water molecules builds; this reduces the interfacial energy magnitude. At high hydration, three to four water layers develop. Water clusters form a stable, hydrogen-bonded network, and the cooperative action of Ca2+, water, and the silicate layers strengthens interfacial attraction, so the absolute interfacial energy increases slightly and approaches a new equilibrium.
Thus, the non-monotonic trend – initial decrease then increase – in interfacial energy magnitude is governed by two competing effects. At low hydration, enhanced hydrogen bonding at the clay–water interface is outweighed by reduced electrostatic attraction due to water screening, driving the energy magnitude down. At high hydration, the formation of a robust water cluster and a strong Ca2+–water hydration shell dominates, raising the interfacial energy magnitude despite a relative decline in Mnt–water hydrogen bonds.
Interlayer spacing
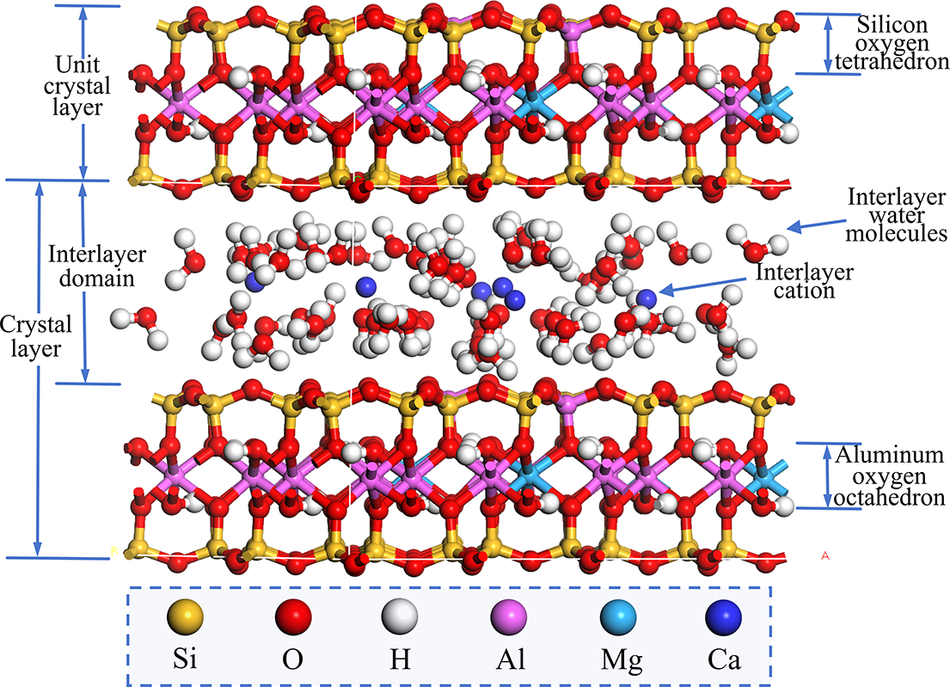
Mnt is a 2:1 clay mineral (TOT type), which belongs to a layered aluminosilicate mineral containing water (Fig. 7). Its structural unit layer is composed of two Si-O tetrahedral sheets (T layer) with inward vertex angles sandwiched by an Al-O4(OH)2 octahedral sheet (O layer) (Emmerich et al., Reference Emmerich, Koeniger, Kaden and Thissen2015; Katti et al., Reference Katti, Thapa and Katti2018). This layered structure allows Mnt to expand upon water adsorption and to contract upon dehydration. In addition, the crystal structure contains a significant amount of negative charge, which can attract moisture, leading to volumetric changes in the Mnt.
Example of a Ca-Mnt crystal cell structure.

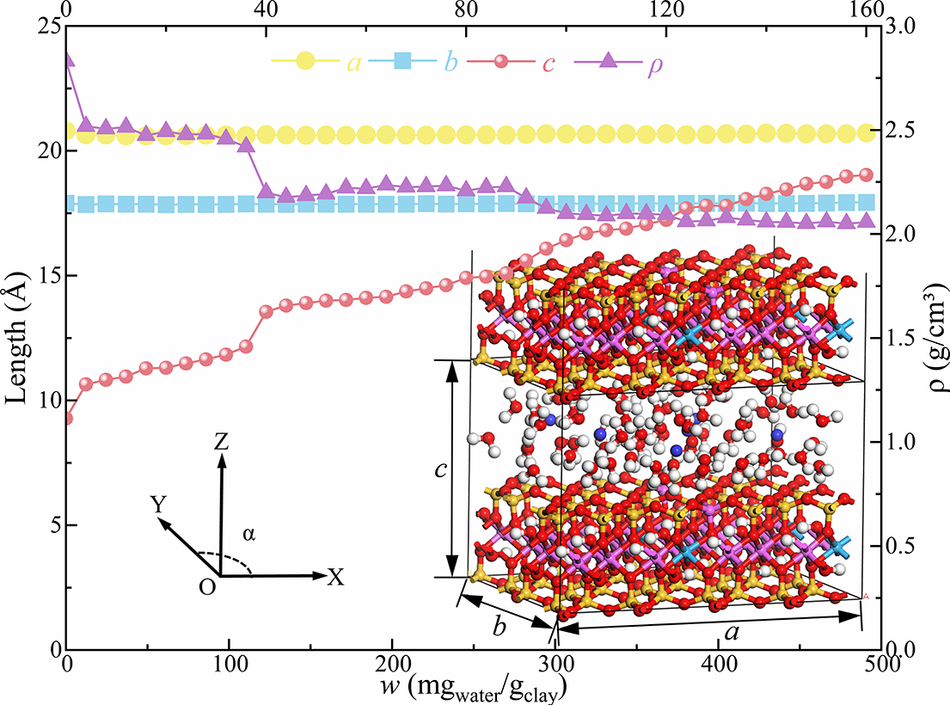
The Adsorption Locator module is used to adsorb different amounts of water molecules to simulate the changes in Ca-Mnt adsorbed water in different hydration states. The variations in lattice parameters, interlayer spacing, and density of the basic Ca-Mnt unit, which consists of a single TOT structural layer and its associated interlayer domain are shown in Fig. 8. The basic interlayer spacing consists of both the interlayer distance and thickness of the mineral sheets, and the interlayer spacing in this model is defined as the c parameter of the orthorhombic unit cell (where the average value is adopted for supercell configurations).
Water-absorption expansion deformation curve of Ca-Mnt.

From Fig. 8, it is evident that during hydration, the lattice length in the XY direction remained nearly constant, whereas the changes in the Z direction were significant. The variation in the basic interlayer c spacing showed a stepwise increase, confirming that Mnt adsorbs water molecules during hydration, as expected, causing a significant change in the basic layer spacing. The density decreased in a stepwise manner as hydration progressed, starting from a greater initial density that gradually decreased with an increase in the number of water molecules. This aligns with the expansion and volume increase caused by interlayer hydration (Chang et al., Reference Chang, Skipper and Sposito1995; Karaborni, Reference Karaborni, Smit, Heidug, Urai and Van1996; Li et al., Reference Li, Li, Gui, Zhan, Gu, Yu and Rowe2024).
The hydration of Ca-Mnt is divided into two stages: crystalline expansion and osmotic expansion. During the crystalline expansion stage, the basic interlayer spacing (c) increases in a stepwise manner as the water content increases, while in the osmotic expansion stage, the increase is linear (Norrish, Reference Norrish1954; Fink and Thomas, Reference Fink and Thomas1964; Saiyouri et al., Reference Saiyouri, Tessier and Hicher2004). When Ca-Mnt begins to adsorb water from a completely dry state, water molecules enter the interlayer spaces and form hydrogen bonds with the bridging oxygen atoms on the surface. In this phase, the water adsorption quickly increases the interlayer spacing, causing a rapid rise in c. The growth of the interlayer spacing is limited mainly by the interaction between the water molecules and the bridging oxygen atoms on the surface. Initially, water molecules interact primarily with the bridging oxygen atoms on the crystal surface through hydrogen bonds. As water molecules gradually enter the Ca-Mnt interlayer, the pores are filled progressively with water molecules. The first layer of water molecules fills up gradually, leading to an increase in the number of water layers and a sudden jump in interlayer spacing, which appears as a stepwise growth. When the water content exceeds the critical value, the system enters the osmotic expansion phase, and more water molecules enter the interlayer. As hydration continues, the interlayer spacing continues to increase, but the rate of increase slows. The hydrogen bonding coordination opportunities of the bridging oxygen atoms decrease gradually, and water molecules begin to form hydrogen bonds with each other.
Mechanical properties analysis
Stress–strain relationship
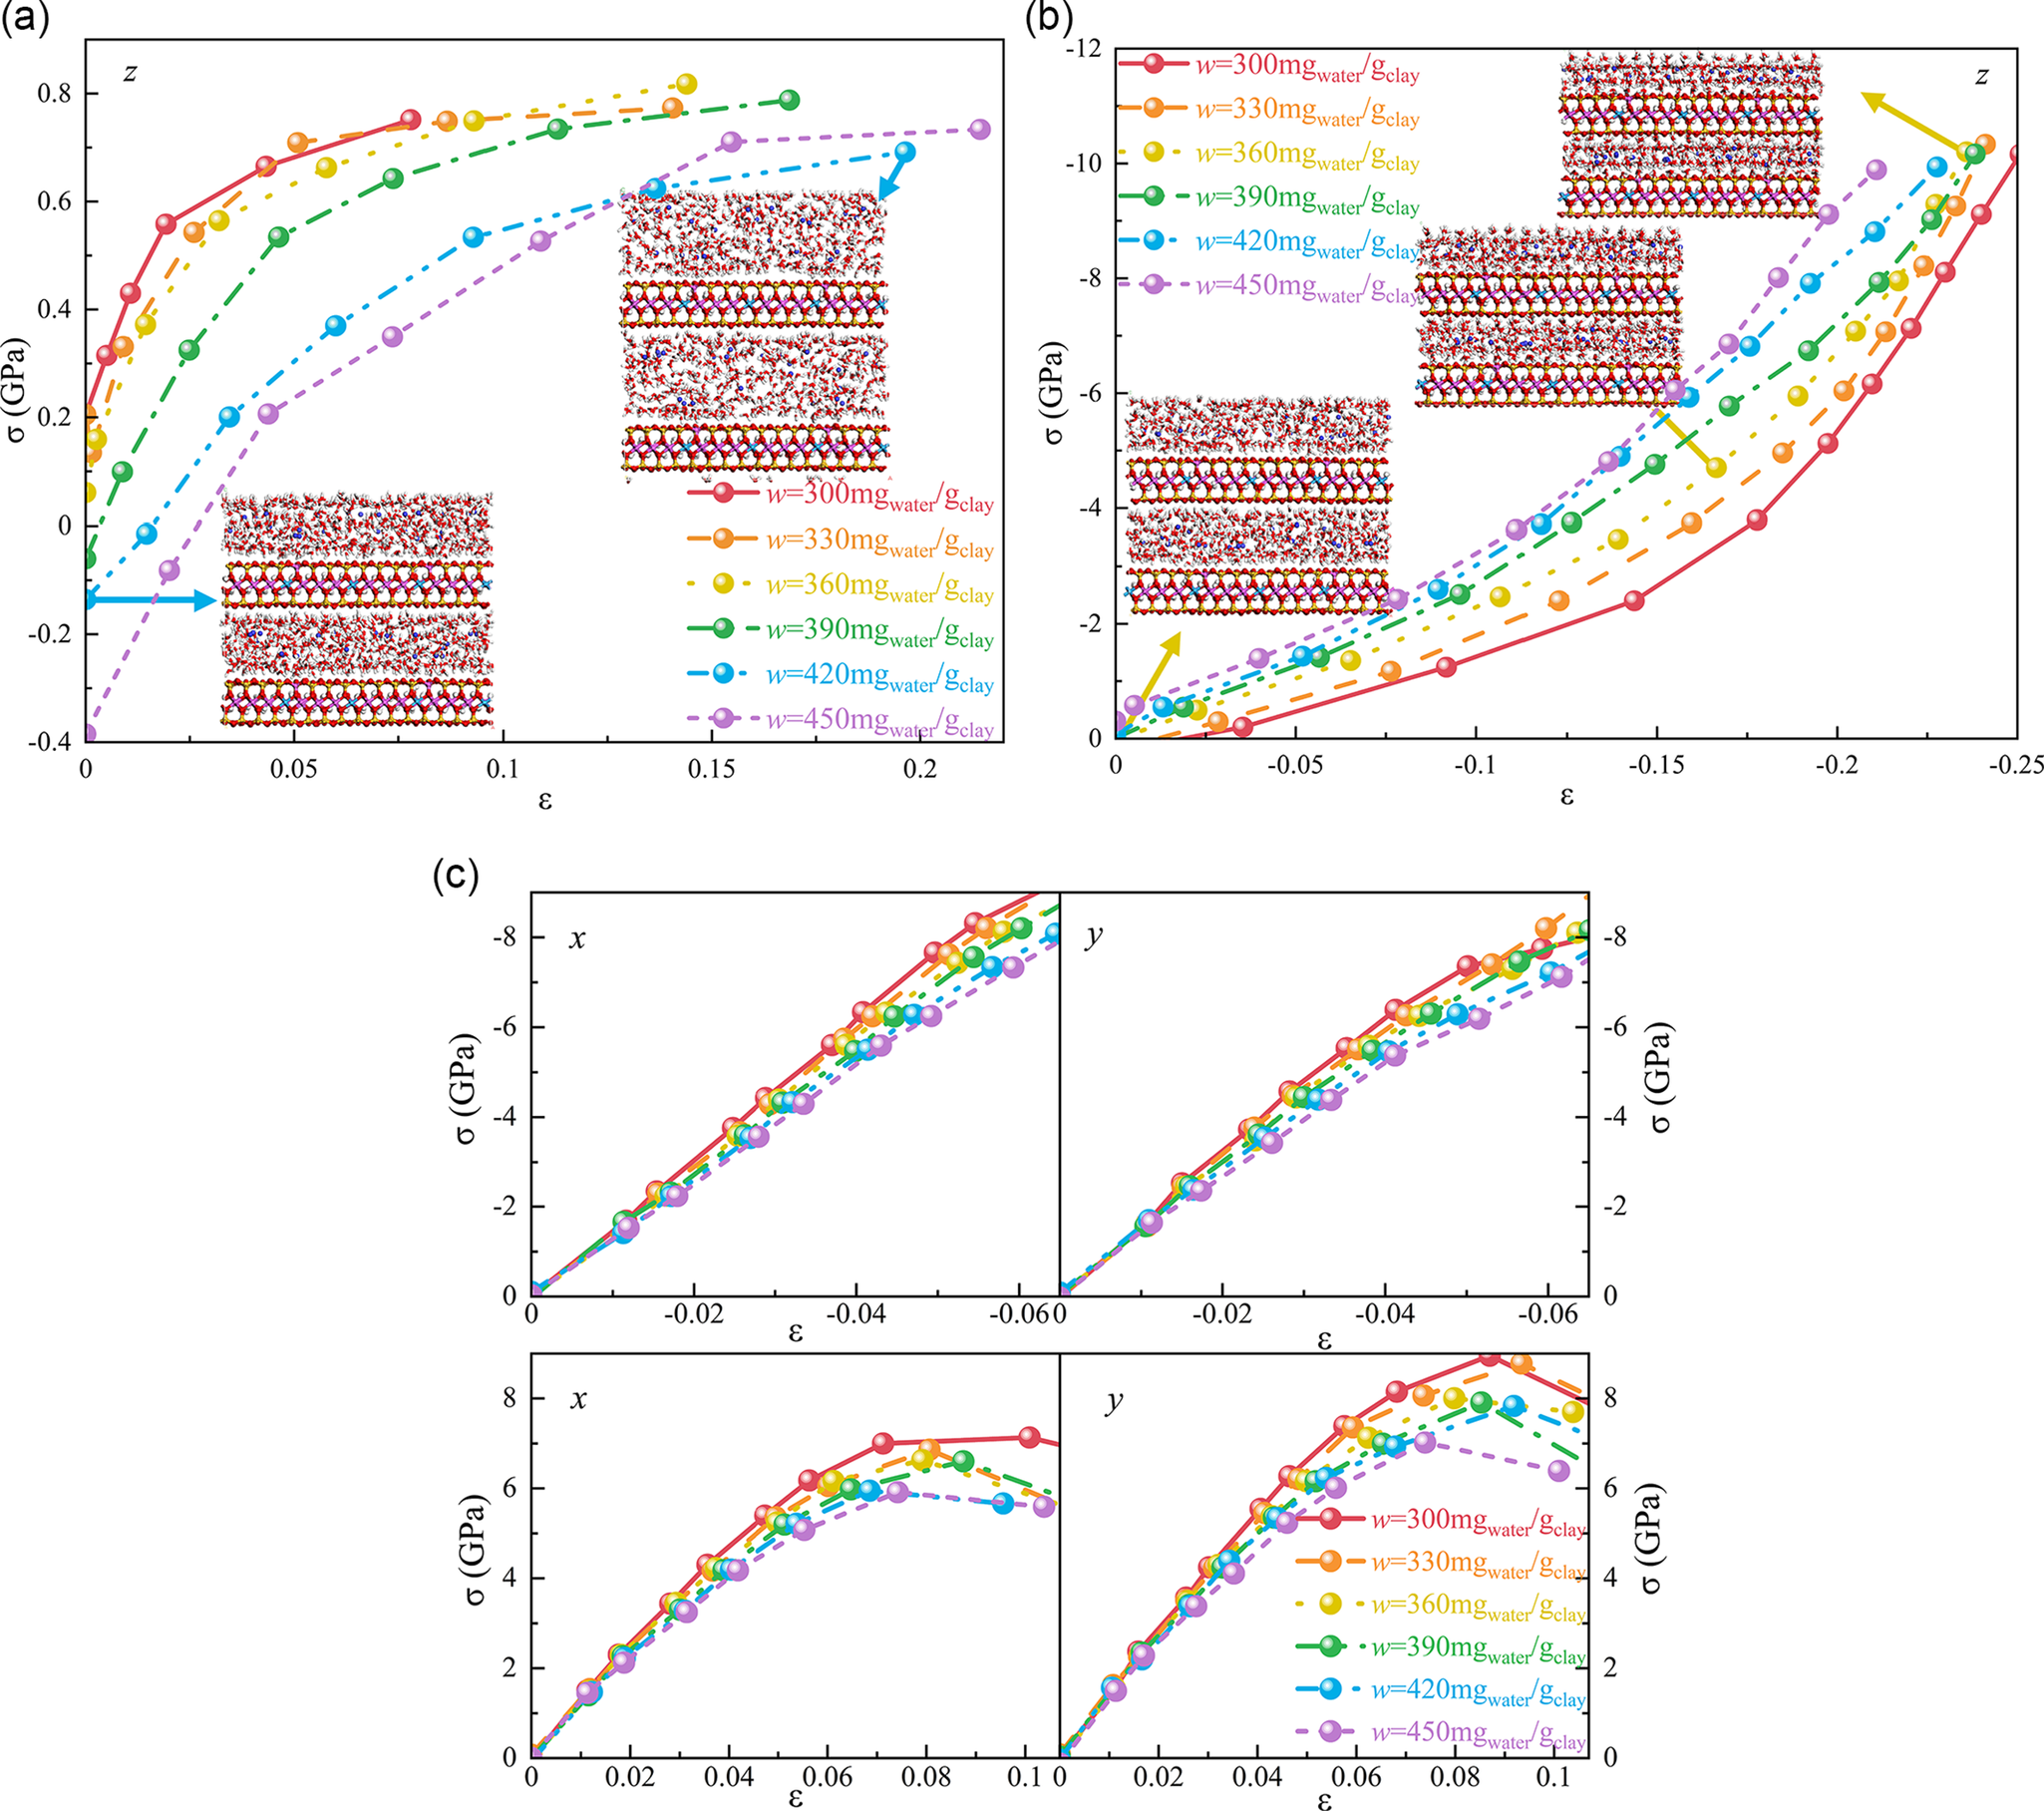
The mechanical properties of clay minerals are influenced significantly by the arrangement of their internal unit cells. Therefore, after the initial interlayer distribution and structure reach equilibrium, a uniaxial tension–compression stress–strain study of the Ca-Mnt system with varying degrees of hydration was conducted using Perl scripts. Uniaxial loading was performed via Deformation tasks in Forcite (Biova Materials Studio) at a constant direction strain rate, with NPT ensemble in other directions. Stresses from Forcite’s Stress Analysis were averaged over 0.1 ps intervals using Perl scripts. Based on the structural characteristics and preliminary tests, the input stress variation range was set to –12 to 1 GPa along the Z direction, and –10 to 10 GPa along the X and Y directions.
Anisotropic stress–strain relationships (Fig. 9) highlighted the crystallographic directionality effects. The stress–strain behavior of hydrated Ca-Mnt was similar in the X, Y, and Z directions. However, owing to the weaker interlayer interactions in hydrated Ca-Mnt, the stress in the Z direction was significantly less than that in the other directions. This is attributed primarily to the presence of water between the Ca-Mnt layers, where the non-bonded interactions have much less connectivity strength than the covalent or ionic bonds within the mineral planes. This is clearly reflected in the simulated tensile strength results. During the stretching process along the Z direction, the layers of the Ca-Mnt system detached while the internal tetrahedral and octahedral sheets maintained their structural integrity (Zhang et al., Reference Zhang, Xie, Hu, Shao and Gatmiri2012).
(a) Tensile properties in the Z-axis direction; (b) compression properties in Z-axis direction; (c) tensile compression properties in X-axis or Y-axis direction.

The tensile and compressive stress–strain curves for the Ca-Mnt system in the Z direction at various hydration degrees are shown in Fig. 9a,b. As the strain increased, both tensile and compressive stresses increased gradually, exhibiting a pronounced non-linear growth trend. However, the magnitude of the stress during compression was significantly greater than that during tension. In the small-strain range, the rate of stress increase was relatively quick across various degrees of hydration. As hydration increased, the tensile strength in the Z direction decreased gradually, while the compressive strength increased. At lower degrees of hydration, fewer interlayer water molecules resulted in a tighter interlayer structure and stronger van der Waals forces, leading to greater overall tensile strength. As more water molecules gradually fill the interlayer spaces, the increased interlayer distance weakens both the van der Waals forces and electrostatic interactions between the Ca-Mnt layers, thus reducing the tensile performance. In contrast, during compression, as hydration increases, the water molecules become more densely arranged, enhancing hydrogen bonding interactions and leading to a greater interlayer interaction energy, which increases the compressive strength.
The uniaxial tensile and compressive stress–strain curves for the Ca-Mnt system in the X/Y directions are shown in Fig. 9c. Both the tensile and compressive behaviors exhibited symmetrical non-linear growth trends in the X and Y directions. Compared with the Z direction, the stress–strain curves in the X/Y directions were flatter, with significantly lower tensile and compressive strengths. This is because, in the X/Y plane, the forces act primarily on the tetrahedral and octahedral layered structures of Ca-Mnt, where the inter-atomic forces are greater. Thus, the influence of water molecules on the mechanical performance in these directions was relatively small, resulting in more consistent mechanical properties.
During the tensile process, the introduction of water molecules affected the interlayer bonding force of Ca-Mnt significantly. Initially, a small number of water molecules acted as lubricants, reducing the van der Waals forces between the layers. However, at this stage, the effect of hydrogen bonding was still minimal, resulting in a relatively high tensile strength. As more water molecules penetrated the interlayer space, the interlayer spacing gradually increased, and the electrostatic interactions and van der Waals forces between the crystal layers weakened significantly. This is especially pronounced in the Z direction, where the gradual infiltration of water molecules reduces the direct interlayer interactions, ultimately causing the tensile strength to decrease with increasing degree of hydration. Conversely, during compression, the increase in water molecules enhances hydrogen bonding between the layers, forming a more stable water network. This hydrogen-bonded network acts as an energy-absorbing buffer during compression, leading to a gradual increase in the compressive strength. The findings of this study are similar to those reported by Zhang et al. (Reference Zhang, Xie, Hu, Shao and Gatmiri2012), both of which demonstrate the significant impact of hydration on the crystal structure and mechanical properties. However, there was a notable difference in the compressive strength changes between Ca-Mnt and Na-Mnt (Kuang, Reference Kuang2014). This can be attributed to Ca2+, the interlayer cation in Ca-Mnt, which has a greater charge density. As a result, Ca-Mnt forms a more tightly packed hydration layer during the hydration process, strengthening the interlayer hydrogen bonding and leading to a significant increase in the compressive strength with increasing hydration. In contrast, the hydration behavior of Na-Mnt is governed primarily by the weaker electrostatic forces of Na+, resulting in a less stable hydration layer and a less pronounced improvement in compressive strength.
Stress–strain hysteresis curve
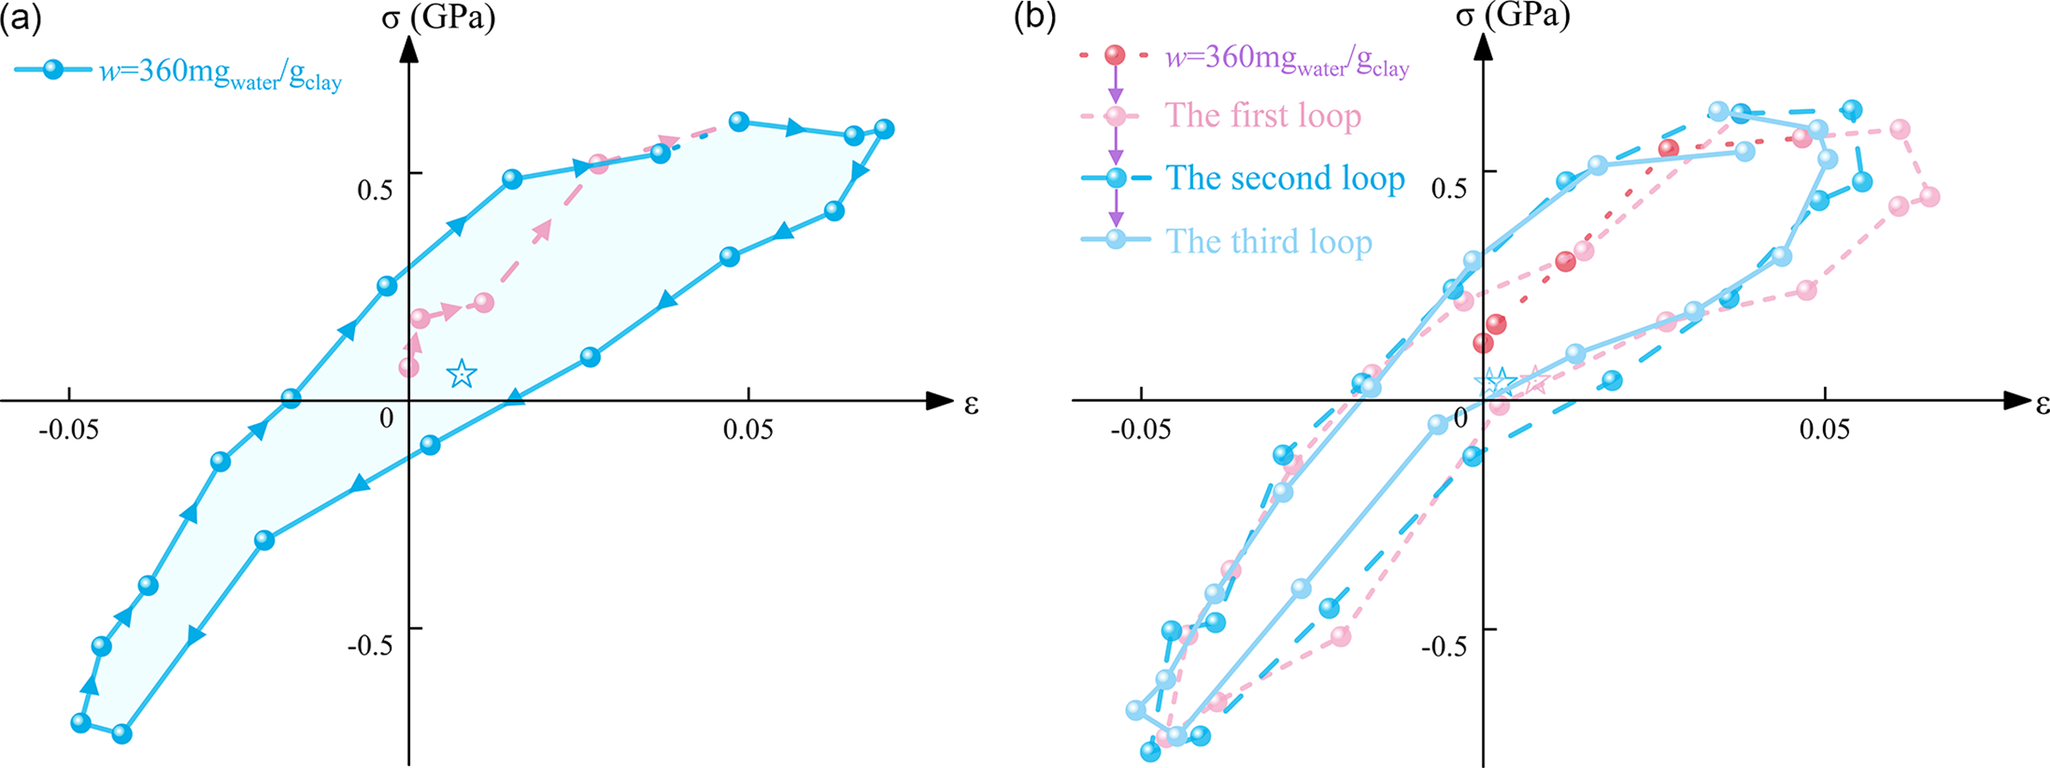
The hysteresis curve reflects the energy dissipation of a material under cyclic loading, with the microstructural changes in Ca-Mnt, particularly variations in interlayer spacing and crystal layer slippage, being key factors influencing the non-linear characteristics of the curve. At a moisture content of 36%, cyclic tensile-compressive stress loading was applied to Ca-Mnt in the Z direction, resulting in the stress–strain hysteresis curve (Fig. 10). In the viscoelastic regime, the stress–strain response of Ca-Mnt exhibits pronounced non-linearity, with clear hysteresis during both loading and unloading. Under cyclic loading, Ca-Mnt develops significant plastic deformation and dissipates substantial energy. As the number of load cycles increased, the hysteresis loops gradually converged toward a stable shape and yet retained their non-linear character. Changes in loop geometry and in the displacement center directly reflected the energy dissipation in the material behavior. After repeated loading and unloading, an enduring dissipation mechanism becomes established within the internal structure of Ca-Mnt, as evidenced by the stabilization of the hysteresis-loop form. Nevertheless, the persistent non-linearity indicated that irreversible plastic deformation and energy loss continued to occur under cyclic loading.
(a) Stress–strain retardation curve of Ca-Mnt in a single cycle; (b) stress–strain retardation curve of Ca-Mnt in three cycles.

The observed stress–strain hysteresis and phase lag in hydrated Ca-Mnt under cyclic tensile-compressive loading arise from the interplay of internal energy dissipation and crystal structure reorganization. Energy is dissipated via three principal pathways: friction between particles, interlayer forces (including electrostatic adsorption and van der Waals interactions), and the material’s own elastic and plastic deformation. During loading, a portion of the mechanical work is irreversibly converted to heat through viscous processes such as interlayer slip and rearrangement of water molecules. Upon unloading, the release of elastic potential energy is delayed by structural-response lag, preventing a symmetric recovery. The layered Ca-Mnt structure and its hydration films adjust dynamically: the water-rich layers act as lubricants promoting slip, while Ca2+-mediated electrostatic bridges generate frictional losses. Concurrently, the breaking and reformation of hydrogen-bond networks among water molecules exacerbate energy dissipation. During unloading, delayed adhesion at the Ca-Mnt–water interface and slow diffusion of water molecules hinder structural rebound, causing strain to lag behind changes in stress.
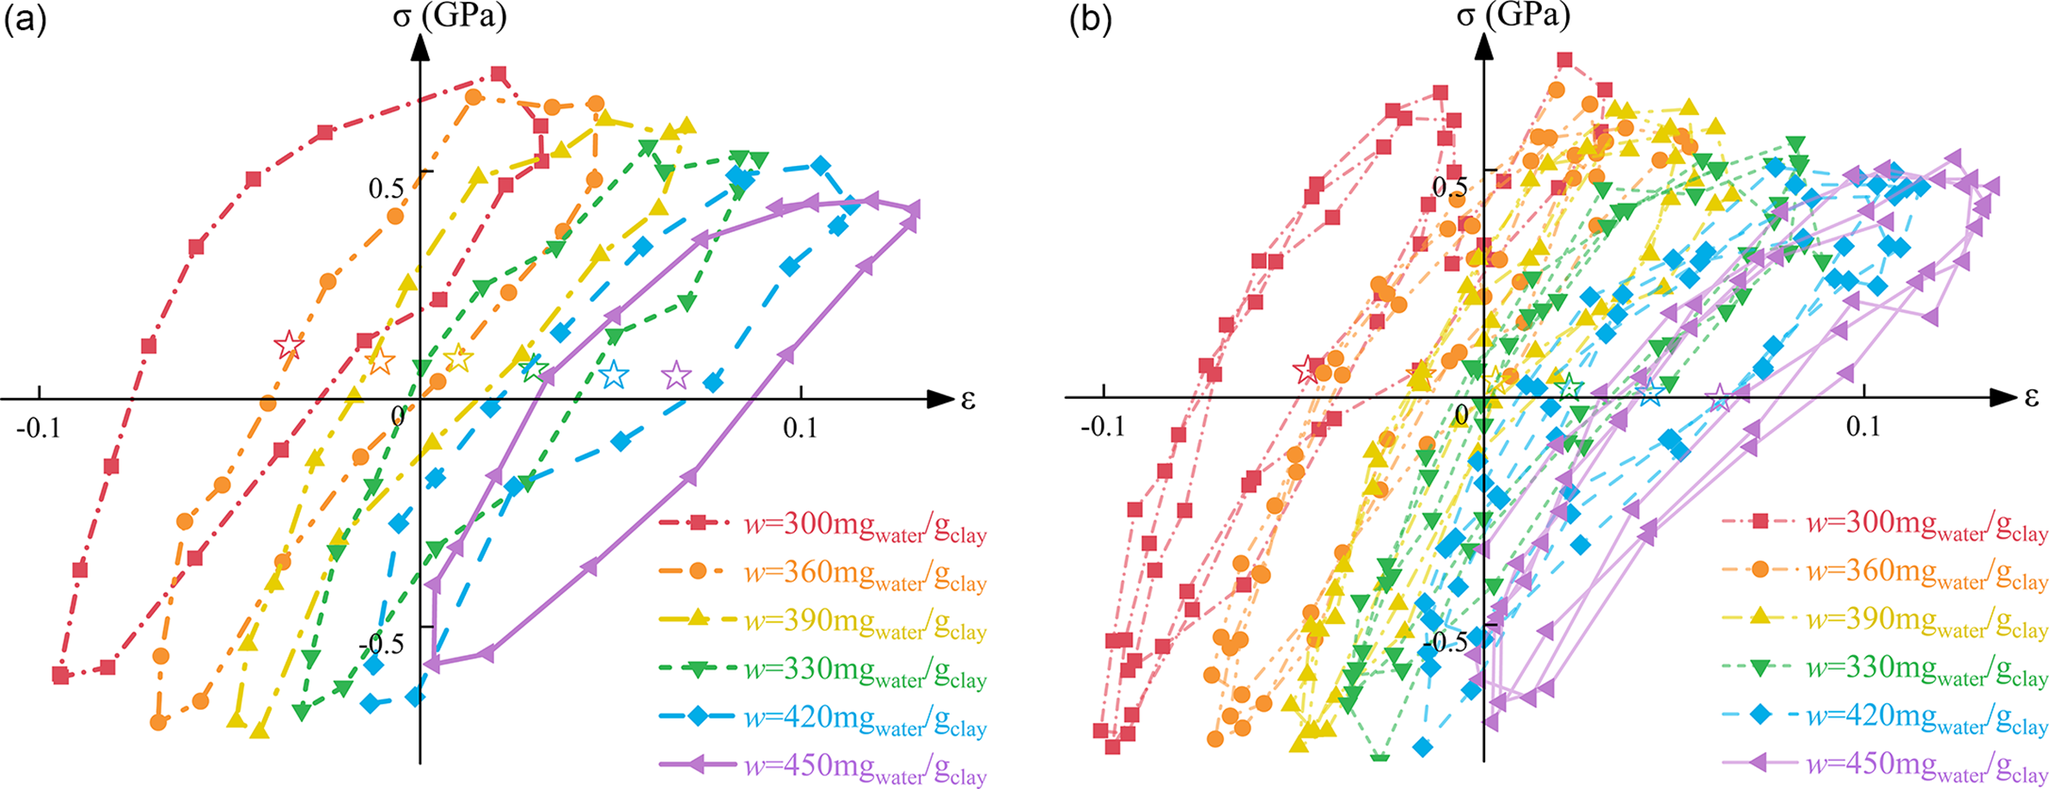
Further analysis of the stress–strain hysteresis curves of Ca-Mnt at different degrees of hydration (Fig. 11) revealed that the hysteresis loops shifted to the right as hydration increased, and the non-linear characteristics of the curves became more pronounced. In the Ca-Mnt system, degree of hydration exerts a pronounced influence on the shape of the stress–strain hysteresis loops. At low degrees of hydration, few interlayer water molecules lead to minimal expansion of the interlayer spacing. The confined interlayer region imposes strong interparticle interaction forces, so particle slip must overcome significant resistance; as a result, the hysteresis loop exhibits a limited strain range and low energy dissipation. With increasing hydration, water molecules progressively fill the interlayer galleries and enlarge the spacing. The greater interlayer distance allows wider strain excursions and enhances energy dissipation, producing a rightward shift of the hysteresis loop. Under high hydration conditions, transient hydrogen-bond networks form between water molecules, further increasing layer deformability. This promotes more vigorous particle slip and yields increasingly pronounced non-linearity over an expanded strain range.
(a) Stress–strain retardation curve of Ca-Mnt under various degrees of hydration in a single cycle; (b) stress–strain retardation curve of Ca-Mnt under various degrees of hydration in three cycles.

The rightward translation of the hysteresis loop directly reflects structural modifications in the Ca-Mnt crystal during hydration. As water penetrates the interlayer, the d spacing increases and the electrostatic and van der Waals forces between layers weaken. The reduction in interparticle friction facilitates layer slip, shifting the stress–strain response towards higher strains. Thus, the rightward offset of the hysteresis loop signals both relaxation of the internal structure and the onset of greater irreversible plastic deformation, which together amplify the energy dissipation of the system.
Within the non-linear portion of the hysteresis, the lubricating action of interlayer water is critical. As hydration increases, water wetting markedly reduces frictional resistance between particles, thereby strengthening interlayer slip. This enhanced slip produces a substantial overall strain offset; at large strains, Ca-Mnt undergoes irreversible plastic deformation during both loading and unloading, rendering the hysteresis loops smoother and more symmetric in their non-linearity. Although repeated cycling eventually stabilizes the loop shape, the persistent presence of interlayer water sustains elevated energy dissipation through continued slip mechanisms.
Equivalent damping ratio
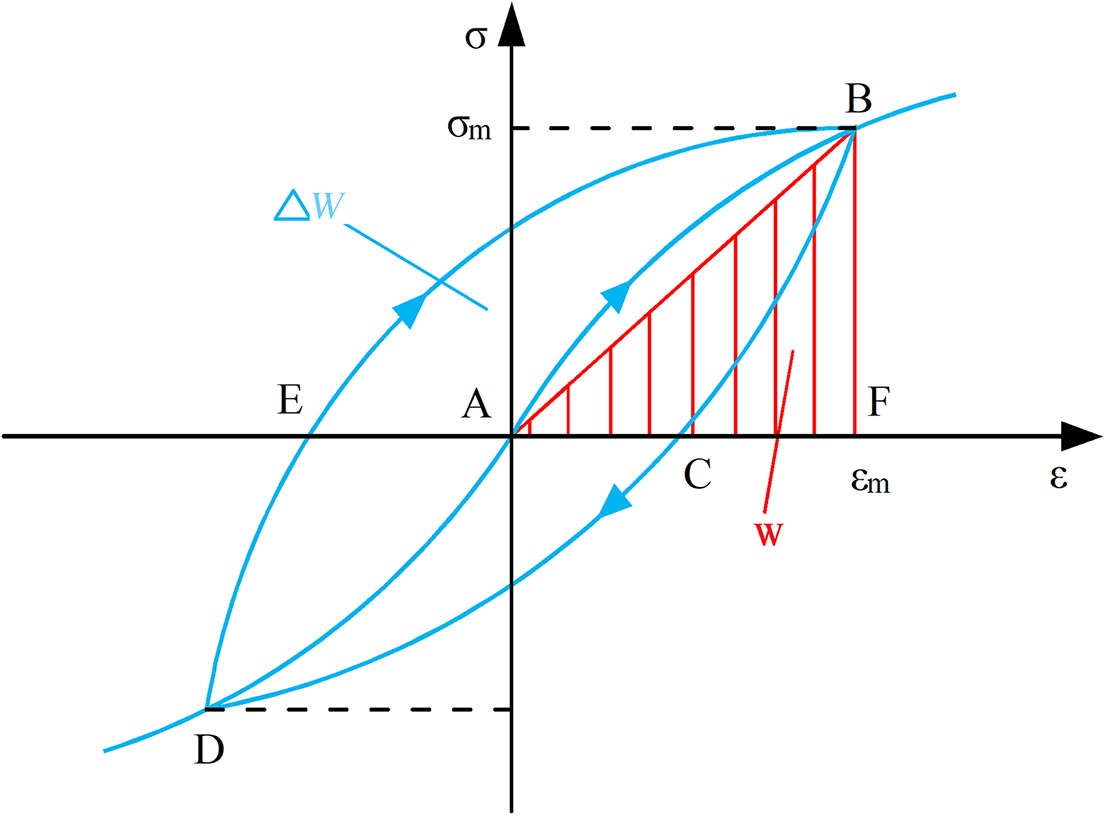
The equivalent damping ratio of soil materials is a phenomenon of energy dissipation under cyclic loading, typically manifesting as thermal energy, which results in attenuation of vibrations. Damping ratio derivation (Fig. 12) geometrically links hysteresis energy to peak strain energy. It can be defined as the ratio of the area of the hysteresis loop ∆W(BCDEB) to the area of triangle W(BFA) (Seed et al., Reference Seed, Wong, Idriss and Tokimatsu1986; Rollins et al., Reference Rollins, Evans, Diehl and Lii1998; Tennakoon and Indraratna, Reference Tennakoon and Indraratna2014).
Stress–strain hysteresis curve.

To eliminate the stress magnitude discrepancies caused by the size effect of Ca-Mnt during MD simulations, this study investigated the stress–strain response characteristics of Ca-Mnt under cyclic uniaxial tensile and compressive loading conditions with the same compaction degree but varying moisture content. Preliminary tests indicated that the applied stress maximum approached the peak stress, allowing the response stress–strain data to be normalized according to Eqn (2) to derive the variation trend of the soil damping ratio:
 $$ D=\frac{\eta }{2}=\frac{E^{\prime \prime }}{\left(2{E}^{\prime}\right)}=\frac{\varDelta W}{\left(4\unicode{x03C0} W\right)}=\frac{\tan \unicode{x03B4}}{2} $$
where η is the damping coefficient (loss factor), E′ is the storage modulus, E″ is the loss modulus, ∆W is the area of hysteresis loop, W is the triangular area, and δ is the phase angle difference.
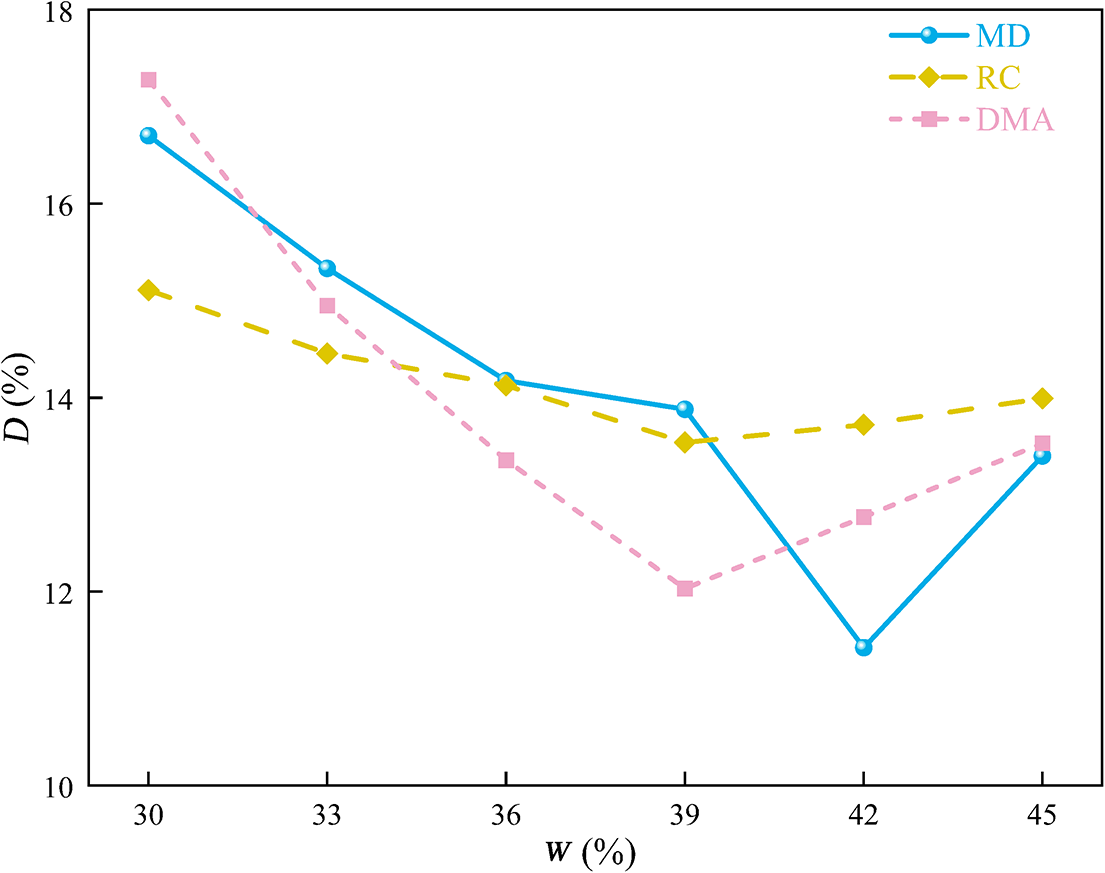
MD simulations captured the interactions between water molecules and Mnt crystal layers accurately at the microscopic scale, including the formation of hydrogen bond networks, the weakening of electrostatic forces, and changes in the interlayer van der Waals forces. These microscopic interactions elucidated the trends in damping ratio and revealed the energy-dissipation mechanisms of the material at different hydration degrees. To provide a comprehensive understanding of the damping characteristics of hydrated Ca-Mnt, the present study compared the MD simulation results with macroscopic experimental results, such as RC and DMA tests (Fig. 13). For comparison, the RC damping ratio was taken at a strain value of 1E-2, whereas DMA represented the maximum damping ratio, with all three approaches yielding similar trends in damping ratios as moisture content varied (Lin et al., Reference Lin, Ni, Garg and Yu2020; Su et al., Reference Su, Cui, Dupla and Canou2021).
Comparison of simulation and test results for equivalent damping ratio.

Hydration exerts a dynamic regulatory effect on the interfacial interactions within the Ca-Mnt system, causing the damping ratio to decrease at first and then to increase. In the initial stage of hydration, water molecules infiltrate the interlayer region of Ca-Mnt by permeation and preferentially adsorb around Ca2+ ions to form hydrated ion clusters. This process weakens the electrostatic attraction between Ca2+ and the Mnt layers, thereby reducing the resistance to interlayer slip. Although hydrogen bonds strengthen gradually between water molecules and surface bridging oxygen atoms, their energetic contribution is overshadowed by the reduced electrostatic shielding of Ca2+. As a result, the overall magnitude of interfacial interaction energy declines, the binding between water and the Mnt layers becomes more relaxed, and molecular-level slip resistance reduces, leading to a reduction in damping ratio. As hydration progresses further, water molecules within the interlayer transform from a disordered adsorbed state to a more highly oriented arrangement, and a stable hydrogen-bond network begins to develop between the Ca-Mnt layers. This restructuring enhances interfacial interactions: water molecules bind more tightly to the silicate sheets, which in turn increases internal friction and energy dissipation. Consequently, the damping ratio rises under high-hydration conditions, reflecting the re-strengthened interlayer forces and the formation of a robust, water-mediated dissipation mechanism.
Various testing methods revealed different mechanisms for the effect of water on the damping ratio of the materials. Macroscopic tests (such as RC and DMA) reflect primarily the effects of water lubrication and expansion on the macroscopic mechanical properties of soil. In contrast, MD simulations can capture precisely the microscopic interactions of water molecules in the interlayer spaces of Ca-Mnt, clearly depicting the changes in the hysteresis curve shapes under different degrees of hydration. However, in practical experiments, factors such as temperature, material heterogeneity, and loading rate of external stress may lead to differences in the shape of the hysteresis curves when compared with the simulation results. For instance, in macroscopic tests, changes in frictional force and internal friction angle might contribute more prominently to the non-linear features of the hysteresis curves, whereas MD simulations focus more on capturing the effects of interlayer slippage and the water molecule network on energy dissipation. However, owing to the complex environmental conditions of macroscopic experiments and the single, idealized settings of the MD simulation model, the absolute damping-ratio values obtained by the two methods will differ. Nonetheless, both MD and experimental results exhibited the same trend: the hysteresis loops shifted to the right. To some extent, MD simulation can provide a theoretical basis for understanding microstructural evolution, but the damping performance of real materials must be evaluated through a combination of microscopic-mechanism analysis and multi-condition experimental validation.
Conclusions
Based on MD simulations, the present study investigated systematically the changes in the crystal structure and stress–strain response of Ca-Mnt at varying degrees of hydration. The main conclusions are as follows:
-
(1) As the degree of hydration increased, the interlayer spacing of Ca-Mnt grew markedly as water molecules penetrated the galleries progressively, and established a stable hydrogen bond network. This process weakens the interlayer electrostatic and van der Waals forces, thereby altering the crystal structure characteristics of the material. During hydration, the interaction energy at the H2O–Mnt interface first decreases and then increases, revealing the evolution of the crystal structure induced by water uptake.
-
(2) The stress–strain response of Ca-Mnt exhibited a significant anisotropy. The mechanical properties in the X and Y directions remained relatively stable and were less affected by hydration. In contrast, the stress–strain behavior in the Z direction showed significant variation, with the tensile strength decreasing and the compressive strength increasing as hydration increased. This anisotropy is mainly attributed to the layer structure of Ca-Mnt and the differences in the water–Mnt interfacial interactions along different directions.
-
(3) The hysteresis curves shifted to the right as hydration increased, demonstrating the non-linear deformation characteristics of Ca-Mnt under cyclic loading and its enhanced energy dissipation capacity. This indicates that the sliding of water molecules between layers and the structural adjustment of the crystal play a critical role during cyclic loading, particularly under high hydration conditions where plastic deformation becomes more pronounced.
-
(4) The equivalent damping ratio exhibited a trend of first decreasing and then increasing with hydration. In the low-hydration phase, weakening of the interlayer forces leads to a decrease in the damping ratio. However, in the high-hydration phase, the formation of a stable hydrogen bond network among water molecules promotes energy dissipation, causing the damping ratio to recover. This dual effect suggests that the hydration process significantly regulates the energy-dissipation mechanism of Ca-Mnt. Moreover, the trends observed in the simulation were consistent with the experimental results, indicating that MD simulations can effectively capture the microstructural and stress–strain response changes of Ca-Mnt under different degrees of hydration.
Supplementary material
The supplementary material for this article can be found at http://doi.org/10.1017/cmn.2025.10011.
Data availability statement
Data sharing is not applicable to this article as no datasets were generated or analysed during the current study.
Author contributions
Y.Z. spearheaded the molecular dynamics simulations. Q.S. oversaw the micro-detection experiments and provided methodological expertise. Y.Y. assisted in the comprehensive analysis and interpretation of the results. All authors have substantively contributed to the research, and have reviewed and approved the final manuscript.
Financial support
The authors gratefully acknowledge the support of the National Natural Science Foundation of China (41672296), Guangxi Key Laboratory of Disaster Prevention and Mitigation and Engineering Safety (2019ZDX02), and Natural Science Foundation of Hunan Province (2023JJ50183, 2023JJ50185 and 2023JJ50206).
Competing interests
The authors declare none.