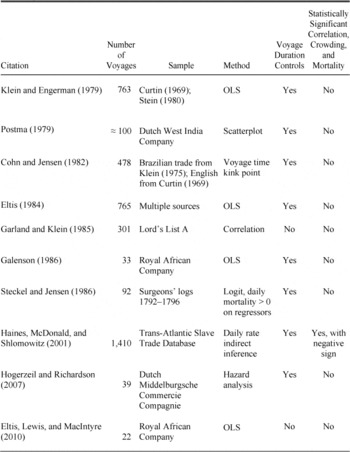
The Middle Passage of the transatlantic slave trade was crowded and often deadly. Many historical accounts have linked the overcrowded conditions on the voyages to slaves’ ill health and high mortality rates. For example, Alexander Falconbridge (Reference Falconbridge1788) describes a voyage where “the slaves were so crowded… that, without meeting with unusual bad weather, or having a longer voyage than common, nearly one-half of them died…” (p. 26).Footnote 1 Surprisingly three decades of studies by economic historians (see Table 1) have failed to find that more crowded voyages suffered higher slave mortality. Across a variety of datasets and empirical specifications, regressions of mortality on measures of crowding show no association, controlling for the duration of the passage, the size of the vessel,Footnote 2 and other covariates (Cohn and Jensen Reference Cohn and Jensen1982; Steckel and Jensen Reference Steckel and Jensen1986; Garland and Klein Reference Garland and Klein1985; Haines, McDonald, and Shlomowitz Reference Haines, McDonald and Shlomowitz2001; Hogerzeil and Richardson Reference Hogerzeil and Richardson2007). To date, no published study has found a positive, statistically significant relationship between crowding and slave mortality.
This purported fact has so intrigued scholars that the more recent literature hasproposed economic explanations for it. Herbert Klein (Reference Klein2010) argues that vessel overcrowding was exaggerated by European abolitionists, and that the conditions endured by slaves were comparable to those tolerated by European immigrants to the Americas (though worsened by tropical disease). Other scholars argue that there must be some omitted variable which mitigates mortality and is correlated with crowding, obscuring the effect—for instance, conditions in coastal slave forts (Haines, McDonald, and Shlomowitz Reference Haines, McDonald and Shlomowitz2001; Hogerzeil and Richardson Reference Hogerzeil and Richardson2007), or health improvements to shipping practices (Haines and Shlomowitz Reference Haines and Shlomowitz2000; Klein et al. Reference Klein, Engerman, Haines and Shlomowitz2001).
QUANTITATIVE LITERATURE ON CROWDING AND SLAVE MORTALITY

Sources:
Author's tabulations.
This article revisits this question and demonstrates that studies finding no positive relationship between vessel crowding and Middle Passage mortality relied onunrepresentative samples of slave voyages. The true relationship is obscured by missing observations on voyage duration—a covariate almost universally included in studies of slave mortality.Footnote 3 If the “missingness” of voyage duration is related to the correlations between variables of interest, dropping the incomplete observations will bias estimates of the relationship between crowding and mortality.
Studies seek to control for voyage duration in regressions so that they can understand the effect of vessel crowding, holding voyage duration constant. The longer a vessel was at sea, the greater risk of death from starvation, drowning, or infectious disease (Galenson Reference Galenson1986, chap. 2). Within the Trans-Atlantic Slave Trade Database, 89 percent of all slave voyages lack information on the duration of the Middle Passage; among voyages with information on slave mortality, slave crowding, and ship size, 65 percent of voyages lack information on duration of the Middle Passage.Footnote 4 This implies that quantitative studies which control for voyage duration must omit more than half of all voyages with otherwise complete information. Using simple methods to correct for missing data on voyage duration, my analysis of the Trans-Atlantic Slave Trade Database shows a strong and robust association between crowded slave voyages and slave mortality, consistent with historical accounts.
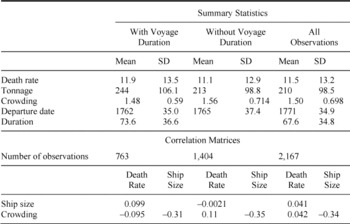
Table 2 shows that information on voyage duration is not missing at random. Specifically, the relationship between ship crowding and slave mortality depends on whether duration of the Middle Passage is observed. The top panel shows very similar means and standard deviations for key variables across three subsamples—voyages recording all variables of interest, voyages recording all variables except for Middle Passage duration, and finally all observations recording any of the variables—with slightly greater variance in crowding among the voyages with missing data.Footnote 5 The bottom panel shows that the correlation coefficient between crowding and mortality is negative (–0.10) for voyages with a recorded duration, but positive when duration is not observed (0.11), and positive in the combined sample (0.04).
This pattern also holds in the typical multivariate regressions used in this literature. Following David Galenson (Reference Galenson1986, pp. 42–47),Footnote 6 I use ordinary least squares to estimate
![\[
\begin{array}
\[Mortalit{y_i} = {\beta _0} + {\beta _1}Crowdin{g_i} + {\beta _2}Tonnag{e_i} + {\beta _3}Duratio{n_i} + {\psi _{route\left(i \right)}} + {\phi _{decade\left(i \right)}} + {\varepsilon _i},\]
\end{array}
\](https://static.cambridge.org/binary/version/id/urn:cambridge.org:id:binary:20160927091142808-0862:S0022050714000357:S0022050714000357_eqn1.gif?pub-status=live)
SUMMARY STATISTICS AND CORRELATIONS BY SUBSAMPLES

Notes:
All panels have observed values for vessel name, shipping route, and shipping decade. Voyages which do not successfully complete a voyage on an Atlantic trading route are dropped. “All candidate observations” includes voyages that do not have observed values for vessel capacity, mortality rate, slave crowding, or middle passage duration; the other five panels only include the 2,167 observations that are not missing mortality rate, ship tonnage, or crowding. See Appendix Table 7 for construction of individual variables.
where Mortality is the mortality rate for voyage i, Crowding is the number of embarked slaves per shipping ton, Tonnage is the carrying capacity of the ship in English shipping tons, and Duration is the number of days on the Middle Passage.Footnote 7
Unobserved differences in the slave trade over time and across regions are controlled for using decade and trade route fixed effects. The Atlantic economy and trading practices both changed over the centuries of the transatlantic slave trade's existence (Carlos Reference Carlos1991, Reference Carlos1994; Steckel and Jensen Reference Steckel and Jensen1986; Klein and Engerman Reference Klein, Engerman, Eltis and Richardson1997; Haines and Shlomowitz Reference Haines and Shlomowitz2000; Whatley and Gillezeau Reference Whatley, Gillezeau, Rhode, Rosenbloom and Weiman2011). The mortality effects of these and other unobserved events are captured by decade fixed effects (ϕ decade(i) ). The literature has also established substantial variation in mortality across regions of embarkment and disembarkment (Haines, McDonald, and Shlomowitz Reference Haines, McDonald and Shlomowitz2001). The regression includes dummy variables to control for unobserved effects of the trade route (ψ route(i) ).Footnote 8 Standard errors are clustered by ship name to correct for nonindependence of voyages on the same vessel.
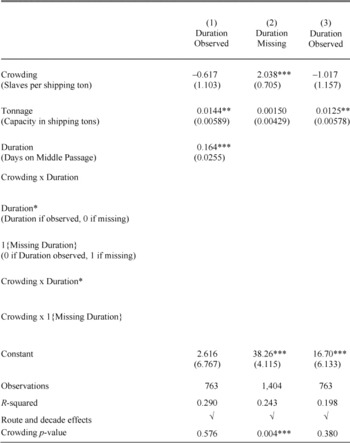
MULTIVARIATE REGRESSION OF SLAVES’ MIDDLE PASSAGE MORTALITY RATE ON VOYAGE CHARACTERISTICS

*** p < 0.01.
** p < 0.05.
* p < 0.1.
Notes:
Standard errors in parentheses corrected for an arbitrary covariance structure by ship. In columns 6 and 7, estimates and errors are corrected for imputation bias using multiple random imputation (50 iterations). Crowding p-value is for Crowding variable alone in columns 1–4 and 6, and for a joint test of Crowding and interaction terms in columns 5 and 7. The R-squared presented in columns 6 and 7 is for an ordinary regression using the 50th imputation of Duration.
Column 1 of Table 3 reports regression coefficients for the subsample of the data with recorded values for Duration.Footnote 9 Consistent with the literature, the relationshipbetween crowding and mortality is statistically indistinguishable from zero. But this result is driven by the sample: columns 2 and 3 repeat the regression without the voyage duration variable. In column 2, which uses only voyages with unobserved duration, the relationship between crowding and mortality is positive and statistically significant. All else equal, within this sample we would expect a one-standard-deviation increase in crowding (0.714 slaves per shipping ton) to be associated with an increase in mortality of 1.46 percentage points, or 0.11 standard deviations. Column 3 repeats this regression for the sample with observed duration, and obtains an even larger negative pointestimate on Crowding, so controlling for voyage duration is not the reason for not finding a positive coefficient on Crowding in column 1.
We can analyze the relationship between crowding and mortality in the whole sample while controlling for duration using two different missing data methods: the missing-indicator method and imputation analysis. Both approaches find a positive and statistically significant relationship between crowding and mortality, of similar and meaningful magnitudes.
First, I add two separate duration controls for observed and unobserved cases to the regression: a continuous variable equal to Duration when passage time is observed and zero when it is not, and a dummy variable equal to one if Duration is missing and zero if it is observed.Footnote 10 More precisely, I estimate
![\[
\begin{array}
\[Mortalit{y_i} = {\beta _0} + {\beta _1}Crowdin{g_i} + {\beta _2}Tonnag{e_i} + {\beta _3}Duration_i^* + {\beta _4}1\left\{{Duratio{n_i}\,{\rm{missing}}} \right\} + {\beta _5}\left\{{Crowdin{g_i}*Duration_i^*} \right\} + {\beta _6}\left({Crowdin{g_i}*1\left\{{Duratio{n_i}\,{\rm{missing}}} \right\}} \right) + {\psi _{route\left(i \right)}} + {\phi _{decade\left(i \right)}} + {\varepsilon _i}\]
\end{array}
\](https://static.cambridge.org/binary/version/id/urn:cambridge.org:id:binary:20160927091142808-0862:S0022050714000357:S0022050714000357_eqn2.gif?pub-status=live)
where 1{Durationi missing} is equal to 0 if Duration is observed and 1 if Duration is missing, and Duration i * is defined
![\[
\begin{array}
\[Duration_i^*\left\{{\begin{array}{*{20}{c}}
{Duratio{n_i},}&{if\,Duratio{n_i}\,is\,observed}\
{0,}&{if\,Duratio{n_i}\,is\,{\rm{missing}}}
\end{array}} \right.\]
\end{array}
\](https://static.cambridge.org/binary/version/id/urn:cambridge.org:id:binary:20160927091142808-0862:S0022050714000357:S0022050714000357_eqnU1.gif?pub-status=live)
The coefficient β3 captures the correlation of duration and mortality when duration is observed, while β4 captures the relationship with unobserved duration.
Much of the literature argues that slave mortality was affected by crowding and voyage duration in a nonlinear manner—more crowded voyages may have exhausted food supplies sooner, experiencing rising mortality late in the voyage (Cohn and Jensen Reference Cohn and Jensen1982; Galenson Reference Galenson1986), or more crowded voyages may have spent longer embarking slaves at the African coast, increasing the risk of a disease outbreak in the early part of the voyage (Steckel and Jensen Reference Steckel and Jensen1986; Haines, McDonald, and Shlomowitz Reference Haines, McDonald and Shlomowitz2001). I add interaction terms between crowding and the two duration variables to capture these relationships. β5 estimates the association between mortality and the interaction of Crowding with Duration i *; β6 estimates the association between mortality and the interaction of Crowding with 1{Durationi missing}.
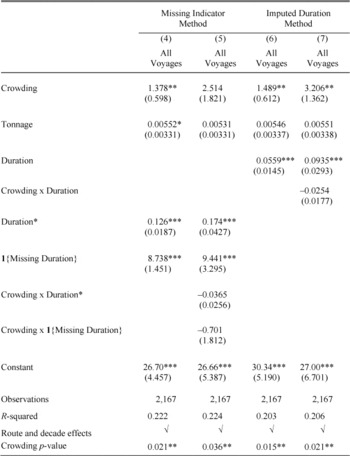
The regression is tabulated without interactions in Table 4, column 4, while column 5 includes the interaction terms. In column 4, the coefficient on Crowding is positive and statistically significant at the 5 percent level; an increase of one standard deviation (0.78 slaves per shipping ton) is associated with an increase of 1.1 percentage points in mortality rate in the pooled sample. When interaction terms are added, the Crowding coefficient remains large and positive, though the implied change in mortality of a marginal increase in crowding, for a voyage with a typical observed duration, becomes small.Footnote
11
A joint test in column 5 finds that the coefficients on Crowding and both interaction terms  are jointly different from zero at the 5 percent significance level. The negative coefficients on the interaction terms
 are consistent with the literature finding nonlinear mortality rates driven by preboarding conditions.
I examine the robustness of these findings using imputation analysis. Where Duration is unobserved, I impute a value by regressing Duration all the other variables in equation 1 as regressors.Footnote 12 I use imputed values to estimate
![\[
\begin{array}
\[Mortalit{y_i} = {\beta _0} + {\beta _1}Crowdin{g_i} + {\beta _2}Tonnag{e_i} + {\beta _3}Duratio{n_i} + {\beta _5}\left\{{Crowdin{g_i}*Duratio{n_i}} \right\} + {\psi _{route\left(i \right)}} + {\phi _{decade\left(i \right)}} + {\varepsilon _i}\]
\end{array}
\](https://static.cambridge.org/binary/version/id/urn:cambridge.org:id:binary:20160927091142808-0862:S0022050714000357:S0022050714000357_eqn3.gif?pub-status=live)
Columns 6 and 7 of Table 4 present results from this estimation. Consistent with the missing-indicator results from columns 4 and 5, the coefficient on Crowding is statistically significant at the 5 percent level in both specifications, and point estimates are similar across specifications in columns 4 and 6 (1.489 using imputation compared to 1.378), and columns 5 and 7 (3.206 compared to 2.514). Like the missing-indicator results, imputation methods also estimate a negative coefficient on the interaction of Crowding and Duration. The coefficients on Crowding and on the interaction term  are jointly significant at the 5 percent level in column 7.
MULTIVARIATE REGRESSION OF SLAVES’ MIDDLE PASSAGE MORTALITY RATE ON VOYAGE CHARACTERISTICS

*** p < 0.01.
** p < 0.05.
* p < 0.1.
Notes:
Standard errors in parentheses corrected for an arbitrary covariance structure by ship. In columns 6 and 7, estimates and errors are corrected for imputation bias using multiple random imputation (50 iterations). Crowding p-value is for Crowding variable alone in columns 1–4 and 6, and for a joint test of Crowding and interaction terms in columns 5 and 7. The R-squared presented in columns 6 and 7 is for an ordinary regression using the 50th imputation of Duration.
OBSERVED DURATION AND DISTRIBUTION OF CROWDING BY DECADE

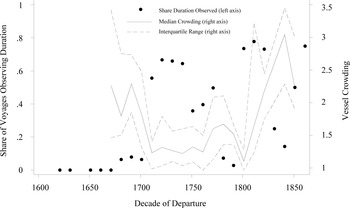
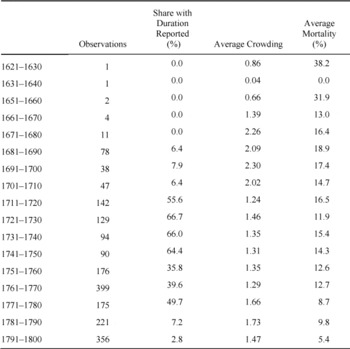
Crowding, it seems, was associated with higher mortality—at least when voyage duration is not observed. Figure 1 charts the share of voyages with observed Duration and the distribution of Crowding by decade of departure from Europe. Of the 763 observations with observed Duration, 593 are from the period 1711–1780 when there were very few highly crowded voyages in the data set. In contrast, the periods before 1711 and after 1780 have more tightly packed voyages, yet a lower share of voyages with observed duration.Footnote 13 Almost all observations prior to 1710 are incomplete, as are a majority of voyages from 1751–1800 and after 1830.Footnote 14
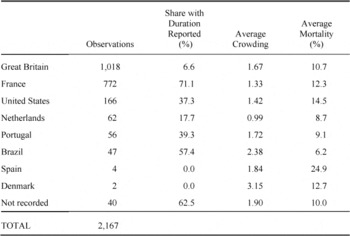
Changes in national composition over time explain part of this pattern: France and Great Britain are the two largest contributors of complete observations to the data set;Footnote 15 during the 1781–1800 period, both experienced radical change in their slave trade industries, as the 1788 Dolben's Act imposed the first regulations on the British trade, while in 1789 the detailed French voyage data ended with the Revolution.Footnote 16 Omitting voyages without recorded duration means ignoring most of the voyages affected by Dolben's Act—of 389 British voyages in the sample departing after 1788, only nine record voyage duration—as well as almost all voyages departing before 1710.
An examination of a broader subset of voyages than previous studies finds a positive correlation between slave crowding and mortality in the Middle Passage, consistent with historical accounts. This result holds both for simple correlations and for incomplete data regressions. Using partially incomplete observations allows the analysis to consider not only a larger sample, but a sample that includes many more voyages during the earliest decades of the slave trade and after 1788, when slave voyages were least likely to record Middle Passage voyage duration and more likely to be highly crowded. Determining the economic motivations and other factors that would have led some voyages, but not others, to create and preserve records of their voyage duration is a question for future research.
Appendix
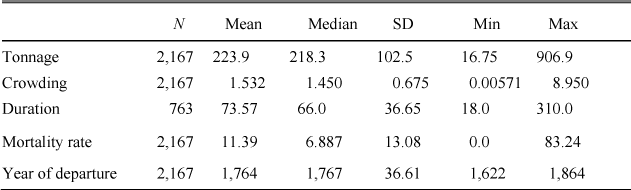
SUMMARY STATISTICS FOR FULL SAMPLE

OBSERVED VOYAGE DURATION BY DECADE

OBSERVED VOYAGE DURATION BY NATION OF REGISTRATION

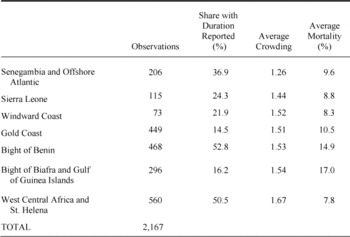
OBSERVED VOYAGE DURATION BY EMBARKMENT REGION

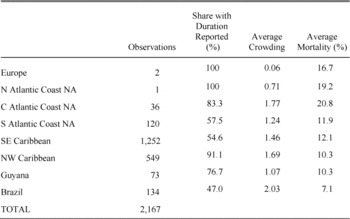
OBSERVED VOYAGE DURATION BY DISEMBARKMENT REGION

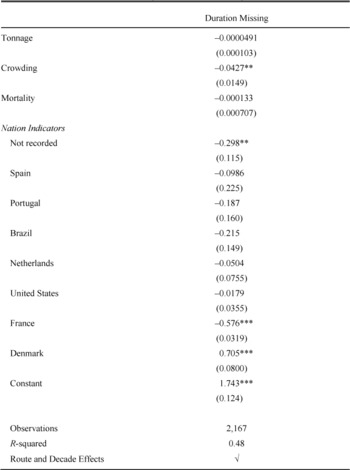
LINEAR PROBABILITY MODEL: 1{DURATION MISSING} ON OTHER VARIABLES

PROPORTION OF VOYAGES WITH OBSERVED DURATION BY NATION
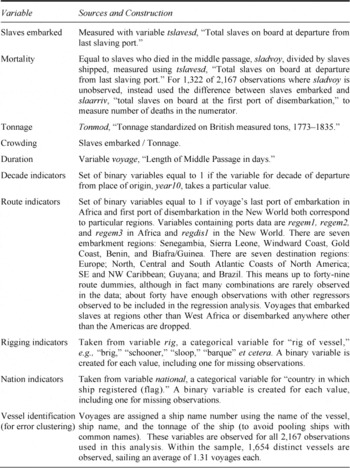
DATA SOURCES AND VARIABLE CONSTRUCTION

 which is approximately equal to 2.51 −0.0365*73.6 = −0.18 in column 5 and 2.59 −0.0312 * 73.6 = +0.29 in column 6. For a one-standard-deviation increase in crowding (0.59 slaves / ton), these translate into modest mortality changes of −0.11 and +0.18 percentage points, respectively.
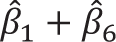 is 1.81 in column 5, implying that a one-standard- deviation increase in crowding (0.71 slaves/ton) on a voyage without observed voyage duration would have a mortality rate increase of about 1.3 percentage points,.