“The proposed [voter ID] law puts up barriers to voting that will trap honest voters in confusion and discourage them [...].”
– Roy Cooper, Governor of North Carolina (2018)Footnote 11. Introduction
A growing number of states have enacted laws that require voters to show photo identification (ID) to cast a ballot.Footnote 2 Meanwhile, a flurry of legal challenges and scholarly analyses have sought to estimate the effect of the voter ID laws. Do strict ID laws deter voters from turning out, and if so, how? In this paper, we demonstrate that photo ID laws differentially deter voters without state identification, relative to voters with identification, while in place and continue to differentially deter voters even after those laws are repealed. The differential deterrent effect for individuals without state ID occurs while the law is in effect both because voters without a state ID are deterred from voting once they arrive at the polls, what we call a mechanical effect, and because voters without state ID decide to not turnout at all, a differential deterrent effect. Once the law is removed, the differential deterrent effect can persist because voters without ID may be unaware of the requirements for voting have changed.
To assess the persistent deterent effect of voter ID laws, we use administrative data from North Carolina and exploit variation in a photo ID law that was in effect for the 2016 primary election but not the 2016 general election and beyond. The North Carolina legislature passed a law in 2013 requiring photo ID to vote starting in the 2016 primary election. To inform voters of the law change, the North Carolina State Board of Elections (NCSBE) sent a mailer to all voters who lacked a state-issued ID (about 3 percent of registrants in North Carolina), informing them that photo identification would be required to vote. To assess the effect of this law, we use exact matching on a variety of individual characteristics, including turnout history prior to the ID law, and a difference-in-differences design, to find that the strict photo voter ID caused a 0.7 percentage point decline in turnout in the primary election among those who did not match to a state-issued ID, compared to those who did have state ID. After the primary election in July 2016, an appellate court overturned the photo ID law, removing the requirement for photo identification to vote. But there was no subsequent letter sent to inform voters that photo identification was no longer required.
The change in the law without notifying voters created confusion about what was necessary to vote and as a result the effect of the ID law persisted after the law was repealed. Even though the ID law was suspended, individuals without a state-issued ID were 2.6 percentage points less likely to turnout in the 2016 general election than voters with ID. This effect persisted beyond the 2016 election, though the magnitude of the effect decreased: in the 2018 general election, individuals without valid identification were 1.7 percentage points less likely to turnout and there was no deterrent effect in the primary election. This pattern is consistent with the change in laws sowing confusion: the effect is concentrated among voters who participated occasionally in prior elections and have a low probability of participating in primaries.
The persistent effect of voter ID laws demonstrates the need to revisit common research designs used to assess the effect of voter ID laws. To assess the effects of voter ID laws, scholars compare turnout in states that have voter ID requirements with those that do not, using either aggregate state-level turnout or self-reported turnout data (Erikson and Minnite, Reference Erikson and Minnite2009). Some designs have found no effect on turnout (Mycoff et al., Reference Mycoff, Wagner and Wilson2009; Hood and Bullock, Reference Hood and Bullock2012; Highton, Reference Highton2017; Cantoni and Pons, Reference Cantoni and Pons2019), while others have found negative effects on turnout (Alvarez et al., Reference Alvarez, Bailey and Katz2008; Barreto et al., Reference Barreto, Nuño and Sanchez2009; Alvarez et al., Reference Alvarez, Bailey and Katz2011; Hajnal et al., Reference Hajnal, Lajevardi and Nielson2017). Yet, if the effect of voter ID laws persists, then states that are classified as “control” states after a law is repealed will still have voters affected by the law being in place; and as a result, the most common research designs will be biased toward finding no effect.
The magnitude of the effects that we estimate also demonstrates that prior studies lack the appropriate data and statistical power to detect this effect. The voter ID law continued to deter voters, but our best estimate of the overall effect of voter ID laws on aggregate turnout is small enough to show that studies assessing the effect of voter ID laws on aggregate turnout lack the power to detect the effect of the laws. Using a simple set of assumptions to calculate the number of voters affected by the differential deterrent effect, we find the law caused approximately 5,110 individuals without identification to not vote in the 2016 general election. This accounts for approximately 0.1 percent of the total votes cast in the election. Designs that use aggregate level turnout rates or administrative data without information about who holds identification will fail to detect this change in turnout rates. And while other studies sometimes use survey research to learn who holds identification, this group is so small that it is difficult to estimate the effect with policy-relevant precision (Erikson and Minnite, Reference Erikson and Minnite2009; Grimmer et al., Reference Grimmer, Hersh, Meredith, Mummolo and Nall2018).Footnote 3
And our results suggest that debates and policy disputes about voter ID laws could dampen turnout, even when photo identification laws are removed. This has important implications for assessing turnout in states where voter ID laws are still actively debated. For example, in the wake of North Carolina's strict photo ID law being struck down in 2016, voters in North Carolina approved a ballot measure in November 2018 to amend the state constitution to require photo identification to vote.Footnote 4 While the new requirements are already the subject of pending lawsuits,Footnote 5 North Carolina Governor Roy Cooper signed a bill into law in March 2019 to delay the voter ID requirements until 2020.Footnote 6 Given the turbulent nature of debates and implementation of voter ID laws along with our findings, officials and researchers should carefully consider how these processes affect who votes, regardless of if or when these requirements are actually implemented.
2. Voter ID laws in North Carolina and their effect on voter turnout
In 2013, North Carolina passed legislation to implement a strict photo voter ID law, beginning with the 2016 election.Footnote 7 In accordance with the law, in 2015 the North Carolina State Board of Elections (NCSBE) generated a list of registered voters who did not match to a state-issued photo ID issued by the North Carolina Division of Motor Vehicles (DMV) at the time of the 2014 general election.Footnote 8 Using this list, the NCSBE sent a mailer to each of these registrants, which stated that photo ID would be needed to vote in 2016, listed resources for obtaining free photo ID, and provided a postage pre-paid response card where recipients could indicate they needed assistance in acquiring a photo ID.Footnote 9 Registered voters were required to show an acceptable form of photo ID to cast a ballot, which included a North Carolina driver's license, US passport, or US military ID card, among others. If voters were unable to present acceptable photo ID, they could cast a provisional ballot, which would only be counted if the voter took additional action after Election Day by presenting ID in person at their County Board of Elections.Footnote 10 In July 2016, after the 2016 primary but before the general election, the 4th US Circuit Court of Appeals overturned the voter ID law, citing its discriminatory intent.Footnote 11 After the ruling, the ID law was not in place for the 2016 general election. While the court ruling blocked the enforcement of voter ID laws in the general election, it did not require a new letter to voters without identification to inform them that identification was no longer required to vote.
We use variation in the voter ID law's implementation for the 2016 primary and general elections to estimate the persistent effect of voter ID laws among those who lack state ID. The effect of the North Carolina law on those without state identification combines two distinct ways the laws could deter voters: a mechanical effect that occurs at the polls and an overall deterrent effect that causes individuals to not turnout at all.
Once the law was struck down by the appellate court, the mechanical effect immediately is removed, but the differential deterrent effect remains until voters without state-issued identification learn about the change in rules about required identification. One impediment to learning about the change is that there was no official notice from the state: the appellate court struck down the law, but did not order a second letter sent to voters about the different requirements. Political campaigns or the media could provide information to voters, but this will necessarily be less likely to reach potential voters than the information from the NCSBE. For example, as we show in Appendix A.1, newspaper coverage of the voter ID law in both North Carolina and national news sources tended to occur when the appellate court decision was made, rather than immediately prior to election day when voters are most interested in the campaign.
We interpret our treatment effect as the differential effect of the law on those without state-issued identification, relative to those with a state ID. We focus on this interpretation because imposing a strict photo ID law could affect the turnout decision of all registered voters and our design is unable to address potential changes in voting behavior for individuals who hold valid identification. Individuals could be angered by the law increasing turnout among those who already hold valid identification (Valentino and Neuner, Reference Valentino and Neuner2017), campaigns might exert compensatory effort to turn out individuals with valid ID, or increased controversy around the law might cause more voters to be more interested in the election. Our interpretation—as the differential effect of the law for those without identification—is necessarily different than the policy question of what turnout would have been if the voter ID law had never been put in place. As we explain below, we can impose plausible and transparent assumptions about the broader effect of the law to generate estimates for this different policy question. And our results provide important insights into who is deterred when the law is put into place.
Measuring Who Holds Identification
To measure who lacks a state-issued ID, we combine administrative data from North Carolina voter files—which includes information on a voter's address, age, race, and turnout history in every primary and general election from 2008 to 2018—with individual-level administrative data on who possesses a state-issued ID.Footnote 12 We use the unique identifier the NCSBE generated to identify voters without identification, which we use to merge to the voter file to measure an individual's lack of ID.
Our measure of who might lack photo ID, then, is the list of voters who the NCSBE identified as possibly lacking ID through this matching process. We discuss possible sources of measurement error in Appendix Section A.2 and show that the measure error from this matching is likely to be small.
Table 1 shows descriptive statistics for the full voter file compared to registrants who do not match to an ID. About 3.0 percent of registrants fail to match, indicating that they might lack adequate ID to vote under the strict ID law. The composition of registrants without ID differs from the full voter file: those lacking ID have lower turnout on average, and they are more likely to be non-white as well as registered Democrats. The standard deviation of birth year is also larger among those without ID, which comports with previous survey work showing those who lack ID often tend to be young or elderly (e.g., Stewart, Reference Stewart2013).
Descriptive statistics, individual level, 2008–2018

The unit for voted an individual-year. Panel A presents descriptive statistics for the full file of North Carolina voters registered as of the 2014 general election. In this panel, every observation is a voter within an election period. Panel B presents descriptive statistics for the individuals in the voter file who do not match to a DMV identification record.
We also rely on individual-level data from the NCSBE on which voters cast a provisional ballot. Not only can we observe whether a provisional ballot was cast and ultimately counted, but we can also observe the stated reason for needing to cast a provisional ballot. We use this to estimate the mechanical effect of the voter ID law—that is, how many voters are turned away at the polls for lack of ID on Election Day.
3. Strict photo ID laws decrease turnout among those without ID while in effect
In this section, we show that North Carolina's voter ID law decreased turnout among those without state ID. In our most stringent specification, the ID law decreased turnout by about 0.7 percentage points among those without ID. This decrease comes both through the differential deterrent effect and through a mechanical effect where voters without ID are turned away at the polls on Election Day. This is consistent with voters who lack identification knowing, based on the letter they received, that they would be turned away at the polls because they lack identification and be unable to vote.
3.1 Evidence for a mechanical effect
First, we estimate the mechanical effect of the voter ID law, where a voter shows up to the polls intending to cast a ballot but does not have their vote counted because they do not meet the requirements of the new ID law. This mechanical effect can only plausibly decrease the turnout rate (Fraga and Miller, Reference Fraga and Miller2018; Henninger et al., Reference Henninger, Meredith and Morse2018), where voters show up to the polls but are challenged to present appropriate ID and fail to do so.Footnote 13 In North Carolina, this mechanical effect is present in the 2016 primary, the only election for which the voter ID law is actually in place.Footnote 14 To estimate the mechanical effect, we subset to provisional ballots that were ultimately rejected, and in Figure 1, we plot the share of provisional ballots cast by reason for each election.Footnote 15 The figure on the left shows provisional ballots for primary elections, while the figure on the right shows them for general elections. In each year, the vast majority of provisional ballots are cast because potential voters are not found as being registered. Provisional ballots that were rejected for lack of ID account for a very small share of rejected ballots, even in the 2016 primary, where they comprised less than 10 percent of rejected ballots. Overall, a total of 1169 provisional ballots were rejected for lack of ID in the 2016 primary election, approximately 0.05 percent of the 2,332,428 total votes cast statewide in that election.
Reasons for provisional ballots. The left panel plots the share of provisional ballots cast for different reasons in primary elections. The right plots the same series for general elections. The blue line indicates the share of provisional ballots cast because the voter lacked proper ID. The only election for which the ID law was in effect was the 2016 primary, where about 10 percent of provisional ballots were cast for lack of ID.

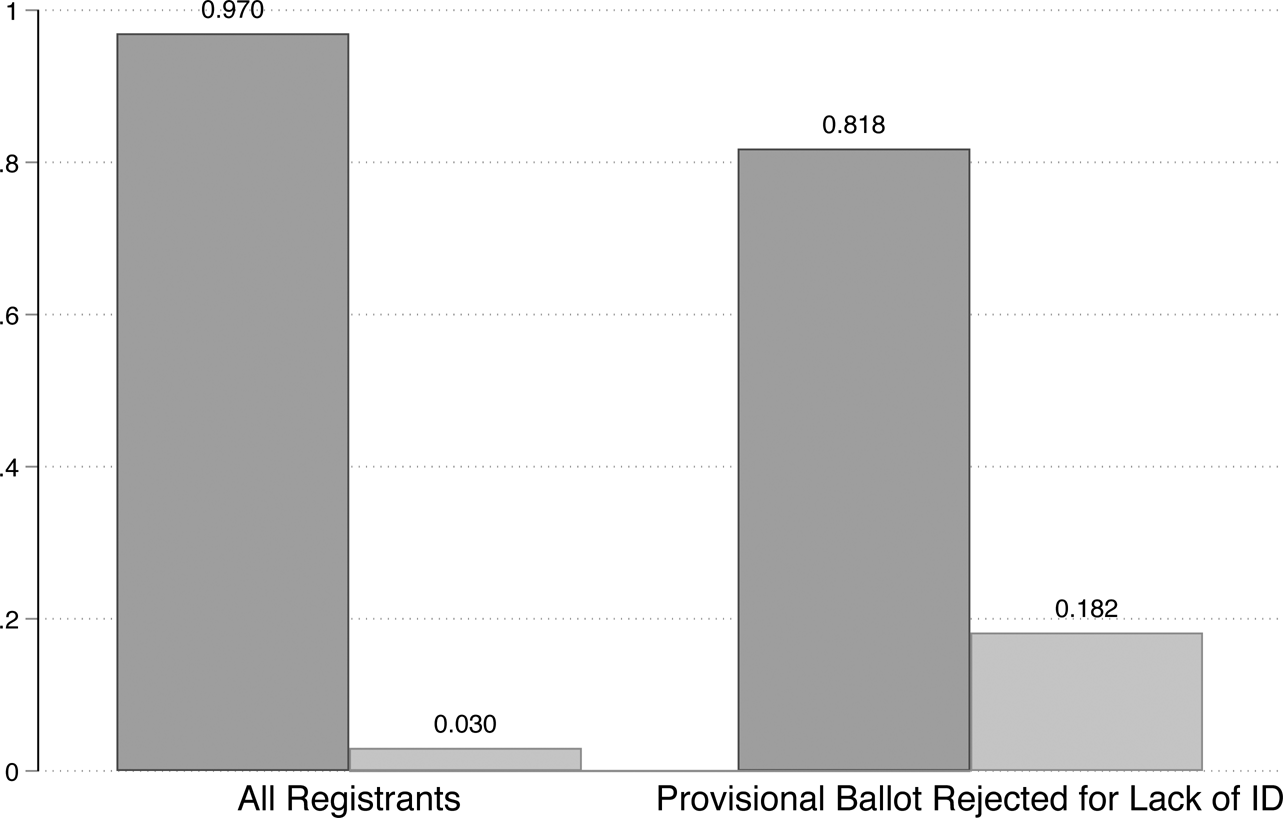
How many of these provisional ballots rejected for lack of ID come from individuals who do not match to a state ID? In Figure 2, we plot the share of individuals who fail to match to a state ID, first for all registrants on the left and then for provisional balloters on the right. Light grey bars indicate individuals who lack ID, and dark grey bars indicate individuals who have ID. The light grey bar on the right shows that of the 1,169 provisional ballots that were rejected of lack of ID, about 18.2 percent of them were identified as lacking ID. This rate of 18.2 percent is much higher than the rate among all registrants of 3.0 percent, meaning the mechanical effect censors out individuals who lack ID at a much higher rate than those who have ID. However, the other 81.8 percent of provisional balloters actually linked to a state ID. This suggests that many rejected votes come from individuals who hold a valid ID, likely because they forgot their photo ID on Election Day.
DMV match status: comparing registrants to provisional balloters. The light grey bars indicate individuals who lack ID, while the dark grey bars indicate individuals who match to a DMV-issued ID. We plot these proportions separately for all registered voters on the left and for those who cast a provisional ballot in the 2016 primary election but had it rejected because they failed to present adequate ID.

3.2 Evidence for a deterrent effect
Next, we estimate the deterrent effect of the voter ID law, which yields conflicting theoretical predictions. On one hand, voters without state ID might abstain from voting because they infer—correctly or incorrectly—that they do not have adequate ID to vote and are not willing to pay the costs of acquiring acceptable ID.Footnote 16 On the other hand, the voter ID law might anger or otherwise motivate voters, making them more likely to overcome the law by obtaining valid identification and participation (e.g., Claibourn and Martin, Reference Claibourn and Martin2012; Valentino and Neuner, Reference Valentino and Neuner2017).
To estimate the differential deterrent effect of the ID laws, we estimate equations of the form

where Turnout it is an indicator for whether individual i turns out to vote in the election at time t. The variable $\rm {No\, DMV\, Match}_i \ \ast \ 2016$ is an indicator for whether individual i does not match to photo ID and the election year is 2016, the year the voter ID law goes into effect. We include individual and year fixed effects, modeled by γi and δt, respectively.Footnote 17 This is a difference-in-differences design, which relies on the common trends assumption. For this to be satisfied, it must be that the change in turnout behavior for treated units (those without state ID) would have been the same as control units (those with state ID), had they not been treated. There are likely many differences between those who have a state-issued ID and those who do not, and these differences might drive changes in turnout behavior. Specifically, the main concern for our design is that there are compositional differences between those who have a state ID and those who do not, as we show in Table 1. Voters without state ID are more likely to be Democrats, minorities, not middle-aged, and have low-turnout in prior elections. If trends in turnout behavior are different on the basis of any of these compositional differences, this would bias the estimate in Equation (1). After showing results from the simplest version of the difference-in-differences design, we employ a number of strategies to adjust for these compositional differences and make the common trends assumption more plausible.
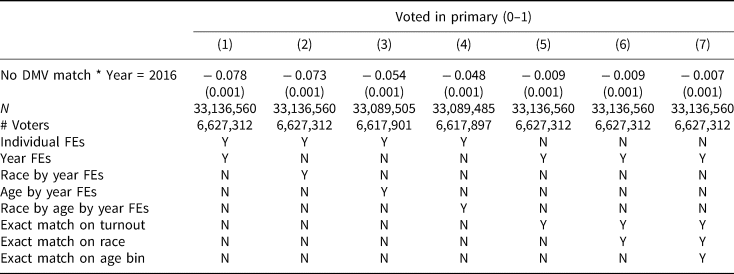
Table 2 shows the effect of the voter ID law on primary election turnout. In column 1, we estimate Equation (1), simply including individual and year fixed effects. This specification, therefore, estimates the counterfactual turnout trends for those without ID using all voters with ID. The estimate suggests that the voter ID law caused a 7.8 percentage point decline in primary election turnout among those without ID relative to those with ID. We have a reason to be skeptical of this baseline specification. Because there are many observable differences between those who have photo ID and those who do not, the two groups are likely to have different turnout trends. As a first way to address this, in columns 2, 3, and 4, we include race-by-year, age-by-year, and race-by-age-by-year fixed effects, respectively. This means that in column 4, for example, we compute counterfactual trends for individuals without ID using only voters with ID that are the same age and race. The point estimate in column 4 shrinks substantially to a 4.8 percentage point decline in primary turnout among those without ID.
Effect of voter ID law on primary election turnout among those without ID, individual level, 2008–2016

Robust standard errors clustered by individual in parentheses. Main effects for No DMV Match and 2016 are absorbed by fixed effects. Exact matching on turnout matches units based on all primary and general elections from 2008 to 2014. For exact matching on age, we construct a separate age bin for each group of voters who were under 18 for a given set of elections, so the cohort of voters who became newly eligible to participate in 2010, 2012, 2014, and 2016 each have their own age bin. For voters who were eligible for all elections since 2008, we construct age deciles.
Trends in turnout behavior, however, still might be different among those with and without ID, even within age and racial group. In fact, we can show some evidence for this: in Figure A.3 in the Appendix, we plot the mean turnout rate in each primary and general election from 2008 to 2016 separately for those who have and do not have ID, including race by birth year fixed effects. Even within race and birth year, those who do not have photo ID have slightly different turnout trends in the pre-treatment period (2008–2014) than those who have ID.Footnote 18
To make the common trends assumption more plausible, we exactly match individuals on the basis of their pre-treatment turnout history. This constructs a control group more likely to provide accurate counterfactual trends because we constrain the trends to be the same in the pre-treatment periods. We have pre-treatment turnout history for every voter from every primary and general election in 2008, 2010, 2012, and 2014. This means that we can put each voter into one of 28 = 256 unique pre-treatment turnout histories. For every individual without a state-issued ID, we can find control units with the same pre-treatment turnout history. In column 5 of Table 2, we implement this exact matching design, where we average the differences in 2016 primary turnout among those without ID and those with ID for each of these turnout histories, weighting the estimate by the number of treated observations in each bin. After exact matching voters on their pre-treatment turnout, we find that the voter ID law caused about a 0.9 percentage point decline in turnout among those without ID. For the specifications where we carry out the exact matching, we do not include individual fixed effects. Individual fixed effects are no longer necessary because, within each turnout history bin, there is no difference in turnout between treated and control units in the pre-period. In columns 6 and 7, we further refine the exact match. In column 6, we exact match on turnout history and race. In column 7, our most stringent specification, we exact match on turnout history, race, and age decile; we find that the voter ID law caused a precisely estimated 0.7 percentage point decrease in turnout among those without ID.Footnote 19
3.3 Voter file purges and sample selection
One concern with using voter files for these types of analyses is that their composition changes over time. Voter file purges could bias our estimates of the effect of the voter ID law. For example, if voter ID laws decrease participation among those without ID, and participation influences a voter's likelihood of being purged from the voter rolls, we would be inducing bias if we were to condition on those who remain in the voter file through 2018 (e.g., Nyhan et al., Reference Nyhan, Skovron and Titiunik2017). For this reason, we limit our sample to those who were registered pre-treatment—those who were registered as of the 2014 general election. This is also the voter file snapshot that the North Carolina State Board of Elections used to match voters to their DMV records, so by limiting our sample to this set of voters, we know that the voter was included in the state's ID matching procedure. We do not include those who newly registered after the 2014 general election in our analysis because they were not included in the state's ID matching, so we do not observe their ID holding status.
Our sample selection presents one source of measurement error in individuals’ voting histories. Imagine a voter who newly registers in 2012, for example. We code this as not having voted in all elections prior to their registration. It could be, however, that the voter moved in from out of state and had indeed been voting in another state. In that case, we would incorrectly be coding this voter as not having voted in elections prior to 2012, when in fact they had been. To circumvent this potential source of measurement error, in Section A.7 of the Appendix, we estimate the deterrent effect of the ID law, but we limit the sample only to those who were registered to vote in North Carolina prior to 2008. These are voters for which we can be sure that there is no measurement error in their turnout history because they are registered throughout our entire panel. The deterrent effects of the ID law among these long-time registrants are smaller in magnitude compared to our estimates using the full sample, but they are still negative and substantively meaningful.
3.4 The deterrent effect of the voter ID law persisted even after the law was overturned
North Carolina's voter ID law was overturned in July 2016, about three months before the 2016 general election. As a result of the appellate court striking down the law, the mechanical effect necessarily goes to zero. But, as discussed above, voters might incorrectly believe that an ID is still required to vote in the general election, resulting in the law still exerting a differential deterrent effect on voting on individuals without identification.
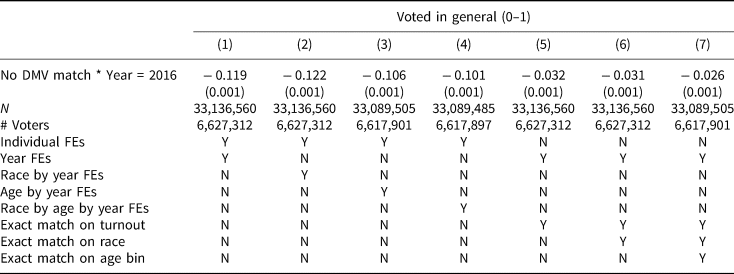
To investigate this differential deterrent effect, in Table 3, we estimate the effect on turnout of not having ID for the 2016 general election. Each column mirrors the specification described in Table 2, except that the outcome is now voting in the general election. For brevity, we focus on our most stringent specification (column 7), where we use exact matching on turnout history, race, and age.
Effect of voter ID law on general election turnout among those without ID, individual level, 2008–2016

Robust standard errors clustered by individual in parentheses. Main effects for No DMV Match and 2016 are absorbed by fixed effects. Exact matching on turnout matches units based on each primary and general election from the 2008 primary through the 2014 general. For exact matching on age, we construct a separate age bin for each group of voters who were under 18 for a given set of elections, so the cohort of voters who became newly eligible to participate in 2010, 2012, 2014, and 2016 each have their own age bin. For voters who were eligible for all elections since 2008, we construct age deciles.
In this most stringent specification, we find that voters without a state ID were 2.6 percentage points less likely to vote in the 2016 general compared to individuals with a state ID. The deterrent effect of the law persisted after the law was struck down and the effect of the law increased in size. This increase, however, reflects the higher participation rate in general rather than primary elections. In 2016, for example, 36 percent of registered voters participated in the primary election, while 69 percent participated in the general election. Therefore, this increase in size reflects the higher baseline rate of vote propensity in North Carolina elections.
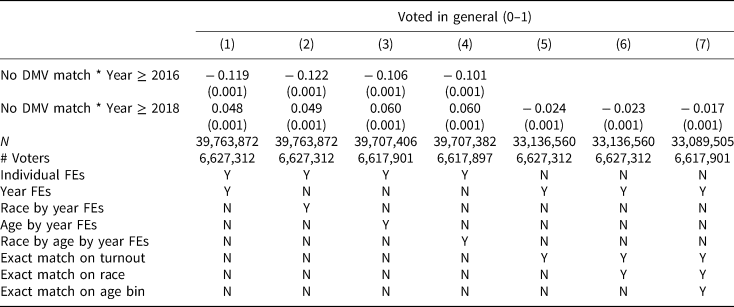
To assess how the differential effect persists, we estimate the effect of not holding identification on turnout in the 2018 primary (Table 4) and the 2018 general election (Table 5). Again, focusing on our most stringent specification (column 7 in both tables) we find that there was essentially no differential effect in the 2018 primary election—with those without identification only 0.1 percentage point less likely to turnout. But in the 2018 general election, those without identification were 1.7 percentage points less likely to vote. This 35 percent reduction in magnitude compared to the effect in the 2016 general election is consistent with voters’ confusion about what is necessary to vote dissipating, but the smaller effect in 2018 could also simply reflect lower rates of turnout in midterm elections.Footnote 20
Effect of voter ID law on primary election turnout among those without ID, individual level, 2008–2018

Robust standard errors clustered by individual in parentheses. Main effects for No DMV Match and 2016 are absorbed by fixed effects. Exact matching on turnout matches units based on each primary and general election from the 2008 primary through the 2014 general. For exact matching on age, we construct a separate age bin for each group of voters who were under 18 for a given set of elections, so the cohort of voters who became newly eligible to participate in 2010, 2012, 2014, and 2016 each have their own age bin. For voters who were eligible for all elections since 2008, we construct age deciles.
Effect of voter ID law on general election turnout among those without ID, individual level, 2008–2018

Robust standard errors clustered by individual in parentheses. Main effects for No DMV Match and 2016 are absorbed by fixed effects. Exact matching on turnout matches units based on each primary and general election from the 2008 primary through the 2014 general. For exact matching on age, we construct a separate age bin for each group of voters who were under 18 for a given set of elections, so the cohort of voters who became newly eligible to participate in 2010, 2012, 2014, and 2016 each have their own age bin. For voters who were eligible for all elections since 2008, we construct age deciles.
3.5 Interpretation of the voter ID law's effect
Interpreting these results requires caution. We estimate the differential deterrent effect, which is not estimating how overall turnout change in North Carolina as a result of the voter ID law. Instead, it is the differential effect on turnout for those without a state-issued ID relative to those with a state-issued ID. It is possible that the voter ID law could have depressed turnout among all voters, regardless of ID holding status, if voters that did have ID were also confused about the new requirements to vote. Alternatively, it could be that the voter ID law increased overall turnout among all voters if they were angered or otherwise motivated to vote because of the new requirements (e.g., Valentino and Neuner, Reference Valentino and Neuner2017). The quantity we estimate captures the effect of the ID law on turnout among those without ID relative to those with ID. We believe that, given the compositional differences between the types of voters with and without ID, this theoretical quantity is interesting and important. Later, we estimate the effect of the voter ID law on overall turnout in North Carolina. To do so, we use our estimated mechanical effects for individuals with and without valid ID as well as our differential deterrent effect; but calculating the overall effect of the law on turnout requires an additional assumption that the law has no deterrent effect among those who have ID, an effect not identified by our design.
4. Who is deterred by the ID law?
In this section, we evaluate which types of voters are most likely to be deterred by the voter ID law. We find that not holding identification has the biggest effect for occasional voters, with only small effects for voters who rarely turned out in prior elections or who participated in all prior elections. We also find that the effect of the voter ID law does not vary substantially by race or by party, but this does not imply that there is not a disproportionate burden for minorities or democrats. Although the effect of not holding identification does not differ from members of different racial groups or partisans, voter ID laws do disproportionately burden Democrats and racial minorities because they are less likely to hold photo identification (see Table 1).
4.1 Voter ID laws mostly deter occasional voters
To examine how the effect varies based on turnout history, we construct strata of treated and control units based on the total number of times a voter casted a ballot in primary and general elections before the law was implemented. The strata that we use for this analysis are similar to the strata we use in our exact matching design, except for ease of presentation we merely count the number of primary and general elections an individual had participated in previously, rather than differentiating based on which primary or general elections the individual had participated in. In Table A.5, we estimate the difference in primary turnout among those without ID and those with ID in the 2016 primary election in each of the turnout strata, and in Table A.6, we estimate the difference in each strata, but for general election turnout.
For brevity, we do not review the estimation procedure here, but instead do so in detail in Section A.8 of the Appendix. But, to summarize, we show the voter ID law did not seem to deter low propensity or high propensity voters without state-issued ID relative to those with ID. Instead, the voter law deterred voters without ID who participated only occasionally before the law went into effect.
4.2 The effect of the law does not vary by race or party, but there is still a deterrent effect for minorities anddemocrats
Perhaps one of the most important legal questions about voter ID laws is assessing whether the laws impose a disproportionate burden on racial minorities. And as a public policy question, it is important to know whether the laws change the partisan composition of the election. To make this evaluation, we need to combine information about the rate groups hold valid identification for voting and how the effect of the law varies by group.
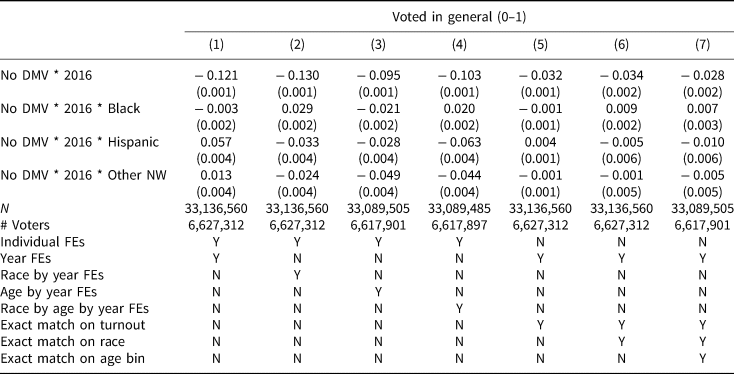
We first test for whether the effect of not holding valid identification varies depending on an individual's race and party affiliation. For brevity, we focus only on the effect in the 2016 general election, but we show the results for the 2016 primary election in Section A.9 of the Appendix. Table 6 shows the effect of the voter ID law on general election turnout by race. We interact the treatment variable, not holding valid identification, with indicators for whether the voter is listed as Black, Hispanic, and Other Non-White in the voter file. In our most stringent exact matching specification in column 7, we do not find evidence that the effect of the voter ID law on those without ID varies substantially by race, with individuals from all racial groups deterred by the law.
Effect of voter ID law on general election turnout among those without ID, individual level, 2008–2016

Robust standard errors clustered by individual in parentheses. Main effects for No DMV Match and 2016 are absorbed by fixed effects. Exact matching on turnout matches units based on all primary and general elections from the 2008 primary through the 2014 general. For exact matching on age, we construct a separate age bin for each group of voters who were under 18 for a given set of elections, so the cohort of voters who became newly eligible to participate in 2010, 2012, 2014, and 2016 each have their own age bin. For voters who were eligible for all elections since 2008, we construct age deciles.
We also investigate whether the effect of the voter ID law varies by party registration. Table A.9 shows that in our preferred specification, the effect of the voter ID law does not vary substantially by party registration.
Critically, the lack of heterogeneous effects does not imply that the voter ID laws did not affect the composition of the electorate or that they did not disproportionately deter minorities. In fact, combining the results of this analysis and the information in Table 1 suggests that minority voters and Democrats are disproportionately deterred from voting. Because minority voters are less likely to hold the required identification to vote, the homogeneous effects imply that minority voters were less likely to participate in the 2016 primary and general elections as the result of the law. Similarly, because registered Democrats were less likely to hold valid identification, they were disproportionately deterred. We demonstrate this directly in the next section, showing how many voters were deterred and how this altered the composition of the electorate.
5. Characterizing the overall effect of the ID law
Here, we incorporate our findings so far along with the composition of voters with and without ID to try to answer three questions about the effect of the voter ID law in North Carolina. First, what effect did the law have on overall turnout? Second, what was the total reduction in overall turnout by race and by party affiliation? Third, how did the voter ID law change the racial and partisan composition of the electorate?
To answer the first question, we define the overall effect as the following:

where the mechanical effect is given by the number of provisional ballots that were ultimately rejected for lack of adequate photo ID, and the deterrent effect is given by the following equation:

The deterrent effect among those who have photo ID is not identified using our research design. Our estimates in this section, therefore, assume this quantity to be equal to zero.Footnote 21 We compute the probability of not holding ID simply as the share of registrants that do not match to a DMV record (3.0 percent), and we compute the deterrent effect using the point estimates from our most stringent specifications (column 7) in Tables 2 and 3 for the primary and general elections, respectively. The overall effect of the voter ID law on primary election turnout in number of votes, therefore, is

which is about 0.116 percent of the 2016 primary electorate in North Carolina. This is consistent with Cantoni and Pons (Reference Cantoni and Pons2019), which finds small effects of voter ID laws on overall turnout using a nationwide voter file panel. Even in a large nationwide panel researchers lack the power to detect this sized effect. Similarly, the overall effect in the general election is

which is about 0.122 percent of the 2016 general electorate in North Carolina.Footnote 22
Reconciling Null and Deterrent Effects
These findings help reconcile two competing claims that can both be true. First, prior research has shown that strict voter ID laws cause a decline in turnout among those without photo ID. And second, strict photo ID laws do not cause substantively large declines in overall turnout resulting in null effects for many aggregate-level analyses. Our results show that because the vast majority of potential voters hold valid identification, the effect of the voter ID law is to deter only a small number of voters. In an aggregate setting, this number of voters is sufficiently small that there is no design, to our knowledge, with sufficient power to detect the effect on this small number of voters.
5.1 How voter ID laws change the composition of the electorate
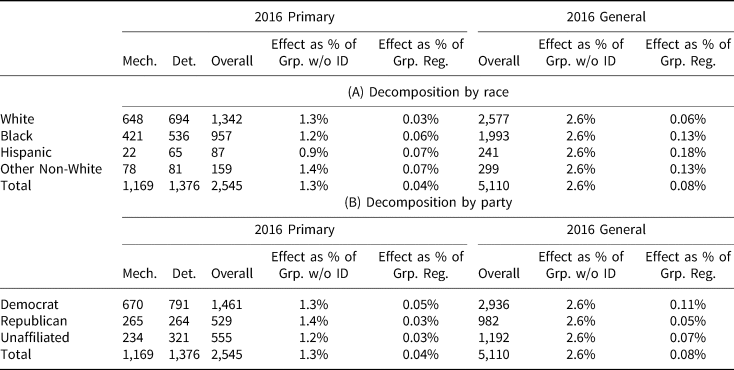
We perform similar calculations to assess how voter ID laws affect partisan and racial composition of the electorate. To do this, we decompose overall turnout effects by race and by party using the following procedure. For the mechanical effect in the 2016 primary election, we simply sum the number of voters who had provisional ballots ultimately rejected for lack of ID for each racial group and for each party affiliation. For the deterrent effect, we multiply our estimated deterrent effect (from column 7 of Tables 2 and 3, respectively) among those without ID by the total number of voters without ID who belong to each racial group and partisan affiliation.Footnote 23 Adding the mechanical effect and the deterrent effect gives an estimate of the overall vote reduction, which we summarize in Table 7. Panel A decomposes the vote reduction by race, and Panel B decomposes the vote reduction by party affiliation. For example, we estimate that in the 2016 primary election, the strict photo ID law reduced turnout among White voters by about 1,342 votes, 648 of which came through a mechanical effect and 694 of which came through a deterrent effect. We also show the overall effect as a fraction of the total number of voters in that group who lack ID, and as a fraction of the total number of registrants in that group. For example, the overall vote reduction of 1,342 votes in the 2016 primary among Whites represents about 1.3 percent of the total number of White voters without an ID, and it represents 0.03 percent of the total number of White registrants.
Vote reduction from voter ID law by race and party Affiliation

Note: Each cell presents an estimated total reduction in turnout as a consequence of the voter ID law. Panel A decomposes the effect of the voter ID law by racial group. Panel B decomposes the effect of the voter ID law by party affiliation. The first five columns decompose the effect in the 2016 primary, while the last three columns decompose the effect in the 2016 general. “Mech” represents the mechanical effect, and “Det” represents the deterrent effect. Effect as percent of Grp. w/o ID is the overall effect for the group divided by the total number of voters without ID in that group. Effect as percent of Grp. Reg. is the overall effect for the group divided by the total number of registered voters in that group. Note that the mechanical effect is zero in the 2016 general election because the law was not in effect for that election, so the deterrent effect is the same as the overall effect.
Reporting the effect as the share of registrants in that group makes the disproportionate effect of the law by race and by party clear. Looking at the 2016 general election, for example, 0.06 percent of registered White voters were deterred by the ID law, while 0.13 percent of registered Black voters were deterred by the law. This illustrates how the voter ID law can have disproportionate effects on turnout by race. Black registrants are much more likely to lack ID than White registrants, so they bear a larger burden of the turnout reduction even though the size of the effect among those without ID is not larger for Black voters than for White voters.
In Panel B, we decompose the vote reduction by party affiliation. We find that the ID law reduced turnout among Democrats by about 1,461 votes, 670 of which came from a mechanical effect and 791 of which came from a deterrent effect. As a share of the total vote reduction, Democratic registrants account for about 57.4 percent of the total vote reduction in the 2016 primary and about 57.5 percent of the reduction in the 2016 general election.
The size of the effect as a percentage of voters in that group without an ID does not vary by party. But because Democrats are much more likely to lack ID than are Republicans, Democrats shoulder a disproportionate share of the overall vote reduction as a share of total registrants. In total, 0.11 percent of registered Democrats did not vote in the 2016 general election because of the ID law, while only 0.05 percent of Republicans did not vote in the 2016 general because of the ID law.
To situate the vote reductions due to the voter ID law in a broader context, in Table A.10 in the Appendix, we add the vote reductions from Table 7—that is, the number of additional voters we estimate would have participated had the law not been passed—to the observed number of voters in each election. It shows that, because the effects among those without ID are relatively small, along with the fact that those without ID make up a small portion of the electorate, these vote reductions have only a small effect on the overall composition of the electorate, at least along racial and partisan dimensions. We reiterate, that this interpretation of the findings requires relatively strong assumptions about voter behavior in the absence of the law. Specifically, that the law had no effect on the participation decision of those with the required identification.Footnote 24
6. Conclusion
Voter ID laws are politically contentious, with Republican legislatures often implementing strict requirements, and these laws are occasionally softened or overturned as a result of legal challenges (Hicks et al., Reference Hicks, McKee, Sellers and Smith2015). How these laws affect voter turnout is an important question, but there is little empirical work on the effects of these laws that use administrative data on individual turnout over time along with a measure of which individuals actually might lack ID. And no studies have considered how the effect of the laws could remain even after the law is repealed. We leverage information in North Carolina on which voters lack photo ID to estimate the effect of North Carolina's voter ID law on turnout among those identified as possibly lacking photo ID and how the extent to which the law's effects remained in place even after an appellate court struck down the law. We find that the North Carolina voter ID law deterred voters both in the primary and general election and that this occurred both because the law mechanically made individuals unable to vote because they lacked the required identification and because the law exerted a general deterrent effect as voters inferred they would be unable to vote and therefore declined to turnout at all.
These findings also help reconcile two seemingly disparate findings in the voter ID literature, but which we argue need not be mutually exclusive, because they are estimating two different quantities of interest. The first quantity of interest is the differential effect of voter ID laws on turnout among those without ID. Our findings—along with other recent work that combines individual-level information on who actually lacks ID in Rhode Island, measured at scale (Esposito et al., Reference Esposito, Focanti and Hastings2019)—show that voter ID laws cause a differential decrease in turnout among those without ID, leaving minorities and Democrats disproportionately burdened because they are less likely to have photo ID. The second quantity of interest is the effect of voter ID laws on overall turnout, including both individuals with and without identification. Using our estimates of differential turnout and plausible assumptions about the effect of the law on those with identification, we find that the effects of voter ID laws on overall turnout are very small because very few voters lack photo ID. This is consistent with recent work using a nationwide voter file panel (Cantoni and Pons, Reference Cantoni and Pons2019). Both of these theoretical quantities are important, and our work furthers our understanding on both of these fronts. Moreover, this paper illustrates that the widely varying findings in the voter ID literature stem from the combination of lack of clarity about which is the estimand of interest along with limited data and to estimate either of these quantities with precision.
Our results also suggest important policy considerations as states consider voter identification laws and then those laws are contested in courts. If voters are not informed about changing laws they may continue to be deterred by the incorrect belief that they lack proper identification to vote. Future research should examine effective ways to inform voters about the changing requirements to cast ballots.
Supplementary material
The supplementary material for this article can be found at https://doi.org/10.1017/psrm.2020.57.
Acknowledgements
Authors are listed in alphabetical order and contributed equally. For comments and suggestions, the authors thank Andy Hall, Jonathan Mummolo, Paul Sniderman, Sean Westwood, members of Stanford's Democracy and Polarization Lab, and participants at the 2019 Election Sciences, Reform, and Administration conference.