Introduction
Many economically and medically important traits in animal genetics are categorical and often binary, but linear models have been routinely used for genetic evaluation. However, estimation of genetic parameters for nonlinear traits using linear models and methods of compensation for the estimation bias, which results from analysis of nonlinear traits in linear models, have been questioned (Van Vleck, Reference Van Vleck1972; Mäntyssari et al., Reference Mäntyssari, Quaas and Gröhn1991; Van Vleck and Gregory, Reference Van Vleck and Gregory1992; Abdel-Azim and Berger, Reference Abdel-Azim and Berger1999). Simulation studies have shown that breeding values for categorical traits are more reliably predicted using threshold than linear models (Varona et al., Reference Varona, Misztal and Bertrand1999; Phocas and Laloë, Reference Phocas and Laloë2003). Furthermore, it was found that reliability of prediction can be further increased by including a correlated continuous trait in the model, i.e. using a mixed linear–threshold model (Janss and Foulley, Reference Janss and Foulley1993; Jensen, 1994; Varona et al., Reference Varona, Misztal and Bertrand1999).
Genetic evaluations provide the basis for selection of breeding animals. Greater reliability of estimated genetic parameters and of predicted breeding values for categorical traits with threshold models will increase the efficiency of selection (Meijering and Gianola, Reference Meijering and Gianola1985; Matos et al., Reference Matos, Thomas, Gianola, Tempelman and Young1997). Superiority of selection based on genetic evaluation using a threshold model was found to be most distinct in situations frequently encountered in animal breeding, i.e. if progeny group sizes are unequal for traits with low prevalence and with low to moderate heritability (Meijering and Gianola, Reference Meijering and Gianola1985). Considerable heterogeneity of progeny group sizes was reported in modern Warmblood horse populations (Stock and Distl, Reference Stock and Distl2006a), in which both artificial insemination and natural breeding are practiced. Certain radiographic findings like osseous fragments in fetlock or hock joints occur in the limbs of young Warmblood riding horses with prevalences in the order of 10% to 25% (e.g. Winter et al., Reference Winter, Bruns, Glodek and Hertsch1996; Willms et al., Reference Willms, Röhe and Kalm1999; Stock and Distl, Reference Stock and Distl2006b and Reference Stock and Distl2006c). Transformed linear model estimates of heritabilities for these binary traits ranged mostly between 0.10 and 0.40 (Stock and Distl, Reference Stock and Distl2006b). Selection for radiographic health of the equine limbs should therefore benefit from genetic evaluation in the threshold model.
Prediction of breeding values on the basis of phenotype information implies that the trait of interest is determined by a very large number of genes, each having only a small effect. Nevertheless, genes or genome regions, which do not fit in the polygenic model, have been identified for health and production traits in many species (Dekkers, Reference Dekkers2004). Where such regions have been identified, combined use of molecular genetic and phenotype information through the utilisation of marker-assisted selection (MAS) can increase selection efficiency and maximise genetic gain, particularly for traits with low heritability and in a multi-trait selection scheme with negative genetic correlations among traits (Lande and Thompson, Reference Lande and Thompson1990; Meuwissen and Van Arendonk, Reference Meuwissen and Van Arendonk1992; Abdel-Azim and Freeman, Reference Abdel-Azim and Freeman2002 and Reference Abdel-Azim and Freeman2003). Negative genetic correlations have been determined between some of the most prevalent radiographic findings in the limbs of young Warmblood riding horses, requiring their joint consideration in a breeding scheme, which aims to lower their prevalences (Stock and Distl, Reference Stock and Distl2005a and Reference Stock and Distl2005b). Recent molecular genetic studies in different animal species increase the opportunity for implementation of MAS utilising radiological parameters in the near future (Kadarmideen and Janss, Reference Kadarmideen and Janss2005; Dierks et al., 2007).
Multivariate threshold–linear animal models including phenotypic and genotypic information have not been used so far for genetic evaluations in the horse. The objective of this study was to test the feasibility and to determine the properties of multivariate prediction of breeding values for categorical and continuous traits in linear–threshold animal models via Gibbs sampling using phenotypic, molecular genetic and pedigree data of a simulated horse population. Impact of data structure and quality of molecular genetic data on the accuracy of prediction and the expected response to selection was studied in the context of important radiological health traits in Warmblood horses.
Material and methods
Data simulation
Simulated data were used for this study. Simulation parameters were chosen according to the results of previous studies on radiographic findings in the limbs of Warmblood horses (Stock and Distl, Reference Stock and Distl2005a and Reference Stock and Distl2006b). Fixed effects, residual and additive genetic effects for one continuous trait (T1) and liabilities of four categorical traits (T2 to T5), and quantitative trait locus (QTL) effects for the liability of one of the categorical traits (T2) were simulated. Additive genetic effects (a) were normally distributed with a∼N(0,Aσ 2ai) and i = 1, 2,…, 5. Genetic variances (σ 2a) were set to 4.80 (T1) or 1.00 (T2 to T5), and genetic covariances were chosen such that additive genetic correlations (r g) were r g12 = r g13 = 0.20 and r g14 = r g45 = −0.20. Additive genetic effects of offspring (a offspring) were derived from additive genetic effects of their parents (a sire, a dam) and Mendelian sampling term (m) as a offspring = 0.5 (a sire+a dam)+m with m∼N(0, 0.5Aσ 2ai). Residual effects were normally distributed, e∼N(0, Iσ 2ei), with residual variances (σ 2e) such that heritabilities (h 2) were h 21 = 0.50, h 22 = h 24 = 0.10, and h 23 = h 25 = 0.25. A fixed contemporary group effect was simulated with 23 levels in total, five levels per generation and two levels each represented in two subsequent generations.
For T2, two QTL and two flanking markers per QTL with five alleles each were simulated, with one of the marker alleles being linked to the unfavourable QTL allele, i.e. the allele increasing the probability of T2. Marker alleles were randomly distributed and equally prevalent, with parents randomly transmitting one allele to their offspring. Total QTL variance was set equal to the additive genetic variance. In order to study the effects of different qualities of genetic marker information on genetic evaluation and selection, three scenarios were simulated: no recombination between genetic markers and QTL, polymorphism information content (PIC) of 0.9 of all markers (r0p9); recombination rate of 0.01 between markers and QTL, PIC of 0.90 of all markers (r1p9); and no recombination between genetic markers and QTL, PIC of 0.70 of all markers (r0p7). After simulation on the linear scale, liabilities of the categorical traits were dichotomised to obtain trait prevalences of 25% (T2, T5) or 10% (T3, T4).
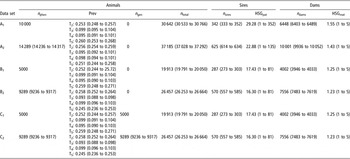
Each of the three simulated populations included 280 000 animals, evenly distributed over seven generations and with a male to female ratio of 1 : 1 in each generation. Per generation, 9000 females and 400 males were randomly chosen as parents of the next generation. Each dam was randomly mated to five sires, and each sire was randomly mated to five (200 sires), 150 (160 sires) or 500 dams (40 sires). Replicates (n = 10) were generated by drawing random samples of 10 000 animals from the fourth generation and tracing their pedigree back over three generations. For the genetic analyses, six different data sets were created within each replicate. Data set A1 included all 10 000 animals with records for the continuous trait and the four binary traits, information on the fixed effects of sex and contemporary group, and pedigree information over three generations. Data set B1 included 5000 animals, randomly chosen from the animals included in data set A1, with respective information on traits, sex, contemporary group and pedigree. Data set C1 included the same animals and the same information as data set B1, and additional information on the marker genotype of the animals. Data set B2 included the same animals as data sets B1 and C1 plus their parents with information on traits, sex, contemporary group and pedigree. Data set C2 included the same animals and the same information as data set B2, and additional information on the marker genotype of the animals. Data set A2 included the same animals as data sets B2 and C2 plus the additional 5000 animals that were included in data set A1, with information on traits, sex, contemporary group and pedigree. The average size of paternal half-sib groups ranged from 16.3 to 29.3, and the average size of maternal half-sib groups ranged from 1.2 to 1.6 among the animals with trait records in the six data sets. Distributions of trait and pedigree information in the different data sets used for the genetic analyses are given in Table 1.
Mean, minimum and maximum of binary traits and pedigree information in the six data sets generated within each of 10 replicates

n phen: number of animals with phenotypic trait records; prev: prevalence of binary traits (T2, T3, T4, T5); n gen: number of animals with genetic marker information; n total: total number of animals in the relationship matrix; n sires (n dams): number of sires (dams) of animals with phenotypic trait records; HSGpat (HSGmat): size of paternal half-sib groups among the animals with phenotypic trait records.
Prediction of breeding values
Genetic parameters were estimated using Gibbs sampling with the threshold version of the Multiple Trait Gibbs Sampler for Animal Models (MTGSAM) (Van Tassell and Van Vleck, Reference Van Tassell and Van Vleck1996), which assumes normal distributions of random and residual effects and uses flat priors for the fixed effects. For our analyses, we chose a starting value of one for all additive genetic variances and a starting value of zero for all additive genetic covariances, and we fixed the residual covariances between all traits to zero. Fixation of residual covariances to zero was performed, because the values found in real data for our traits of interest were small (Stock and Distl, Reference Stock and Distl2006a) and so were the values used for these parameters in the data simulation. Furthermore, sampling of the residual covariance matrix subject to the restriction of diagonal elements fixed at one is not trivial, and effective methods for this task are still being developed. For the binary traits, residual variances were fixed to one and thresholds were fixed to zero in order to ensure identifiability of the model (Harville and Mee, Reference Harville and Mee1984). A proper prior using an inverse Wishart distribution with minimum shape parameter (ν IW = n+2 for multivariate analysis of n traits, so ν IW = 7) was adopted for the genetic (co)variance matrix in order to ensure posterior propriety.
The fixed effects of sex and contemporary group were considered in all analyses. The fixed effect of marker genotype was considered in the analyses of data sets C1 and C2 only, distinguishing between individuals homozygous negative for the unfavourable alleles of all genetic markers, individuals heterozygous for the unfavourable allele of at least one of the genetic markers, and individuals homozygous for the unfavourable allele of at least one of the four genetic markers. Breeding values were derived from genetic analyses using multivariate animal models:

with y = n × 1 vector of phenotypic values for traits T1 to T5, μ = model constant (overall mean), b = k × 1 vector of fixed effects associated with records in y with incidence matrix X, a = r × 1 vector of random additive genetic animal effects with incidence matrix Z, e = n × 1 vector of random residuals, n = number of observations, k = number of fixed effects levels (k = 7 for data sets A1 and B1, k = 10 for data set C1, k = 10 for data sets A2 and B2, k = 13 for data set C2), and r = number of random effect levels (r = 30 533 to 30 766 for data set A1, r = 37 028 to 37 292 for data set A2, r = 19 791 to 20 050 for data sets B1 and C1, and r = 26 253 to 26 664 for data sets B2 and C2).
The total length of the Gibbs chain was set to 205 000 in all analyses, and all samples after the 5000th round were saved. Convergence of the Gibbs chain and length of burn-in was checked using the program GIBBSIT Version 2.0 (according to Raftery and Lewis, Reference Raftery and Lewis1992) and by visual inspection of sample plots. Only post-convergence samples were considered further. Unthinned chains were used to calculate posterior means of additive genetic (co)variance, heritability and additive genetic correlation estimates.
True and predicted breeding values (BV) were compared in those 5000 animals with trait records, which were included in all six data sets of each replicate, and in their sires using Pearson correlation coefficients and the procedure CORR of the Statistical Analysis System (SAS; SAS Institute, 2006).
True and predicted relative breeding values (RBV) were derived from true and predicted BV by standardisation on a relative scale with a mean ± standard deviation (s.d.) of 100 ± 20. The sires of animals with trait records were used as the reference population for the standardisation. Larger RBV for the continuous trait indicate genetic predisposition for higher values and lower RBV indicate genetic predisposition for lower values of this trait. RBV for the binary traits were transformed so that larger RBV will mean that the animals are less likely and lower RBV will mean that the animals are more likely to transmit a predisposition for the particular trait.
RBV classes were defined on the basis of true and predicted RBV such that animals with RBV smaller than 80 represented RBV class 1, animals with RBV in the range of 80 to 120 represented RBV class 2 and animals with RBV larger than 120 represented RBV class 3.
Selection
Total indices (TI) were derived from the true and the predicted RBV for the binary traits giving equal weight to each of the four traits,  . The TI were then used for selection among the sires of those 5000 animals with trait records, which were included in all analyses within each replicate. Selected sires had to fulfill three conditions. First, they had to be represented by at least 10 offspring with trait records. Exclusion of sires with less than 10 offspring from the selection study was based on the results of the comparison between true and predicted BV depending on the number of informative offspring. Second, they needed to have an above-average TI (TI > 100), and third, all their TI-relevant RBV had to be larger than two standard deviations below the mean (
 > 60). If genetic marker information was available for the sires (data set C2), selection based only on TI and RBV, derived from analysis of the respective data set, was further compared with selection based on marker genotype, TI and RBV. In this case, only sires that were homozygous negative for the unfavourable allele of all genetic markers were considered for selection. Accordingly, seven different scenarios of TI-based selection were compared: selection on the basis of TI from analyses of data set A1, A2, B1, B2, C1 or C2 (
 ); and selection on the basis of marker genotype and TI from analyses of data set C2 (
 ).
As an alternative selection strategy, we investigated selection that focused on the QTL trait, i.e. T2. Here, all sires with above-average  , all sires homozygous negative for the unfavourable allele of all genetic markers or sires homozygous negative for the unfavourable allele of all genetic markers with above-average
 were selected. Again, only sires represented by at least 10 offspring with trait records were considered for the first step of selection. Eight different scenarios of T2-focused selection were compared: selection on the basis of RBVT2 from analyses of data set A1, A2, B1, B2, C1 or C2 (
 ); selection on the basis of marker genotype and
 from analyses of data set C2 (
 ); selection on the basis of marker genotype (
 ).
In each case, the expected response to selection was assessed by comparing the prevalences of the binary traits in the offspring of the selected sires and in all 5000 animals with trait records, which were included in all analyses within each replicate. With data sets A1, A2, B1 and B2 on the one hand and data sets C1 and C2 on the other hand, information on phenotypes or information on phenotypes and marker genotypes was used for prediction of breeding values. Predicted breeding values accordingly resembled either overall breeding values accounting for additive genetic and QTL effects (analyses of data sets A1, A2, B1 and B2) or polygenic breeding values accounting for additive genetic effects only (analyses of data sets C1 and C2). Maximum use of available information for selection therefore meant consideration of general breeding values or the simultaneous consideration of polygenic breeding values and marker genotype.
Analysis of variance
The influence of data structure and the quality of genetic marker information on correlation between true and predicted BV, difference between true and predicted RBV class, and expected response to TI-based and T2-focused selection were tested via analysis of variance using the procedure GLM of SAS. Correlation between true and predicted BV, difference between true and predicted RBV or expected response to TI-based and T2-focused selection were considered as the dependent variable, and data set (A1, A2, B1, B2, C1, C2) and quality of genetic marker information (r0p9, r1p9, r0p7) were considered as fixed effects.
Results
Length of burn-in ranged between 5000 and 53 000 rounds of Gibbs sampling. Mean heritability estimates were h 2 = 0.53 for T1, h 2 = 0.25 for T3, h 2 = 0.12 for T4, and h 2 = 0.26 for T5 in all data sets, h 2 = 0.10 for T2 in data sets A1, A2, B1 and B2, and h 2 = 0.09 for T2 in data sets C1 and C2. Mean additive genetic correlation estimates were r g12 = 0.15, r g13 = 0.21, r g14 = −0.16, r g15 = −0.01, r g23 = 0.15, r g24 = 0.01, r g25 = −0.07, r g34 = −0.09, r g35 = 0.06, and r g45 = −0.25.
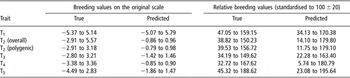
Ranges of true and predicted breeding values in all sires of animals with trait records are given in Table 2. For the continuous trait (T1), range of predicted BV was larger than the range of true BV, while the opposite was true for the binary traits (T2 to T5). Ranges of predicted relative breeding values were larger than the ranges of true relative breeding values for all traits.
Ranges of true and predicted breeding values expressed on the original scale and corresponding relative breeding values in all sires of animals with trait records, estimated for the continuous trait T1 and the binary traits T2 to T5

T2 (overall): overall breeding value for the binary trait T2, predicted without using molecular genetic marker information; T2 (polygenic): polygenic breeding value for the binary trait T2, predicted using molecular genetic marker information.
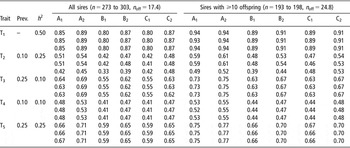
Correlations between true and predicted BV for traits T1 to T5 in all data sets and scenarios for all sires of offspring with trait information and sires with 10 or more offspring with trait information are given in Table 3. For all traits, correlation coefficients were significant and increased with increasing number of informative offspring per sire. The 5000 animals, which were included in all six data sets generated within each replicate, were sired by between 273 and 303 stallions, 193 to 198 of which had at least 10 offspring and 69 to 85 of which had at least 20 offspring with trait information. Correlation coefficients between true and predicted BV for the continuous trait T1 were 0.80 to 0.89 in all sires, 0.89 to 0.94 in sires with at least 10 offspring and 0.92 to 0.96 in sires with at least 20 offspring. Correlation coefficients between true and predicted breeding values for the binary traits T2 to T5 were 0.33 to 0.71 in all sires, 0.39 to 0.77 in sires with at least 10 offspring and 0.46 to 0.86 in sires with at least 20 offspring. The data set used for the genetic analyses had a significant influence on BV correlations of all traits (P < 0.001). BV correlation coefficients did not differ significantly between data sets A1 and B2 for T3 and T4, between data sets A1 and C2 for T2, T3 and T4, between data sets B1 and C1 for T1, T3, T4 and T5, and between data sets B2 and C2 for T1, T3, T4 and T5 (P = 0.072 to 0.978). Quality of genetic marker information had a significant influence on BV correlations of T2, with significantly higher correlation coefficients in scenarios r0p9 and r1p9 than in scenario r0p7 (P < 0.001).
Correlation coefficients between true and predicted breeding values for the continuous trait T1 and the binary traits T2 to T5, in all sires with offspring trait records and sires with 10 or more offspring with trait records for different scenarios with respect to recombination rate (r) between markers and QTL and polymorphism information content (PIC) of markers in the analyses of data sets A1 to C2; values for r = 0.00 and PIC = 0.9 in the first line, for r = 0.01 and PIC = 0.9 in the second line, and for r = 0.00 and PIC = 0.7 in the third line

n: number of sires; n off: average number of offspring per sire; Prev.: prevalence of binary traits; h 2: heritability.
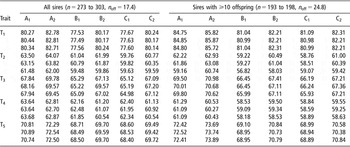
Results of comparison between true and predicted classes of RBV for traits T1 to T5 and all data sets and scenarios in all sires of offspring with trait information and sires with 10 or more offspring with trait information are given in Table 4. Percentages of sires with identity of true and predicted RBV class were 77.5% to 80.4% for T1, 59.5% to 64.1% for T2, 65.0% to 69.8% for T3, 60.5% to 63.7% for T4, and 68.4% to 72.5% for T5. Among the sires with at least 10 (20) or more offspring with trait information, true and predicted RBV classes were identical in 81.0% to 85.9% (84.8% to 88.2%) for T1, 56.8% to 63.1% (53.6% to 65.5%) for T2, 65.9% to 70.0% (65.8% to 72.4%) for T3, 58.2% to 61.3% (54.7% to 58.9%) for T4, and 68.9% to 73.9% (70.6% to 78.8%) for T5. RBV class difference was zero or one for more than 98% of the sires with all data sets and in all scenarios. RBV class differences were significantly dependent on the data set for all traits (P < 0.001). Quality of genetic marker information had a significant influence on the percentage of identity of true and predicted RBV classes for T2, with higher percentages of identity in scenarios r0p9 and r1p9 than in scenario r0p7 (P < 0.001).
Proportion of identity of true and predicted classes of relative breeding values (%) for the continuous trait T1 and the binary traits T2 to T5, in all sires with offspring trait records and sires with 10 or more offspring with trait records for different scenarios with respect to recombination rate (r) between markers and QTL and polymorphism information content (PIC) of markers in the analyses of data sets A1 to C2; values for r = 0.00 and PIC = 0.9 in the first line, for r = 0.01 and PIC = 0.9 in the second line, and for r = 0.00 and PIC = 0.7 in the third line

n: number of sires; n off: average number of offspring per sire.
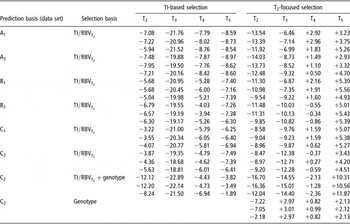
The number of selected sires across selection types and scenarios was 94 on average, ranging between 43 and 191. Relative changes of prevalences of binary traits T2 to T5 after TI-based and T2-focused selection of sires for all selection types and scenarios are given in Table 5. Under the different selection types studied, relative prevalence changes were −0.12 to −0.03 for T2, −0.23 to −0.19 for T3, −0.09 to −0.04 for T4, and −0.09 to −0.02 for T5. Under all selection types and scenarios, prevalences of all traits were reduced after TI-based selection, whereas prevalences of T2 and T3 were reduced, prevalence of T4 was almost unchanged and prevalence of T5 was increased after T2-focused selection. Data set had a significant influence on the prevalence changes after TI-based and T2-focused selection for T2 (P < 0.001), T3 (P < 0.01) and T4 (P ⩽ 0.01), and after TI-based selection for T5 (P < 0.001). Quality of genetic marker information was significant for the prevalence changes after TI-based selection for T2 and T4 (P < 0.05) and after T2-focused selection for T2 (P < 0.001). Selection response with respect to T2 was significantly larger with than without genetic marker information being considered for selection.
Relative changes of prevalences (%) of binary traits T2 to T5 after multi-trait selection of sires based on a total index, in which equal weight is given to the relative breeding values for T2 to T5, or on genotype and total index (TI based selection), and after single-trait selection of sires for T2 based on the relative breeding value for this trait ( ), on genotype or on genotype and
 (T2 focused selection), for different scenarios with respect to recombination rate (r) between markers and QTL and polymorphism information content (PIC) of markers using predicted breeding values from analyses of data sets A1 to C2; values for r = 0.00 and PIC = 0.9 in the first line, for r = 0.01 and PIC = 0.9 in the second line, and for r = 0.00 and PIC = 0.7 in the third line

Discussion
Simulated phenotypic, molecular genetic and pedigree data were used to predict breeding values for continuous and categorical traits in multivariate mixed linear–threshold animal models in a simulated horse population via Gibbs sampling. Simulation parameters were chosen according to the results of real data analyses on radiographic findings in the limbs of Hanoverian Warmblood horses (Stock and Distl, Reference Stock and Distl2006a). Different data sets were used to study the properties of the genetic evaluation procedure depending on data structure with respect to the number and distribution of animals with trait information and the availability of genotype information. Effects of data structure on accuracy of genetic parameter estimates have been discussed elsewhere (Stock et al., Reference Stock, Distl and Hoeschele2007).
In addition to the four binary traits of interest, one continuous trait was included in order to improve mixing and convergence of the Gibbs sampler (Luo et al., Reference Luo, Boettcher, Schaeffer and Dekkers2001) and accuracy of genetic evaluation (Janss and Foulley, Reference Janss and Foulley1993; Varona et al., Reference Varona, Misztal and Bertrand1999). However, inclusion of a correlated continuous trait does not warrant unbiased estimates of genetic parameters in a complex multiple-trait setting as used for this simulation (Stock et al., Reference Stock, Distl and Hoeschele2007). In previous studies, BV reliability was found to be almost doubled in bivariate analyses of categorical and continuous traits when compared with univariate categorical analyses (Janss and Foulley, Reference Janss and Foulley1993). Comparison of univariate linear, univariate threshold, bivariate linear and bivariate linear–threshold genetic evaluations revealed highest correlations between true and predicted BV for the categorical trait in joint analyses with a continuous trait (Varona et al., Reference Varona, Misztal and Bertrand1999). In this study, BV correlation coefficients, serving as a measure of prediction accuracy, ranged between 0.80 and 0.96 for the continuous trait and between 0.41 and 0.84 for the binary traits. In the binary traits, BV correlations were strongly influenced by the amount and structure of available information, trait prevalence and heritability. Dependence on trait prevalence was more distinct than dependence on heritability leading to lowest correlations for the trait of low prevalence and low heritability (T4), followed by the trait of low prevalence and moderate heritability (T2), the trait of moderate prevalence and low heritability (T3), and the trait of moderate prevalence and moderate heritability (T5). There is no literature on similar comparative analyses of categorical traits of different heritability and prevalence levels.
In previous studies, a minimum number of offspring with trait information of 10, 30 or more offspring was defined as a requirement for inclusion of sires in genetic evaluations (Janss and Foulley, Reference Janss and Foulley1993; Abdel-Azim and Berger, Reference Abdel-Azim and Berger1999; Varona et al., Reference Varona, Misztal and Bertrand1999; Phocas and Laloë, Reference Phocas and Laloë2003). We considered all sires regardless of the number of their offspring for calculation of correlations between true and predicted BV. Correlation coefficients increased with available trait information per sire, i.e. were higher in the sires with at least 20 offspring than in the sires with at least 10 offspring and all sires with offspring with trait records. In general, results were similar to those of previous studies on categorical traits with two or four levels analysed in bivariate mixed linear–threshold models (Janss and Foulley, Reference Janss and Foulley1993; Varona et al., Reference Varona, Misztal and Bertrand1999; Phocas and Laloë, Reference Phocas and Laloë2003).
For the genetic analyses of the binary traits, identifiability of the model was attained via fixation of residual variances to one and fixation of thresholds to zero (Harville and Mee, Reference Harville and Mee1984), although respective simulated variance values were nine (T2, T4) or three (T3, T5). Use of different scales for simulation and genetic analysis of binary traits was reflected by expression of true and predicted breeding values on different scales. For the continuous trait the ranges of true and predicted breeding values were very similar, but for the binary traits the ranges of predicted breeding values were much smaller than the ranges of true breeding values. Standardisation had to be performed before true and predicted breeding values could be equivalently used for selection. Conversely, different scaling should not affect the ranking of animals by their genetic values, and breeding values expressed on the original or a standardised scale can be equally chosen for correlation analyses between true and predicted values. If sires have progeny with average performance with respect to the traits of interest and accordingly average true BV, their predicted BV should be average as well, regardless of possible uncertainty about genetic parameters. Effect of uncertainty about genetic parameters will be largest on the BV predicted for the sires with extreme progeny performance (Wang et al., Reference Wang, Quaas and Pollak1997).
Selection of sires for the binary traits on the basis of RBV or RBV-derived TI decreased the prevalences of the selection traits in the next generation by between 2% and 22%. The expected response to multi-trait selection on the basis of TI was compared with the expected response to one-trait selection on the QTL trait (T2). Negative additive correlations between traits and equal weighting of all traits decreased the expected selection response with respect to the QTL trait by between 4% and 6%. However, it was still larger than expectations from other methods for prediction of genetic response for threshold traits (e.g. Foulley, Reference Foulley1992). At the same time, prevalence of the negatively correlated trait (T5) decreased after TI-based multi-trait selection, but increased to the same or larger amount after single-trait selection on the QTL trait. As expected, selection on the basis of polygenic breeding values alone was least effective. Combined use of phenotype and marker genotype information on animals from two subsequent generations produced by far the largest expected response to selection with respect to the QTL trait. There is no literature on influences of amount, structure and kind of available data on reliability of genetic evaluation and efficiency of subsequent response to selection.
Study of long-term response to selection requires the application of selection criteria to subsequent generations of sires. In this study, selection criteria were only applied to sires with progeny information or with own and progeny information on the selection traits. For the potential sires of the next generation, i.e. male offspring of the selected sires, no progeny information has been available yet, resulting in correlations between true and predicted BV, which were on average 7% to 27% lower than in their sires (results not shown). When we ignored BV uncertainty and performed another round of selection, there were indications that relevant decrease of the prevalence of the QTL trait could be achieved via combination of selection based on RBV or TI in the first step and selection based on marker genotype and RBV or TI in the second step of selection (results not shown). In this case, prediction of RBV was based on phenotype and marker genotype information of animals from only one generation, and marker genotype information was not available on the sires for the first step of selection. Accordingly, sires of the first generation were selected on the basis of rather reliable polygenic RBV, and sires of the second generation were selected on the basis of marker genotype and rather uncertain polygenic RBV. This situation is likely to occur in the initial stages of practical implementation of marker-assisted selection in the horse. Recording of phenotypes with respect to the most important radiographic findings in the limbs cannot be performed reliably before an age of about 10 to 12 months (Dik et al., Reference Dik, Enzerink and Van Weeren1999; Kroll et al., Reference Kroll, Hertsch and Höppner2001). In many cases, riding horses, i.e. adult horses of at least 3 years of age, provide the basis of extensive radiographic surveys, the results of which can be used for genetic analyses (e.g. Winter et al., Reference Winter, Bruns, Glodek and Hertsch1996; Stock and Distl, Reference Stock and Distl2006b). Concurrent sampling of radiographed horses for determination of marker genotypes will be possible, but concurrent sampling of their parents will not be possible to the same extent. The results of this study imply that the combined use of phenotype and marker genotype information may be advantageous over the use of phenotype information alone. This appeared to be true even if information is limited to animals from one generation.
The influence of the amount and structure of available data on reliability of genetic evaluation and efficiency of subsequent selection was generally larger than the influence of the quality of genetic marker information. Given a high PIC of genetic markers, the recombination rate of 1% between markers and QTL did not significantly affect reliability of genetic evaluation. In contrast, reduction of PIC in the absence of recombination between markers and QTL led to a significant decrease of correlations between true and predicted BV, proportions of identity between true and predicted RBV classes and response to selection with respect to the QTL trait.
Conclusions
Breeding values can be predicted for categorical and continuous traits in multivariate mixed linear–threshold animal models via Gibbs sampling using phenotypic and molecular genetic data and pedigree structures similar to those encountered in the Hanoverian Warmblood horse. Reliability of genetic evaluation for binary traits depends more on prevalence than on heritability of the traits. Satisfactory identification of sires of average, favourable and unfavourable genetic values allows efficient single- and multi-trait selection. The largest selection response with respect to a QTL trait is achieved via the combined use of information on phenotype and marker genotype.
Acknowledgements
This work was supported by a fellowship of K. F. Stock within the Postdoc program of the German Academic Exchange Service (Deutscher Akademischer Austauschdienst, DAAD). I. Hoeschele acknowledges financial support from the US National Institute of Health (GM66103-01).