Sarcopenia is a manifestation of muscle failure, characterised by a progressive loss of muscle strength, quantity and quality, with an increased risk of adverse health outcomes, including disability, falls and mortality, and imposing a significant economic burden on society(Reference Cruz-Jentoft, Bahat and Bauer1,Reference Papadopoulou2) . Accumulating evidence suggests that diet is critically associated with the development of sarcopenia. Via systematic review of fourteen prospective cohort studies, Jang et al. (Reference Jang, Han and Jang3) reported that high saturated fat diet and the Mediterranean diet were associated with increased and decreased risk of sarcopenia, respectively. Karlsson et al. (Reference Karlsson, Becker and Michaelsson4) demonstrated that healthy dietary patterns tended to protect against the development of sarcopenia over 16 years. As one of the most modifiable lifestyle factors, an in-depth exploration of the relationship between diet and sarcopenia is crucial for the prevention and management of sarcopenia.
Advanced glycation end products (AGE) are a group of complex heterogeneous substances produced by nonenzymatic reactions between proteins, lipids or nucleic acid macromolecules and reducing sugars(Reference Rowan, Bejarano and Taylor5). AGE can be endogenously formed in the body or exogenously derived from food (dAGE). The representative AGE include Nϵ-carboxymethyl-L-lysine (CML), Nϵ-(1-carboxyethyl) lysine(CEL), Nδ-(5-hydro-5-methyl-4-imidazolon-2-yl)-ornithine (MG-H1) and pentosidine, with CML, CEL and pentosidine as lysine-derived AGE and MG-H1 as arginine-derived AGE, respectively(Reference Twarda-Clapa, Olczak and Białkowska6). AGE can accumulate in neuromusculoskeletal tissues, which may lead to decrease in muscle mass and strength. AGE measured via skin autofluorescence or serum AGE level was associated with sarcopenia in diabetes patients(Reference Mori, Kuroda and Ishizu7,Reference Mori, Kuroda and Araki8) and in elderly patients with chronic kidney disease(Reference Molinari, Caldiroli and Dozio9,Reference Yabuuchi, Ueda and Yamagishi10) . Using the population-based Rotterdam Study, Waqas et al. (Reference Waqas, Chen and Lu11) reported that dietary CML intake was cross-sectionally but not longitudinally associated with sarcopenia. Therefore, the associations between dietary AGE intake and the risk of sarcopenia need to be further explored. Furthermore, the dietary AGE contents in foods mainly depend on the types of foods, cooking methods, temperature and heating duration(Reference Uribarri, del Castillo and de la Maza12). In general, animal-derived foods and those that have been exposed to high heat during preparation are particularly high in AGE(Reference Phuong-Nguyen, McNeill and Aston-Mourney13). It remains unexplored how the associations between dietary AGEs from different food types and sarcopenia may differ.
It has also been shown that osteoporosis and sarcopenia interact with each other(Reference Liu, Liu and Xia14). Vitamin D is a type of hormone that promotes the formation of new bone, and higher vitamin D intake or status is associated with reduced bone density loss(Reference Wu, Cai and Yang15). A cross-sectional study reported an inverse association between adequate vitamin D intake and the prevalence of osteopenia and sarcopenia in haemodialysis patients(Reference Wang, Ma and Pu16). Meanwhile, dietary AGE might also influence bone mineral density (BMD)(Reference Illien-Junger, Palacio-Mancheno and Kindschuh17) and serum 25 (OH) D3 level(Reference Chen, van der Duin and Campos-Obando18). Therefore, the potential mediating effects of BMD and serum 25 (OH) D3 on the association between dietary AGE intake and sarcopenia also need to be explored.
Based on National Health and Nutrition Examination Survey (NHANES), this study aimed to investigate the association between dietary AGE intake from total and different types of foods and sarcopenia. We further explored the mediating effects of BMD and serum 25 (OH) D3 in the relationship between dietary AGE and appendicular lean mass index (ALMI) in the USA adult population.
Methods
Study population
NHANES was a programme that assessed the health and nutritional status of the American people, and the study protocol was endorsed by the NHANES Institutional Review Board, with all participants providing informed consent during the investigation. For this study, we utilised data from four NHANES cycles from 2011–2018, focusing on adults aged 20–59 years who had body composition information, dietary interview of the first day and covariates. Participants aged 20–59 years from NHANES 2011–2018 were 22 617. After excluding 5488 participants with missing data on dietary interview, 8795 participants with missing data on dual energy X-ray absorptiometry and 164 participants with BMI < 18·5 kg/m2 and 580 participants with unreasonable levels of daily energy intake, a total of 7590 participants were finally included in the analysis, corresponding to 33·6 % of the initial cohort.
Assessment of dietary advanced glycation end products levels
Dietary intake data were used to estimate the type and amount of food and beverages (including all types of water) consumed in the 24 h before the interview (midnight to midnight) and to estimate energy, nutrients and other food components from these foods and beverages. The database of dietary AGE developed by Scheijen et al. (Reference Yamagishi, Adachi and Nakamura19) was matched against the full description of the food (including the name of the food and cooking method) and used to analyse CML, CEL and MG-H1 in protein fractions of food using a highly sensitive, specific and rapid ultra-performance liquid chromatography-tandem MS method as described previously from our research group(Reference Xie, Zhao and Liu20). In brief, first, the foods in the database based on AGE were directly matched to foods in NHANES. Second, the AGE content of specific food products not directly appearing in the AGE database was estimated by matching them to other products that were comparable in terms of nutrient profiles and preparation methods. Based on previous findings(Reference Si, Liu and Peng21), we also categorised all dietary AGE into thirteen food groups, including meat and meat products, milk and dairy products, baked foods, bean and nut products, fruits and vegetables, oil and condiments, potatoes and their products, cereal and cereal products, candy, beverages, eggs and egg products soup and seafood.
Definition of sarcopenia
Appendicular lean mass (ALM) was calculated by summing the lean tissue (excluding bone) of the extremities. Dual energy X-ray absorptiometry was used to assess the body composition. Pregnancy, self-reported history of radiographic contrast agent (barium) use in the past 7 d and self-reported weight greater than 450 pounds, or height greater than 6 feet 5 inches, were excluded for dual energy X-ray absorptiometry examination. We defined sarcopenia according to the National Institutes of Health (FNIH) using the ratio of ALM to BMI(Reference McLean, Shardell and Alley22), called appendicular lean mass index (ALMI), which was determined to be present if ALM/BMI was less than 0·789 for men and 0·512 for women.
Measurement of bone mineral density and serum 25 (OH) D3
BMD was assessed using whole-body dual energy X-ray absorptiometry. For the present analysis, the total body BMD value was used. Serum 25 (OH) D3 concentration was quantified using ultra-high performance liquid chromatography-tandem MS. Following liquid–liquid extraction, analytes were separated on a pentafluorophenyl column and detected by tandem mass spectrometry, with quantitation based on calibration curves corrected using deuterated internal standards.
Covariates
We identified relevant potential covariates based on previous similar studies, which included age, sex (male, female), race (Mexican American, Other Hispanic, Non-Hispanic White, Non-Hispanic Black and Other Race), BMI (18·5–25 kg/m2, 20–30 kg/m2, ≥ 30 kg/m2), ratio of family income to poverty, education level (less than high school, high school and higher than high school), marital status (married/ living with partner and never married), smoking status (never, current and former), protein intake, HbA1c level (< 6·5 %, ≥ 6·5 %), physical activity level (sedentary, i.e. no regular physical activity, insufficient regular activity, i.e. < 500 metabolic equivalent [MET] min/week), moderate, i.e. 500–1000 MET min/week and high, i.e. > 1000 MET min/week), depression status (yes, no), chronic kidney disease (yes, no), congestive heart failure (yes, no) and dietary energy intake.
Statistical analysis
All analyses considered complex sampling and sample weights to produce accurate estimates. Characteristics of the study population were presented as mean (standard deviation (sd)) for continuous variables and the number of instances (n) and frequency (%) for categorical variables. We calculated Z scores for dietary AGE values (CML, CEL and MG-H1) and summed them into a single dietary score (dAGE Z-score), which represented the individual’s overall dAGE intake. All dAGE were divided into low (T1), medium (T2) and high (T3) dAGE, with 25th and 75th percentile as the cut-off value. This categorisation, based on tertiles to create three distinct groups, was chosen to define a clear low-exposure reference group and to better examine the effects of high dAGE intake. We performed t tests for continuous variables and χ 2 tests for categorical variables to analyse differences according to the tertiles of dAGE Z-score.
Multivariate linear regression model was used to evaluate the relationship between dAGE and ALMI. Then, to further investigate the relationship between dAGE and the prevalence of sarcopenia, logistic regression analysis with three fitted model was performed. In model 1, covariates were not adjusted. In model 2, age, sex, race, BMI, ratio of family income to poverty, education level, marital status, smoking status, protein intake, HbA1c level and physical activity level were adjusted. In model 3, depression status, chronic kidney disease, congestive heart failure and dietary energy intake were further adjusted. We used adjusted OR and corresponding 95 % CI for descriptive purposes and entered the content of dAGE as a continuous variable into the corresponding regression models for trend testing (P for trend). We also further explored the associations between dietary AGEs from different food types and the prevalence of sarcopenia based on model 3. To examine whether the associations of dietary AGE from specific food sources were independent of overall dAGE exposure, the models for food-specific AGE were additionally adjusted for the total dAGE Z-score. Finally, we analysed the mediating role of BMD and serum 25 (OH) D3 on the association between dAGE and ALMI. This analysis used the same fully adjusted covariates as in Model 3 – namely, age, sex, race, BMI, family income to poverty, education level, marital status, smoking status, protein intake, HbA1c level, physical activity level, depression status, chronic kidney disease, congestive heart failure and dietary energy intake – ensuring consistent adjustment across all paths of the mediation model. In the mediation analysis, the continuous variable ALMI was selected as the outcome instead of the dichotomous diagnosis of sarcopenia. This decision was based on two primary considerations. First, the use of a continuous outcome enhances statistical power and allows for a more precise quantification of mediation effects. Second, as ALMI is the core continuous component defining sarcopenia, analysing its changes directly helps elucidate the mechanisms underlying alterations in muscle mass itself, thereby providing a more direct mechanistic explanation for the observed association with sarcopenia.
Statistical analyses were conducted using SAS 9.4 and R 4.3.1, and P values less than 0·05 were considered statistically significant.
Results
Basic characteristics of recruited participants
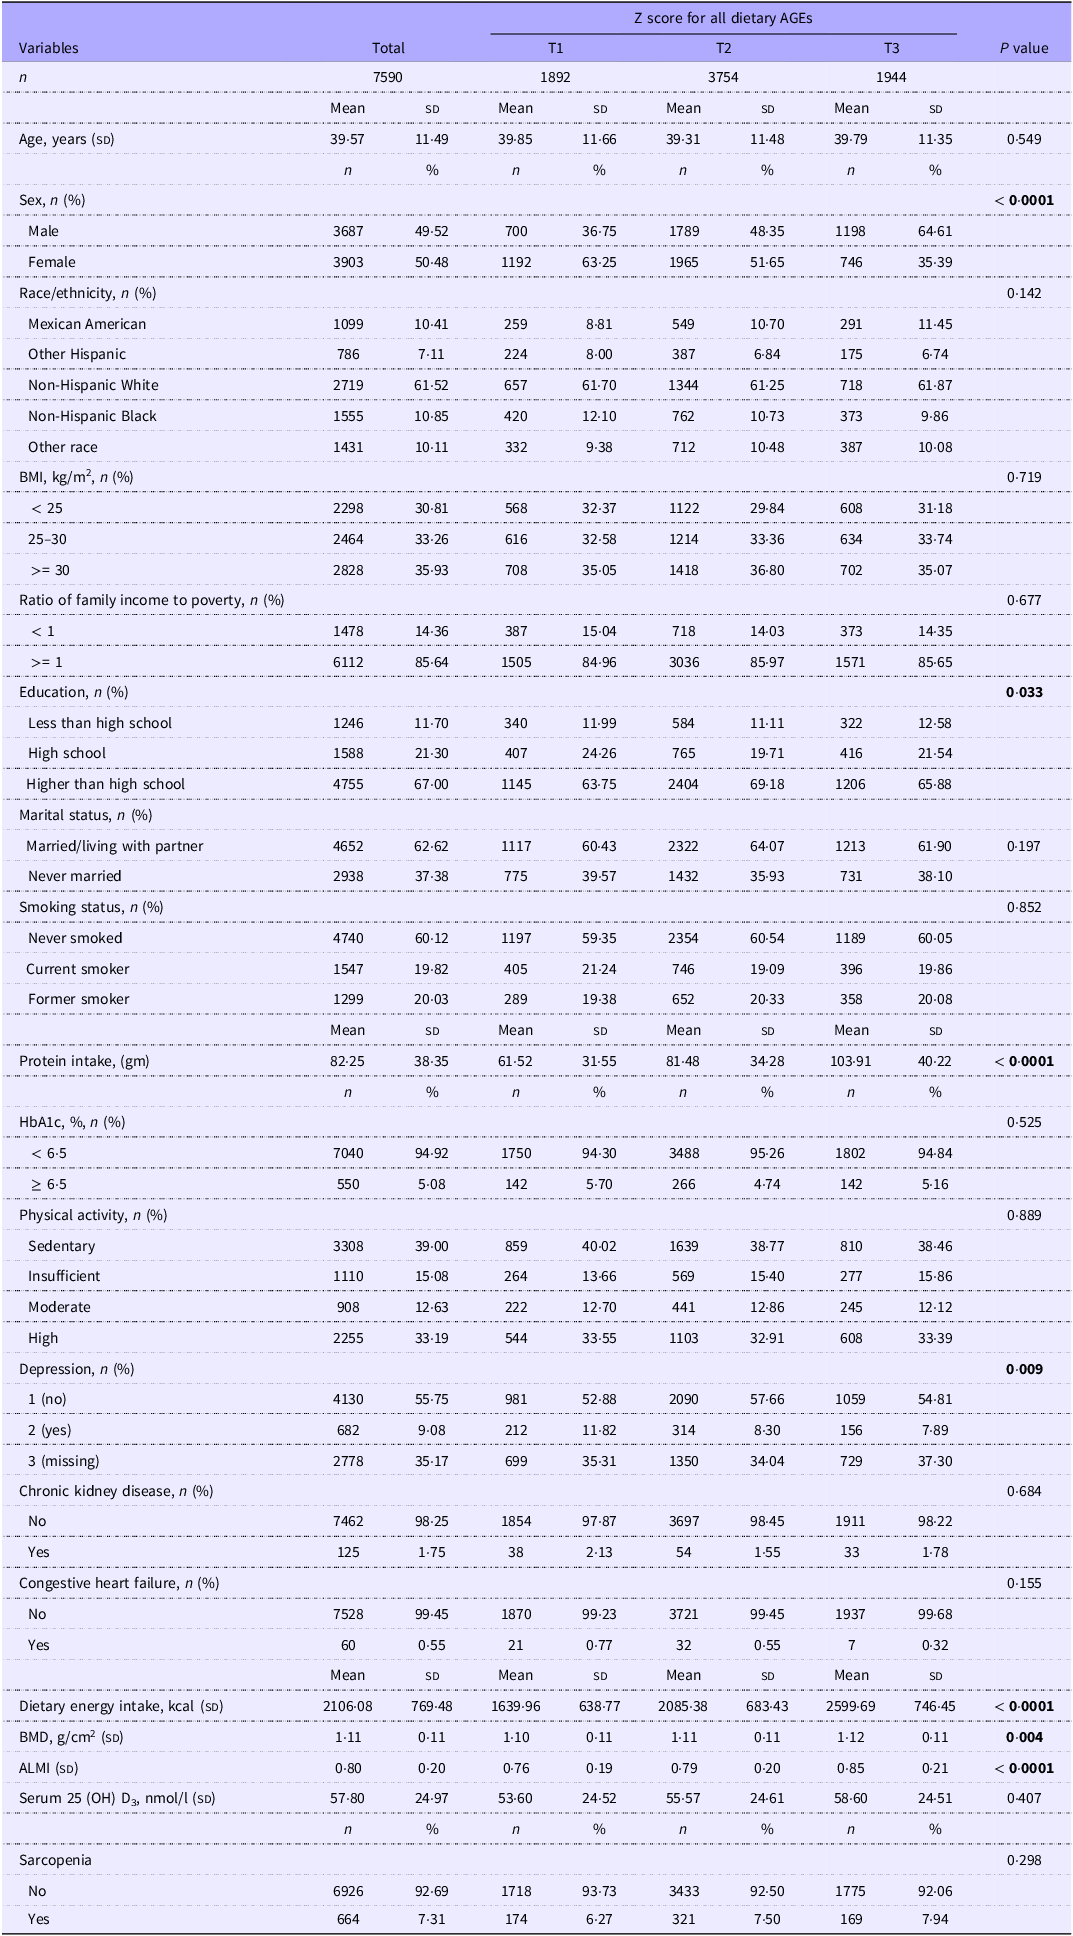
A total of 7590 participants were involved in the study, with a mean age of 39·57 years old (sd: 11·49) and 49·52 % were males. Among these participants, the prevalence of sarcopenia was 7·31 %. Participants with higher dAGE level were more likely to be males, higher level of education received, higher protein intake, no depression and higher dietary energy intake (all P < 0·05). The average value for BMD and serum 25 (OH) D3 was 1·11 g/cm2 (sd: 0·11), 57·80 nmol/l (sd: 24·97), respectively (Table 1).
Baseline characteristics of recruited participants from NHANES 2011–2018

Table 1 Long description
The table presents the baseline characteristics of 7590 participants from NHANES 2011-2018. It includes variables such as age, sex, race/ethnicity, BMI, ratio of family income to poverty, education, marital status, smoking status, protein intake, HbA1c, physical activity, depression, chronic kidney disease, and congestive heart failure. The table also provides data on sarcopenia, dietary energy intake, BMD, and serum 25 (OH) D3 levels. The participants are divided into three groups based on their dAGE levels: T1, T2, and T3. Each row provides the mean, standard deviation, and percentage values for each variable across the three groups. Notable trends include higher prevalence of sarcopenia in participants with higher dAGE levels, and differences in sex, education level, protein intake, depression, and dietary energy intake among the groups.
AGE, advanced glycation end product; ALMI, appendicular skeletal mass index.
Values are mean (sd) (continuous variables) or n, % (categorical variables) and values are weighted.
T1, 0–25th percentile; T2, 25th–75th percentile; T3, above 75th percentile.
Bold text indicates P < 0·05.
Associations between dietary advanced glycation end products intake and appendicular lean BMI
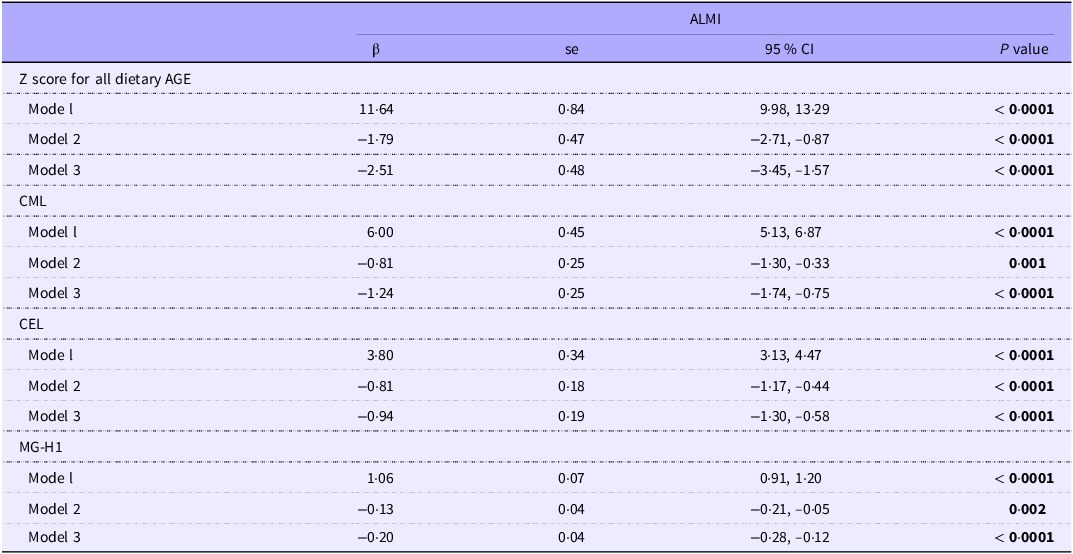
As shown in Table 2, in adjusted model, dAGE Z-score, CML, CEL and MG-H1 were negatively related to ALMI, the beta coefficients (β) and 95 % CI were –2·51 (–3·45, –1·57), –1·24 (–1·74, −0·75), −0·94 (–1·30, −0·58) and −0·20 (−0·28, −0·12), respectively.
Multivariable linear regression model testing the association between dietary AGEs and ALMI from NHANES 2011–2018

Table 2 Long description
A table with the title 'Multivariable linear regression model testing the association between dietary AGEs and ALMI from NHANES 2011-2018'. The table has 13 rows and 5 columns. The columns are labeled 'Z score for all dietary AGE', 'β', 'se', '95 % CI', and 'P value'. The rows are grouped under different headings: 'ALMI', 'CML', 'CEL', and 'MG-H1'. Each group contains three models: Model 1, Model 2, and Model 3. The values in the table are as follows: Row 1: Z score for all dietary AGE, Model 1, β: 11.64, se: 0.84, 95 % CI: 9.98, 13.29, P value: < 0.0001. Row 2: Z score for all dietary AGE, Model 2, β: -1.79, se: 0.47, 95 % CI: -2.71, -0.87, P value: < 0.0001. Row 3: Z score for all dietary AGE, Model 3, β: -2.51, se: 0.48, 95 % CI: -3.45, -1.57, P value: < 0.0001. Row 4: CML, Model 1, β: 6.00, se: 0.45, 95 % CI: 5.13, 6.87, P value: < 0.0001. Row 5: CML, Model 2, β: -0.81, se: 0.25, 95 % CI: -1.30, -0.33, P value: 0.001. Row 6: CML, Model 3, β: -1.24, se: 0.25, 95 % CI: -1.74, -0.75, P value: < 0.0001. Row 7: CEL, Model 1, β: 3.80, se: 0.34, 95 % CI: 3.13, 4.47, P value: < 0.0001. Row 8: CEL, Model 2, β: -0.81, se: 0.18, 95 % CI: -1.17, -0.44, P value: < 0.0001. Row 9: CEL, Model 3, β: -0.94, se: 0.19, 95 % CI: -1.30, -0.58, P value: < 0.0001. Row 10: MG-H1, Model 1, β: 1.06, se: 0.07, 95 % CI: 0.91, 1.20, P value: < 0.0001. Row 11: MG-H1, Model 2, β: -0.13, se: 0.04, 95 % CI: -0.21, -0.05, P value: 0.002. Row 12: MG-H1, Model 3, β: -0.20, se: 0.04, 95 % CI: -0.28, -0.12, P value: < 0.0001.
AGE, advanced glycation end product; ALMI, appendicular lean BMI; CML, Nϵ-carboxymethyl-L-lysine; CEL, (1-carboxyethyl) lysine; MG-H1, Nδ-(5-hydro-5-methyl-4-imidazolon-2-yl)-ornithine; NHANES, National Health and Nutrition Examination Survey.
All dAGE in the table were scaled down from the original data by 1000.
Model 1 was Crude model.
Model 2 was adjusted for age, sex, race/ethnicity, BMI, ratio of family income to poverty, education level, marital status, smoking status, protein intake, HbA1c level, physical activity.
Model 3 was adjusted for model 2 + depression, chronic kidney disease, congestive heart failure, dietary energy. Bold text indicates P < 0·05.
Association of dietary advanced glycation end products and different food-derived advanced glycation end products with the prevalence of sarcopenia
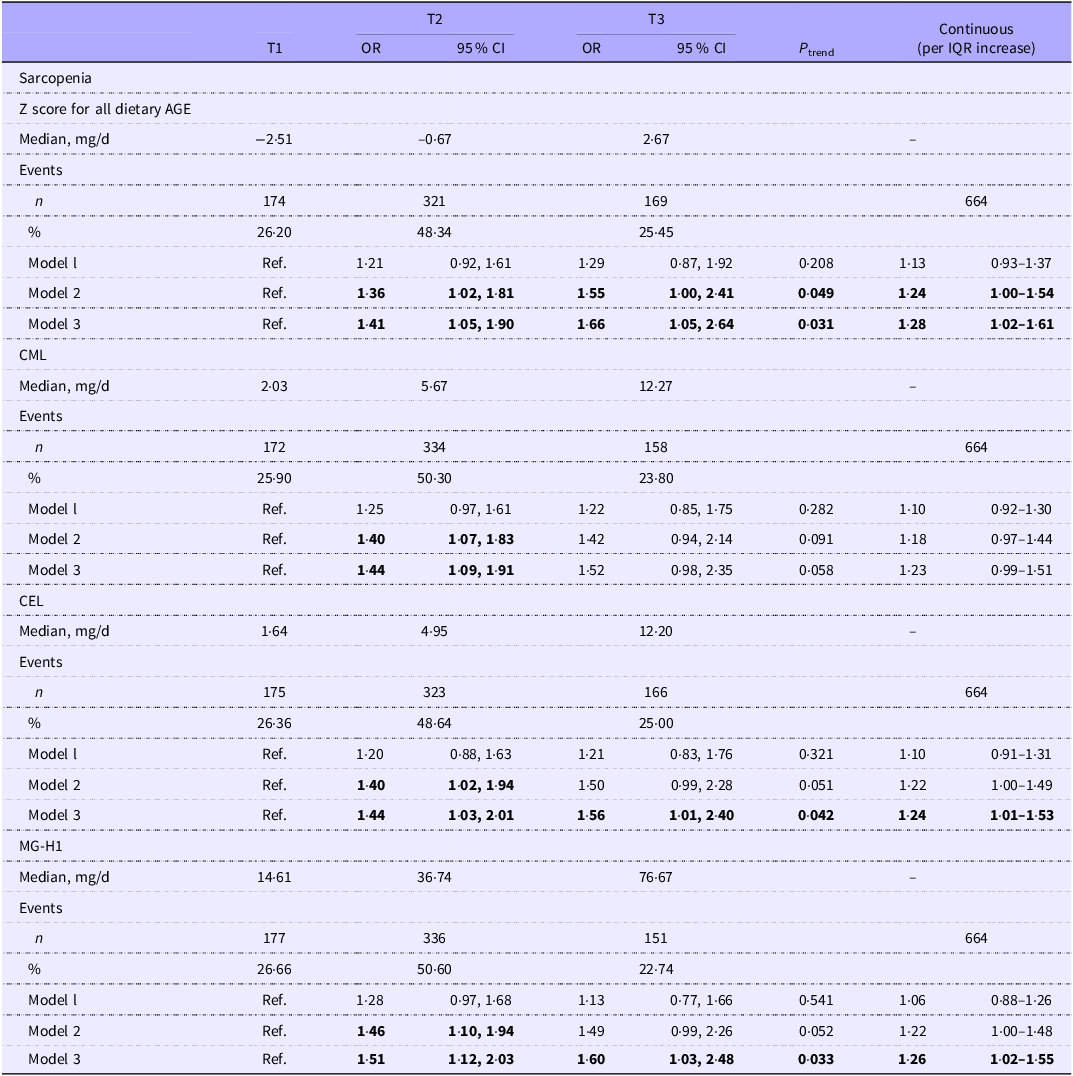
After adjusting for all covariates, compared with the low intake, the OR for the prevalence of sarcopenia in the high intake of dietary AGE Z-score, CEL and MG-H1 intake were 1·66 (95 % CI: 1·05, 2·64; P trend = 0·031), 1·56 (95 % CI: 1·01, 2·40; P trend = 0·042) and 1·60 (95 % CI: 1·03, 2·48; P trend = 0·033), respectively, but no association was found in CML. In addition, in fully adjusted model, for each quartile increment in dAGE Z-score, CEL and MG-H1, the OR (95 % CI) for the prevalence of sarcopenia was 1·28 (1·02, 1·61), 1·24 (1·01, 1·53) and 1·26 (1·02, 1·55), respectively (Table 3).
Relationship between dietary AGE intake and prevalence of sarcopenia from NHANES 2011–2018

Table 3 Long description
The table presents data on the relationship between dietary AGE intake and the prevalence of sarcopenia, analyzed using three different models. It includes columns for T1, T2, and T3, with corresponding OR (odds ratio) and 95% CI (confidence interval) values, as well as a continuous variable for each dietary component. The table is divided into sections for different dietary components: Z score for all dietary AGE, CML, CEL, and MG-H1. Each section includes median intake values, the number of events, and percentages. The models adjust for various covariates, and the table shows the OR and 95% CI for each model. Notable trends include significant associations between high intake of dietary AGE Z-score, CEL, and MG-H1 with the prevalence of sarcopenia, but no association was found for CML. For each quartile increment in dietary AGE Z-score, CEL, and MG-H1, the OR for the prevalence of sarcopenia is also provided. The table provides a detailed comparison of how different levels of dietary AGE intake relate to sarcopenia prevalence, adjusted for multiple covariates.
AGE, advanced glycation end product; ALMI, appendicular lean BMI; CML, Nϵ-carboxymethyl-L-lysine; CEL, (1-carboxyethyl) lysine; MG-H1, Nδ-(5-hydro-5-methyl-4-imidazolon-2-yl)-ornithine; NHANES, National Health and Nutrition Examination Survey.
Conditional logistic regression models were used to calculate the OR (95 % CI).
Crude model was adjusted for none.
Model 1 was Crude model.
Model 2 was adjusted for age, sex, race/ethnicity, BMI, ratio of family income to poverty, education level, marital status, smoking status, protein intake, HbA1c level and physical activity.
Model 3 was adjusted for model 2 + depression, chronic kidney disease, congestive heart failure and dietary energy.
T1, 0–25th percentile; T2, 25th–75th percentile; T3, above 75th percentile. Bold text indicates P < 0·05.
The row labeled ‘Continuous (per IQR increase)’ presents the adjusted odds ratio (and 95 % CI) for sarcopenia associated with each interquartile range increase in the respective dietary AGE variable.
For different food groups, in comparison to the low intake group, the adjusted OR (95 % CI) for sarcopenia associated with high intake of dietary AGEs Z-score, CML and MG-H1 derived from meat and meat products was 1·47 (1·03, 2·11), 1·45 (1·04, 2·04) and 1·55 (1·06, 2·25), respectively. High intake of CML, CEL and MG-H1 derived from baked foods was associated with sarcopenia, with adjusted OR (95 % CI) of 1·67 (1·15, 2·42), 1·55 (1·01, 2·37), 1·53 (1·02, 2·28), respectively. In contrast, high intake of dietary AGE from egg and egg products was inversely associated with sarcopenia, with adjusted OR (95 % CI) of 0·61 (0·41, 0·91), 0·70 (0·54, 0·90), 0·70 (0·54, 0·90) and 0·69 (0·53, 0·90), respectively (Figure 1).
Association of dietary AGE derived from different food sources with risk of sarcopenia. Logistic regression was used to investigate the associations of dietary AGE (a), CML (b), CEL (c) and MG-H1 (d) from different types of food with the incidence of sarcopenia, with OR and 95 % CI shown. This analysis used the same fully adjusted covariates as in model 3 of Table 3. AGE, advanced glycation end product; CML, Nϵ-carboxymethyl-L-lysine; CEL, (1-carboxyethyl) lysine; MG-H1, Nδ-(5-hydro-5-methyl-4-imidazolon-2-yl)-ornithine.

Figure 1 Long description
Panel A: The vertical bar graph shows the association of dietary AGE with the risk of sarcopenia. The x-axis represents different food items, and the y-axis represents the odds ratio (OR) with a 95 percent confidence interval (CI). The graph includes food items such as meat and meat products, milk and dairy products, baked foods, bean and nut products, fruits and vegetables, oil and condiments, potatoes and their products, cereal and cereal products, candy, beverages, eggs and egg products, soup, and seafood. Notable trends include a significant association of meat and meat products and eggs and egg products with the risk of sarcopenia. Panel B: The vertical bar graph shows the association of CML with the risk of sarcopenia. The x-axis represents different food items, and the y-axis represents the odds ratio (OR) with a 95 percent confidence interval (CI). The graph includes food items such as meat and meat products, milk and dairy products, baked foods, bean and nut products, fruits and vegetables, oil and condiments, potatoes and their products, cereal and cereal products, candy, beverages, eggs and egg products, soup, and seafood. Notable trends include a significant association of meat and meat products and baked foods with the risk of sarcopenia. Panel C: The vertical bar graph shows the association of CEL with the risk of sarcopenia. The x-axis represents different food items, and the y-axis represents the odds ratio (OR) with a 95 percent confidence interval (CI). The graph includes food items such as meat and meat products, milk and dairy products, baked foods, bean and nut products, fruits and vegetables, oil and condiments, potatoes and their products, cereal and cereal products, candy, beverages, eggs and egg products, soup, and seafood. Notable trends include a significant association of baked foods and eggs and egg products with the risk of sarcopenia. Panel D: The vertical bar graph shows the association of MG-H1 with the risk of sarcopenia. The x-axis represents different food items, and the y-axis represents the odds ratio (OR) with a 95 percent confidence interval (CI). The graph includes food items such as meat and meat products, milk and dairy products, baked foods, bean and nut products, fruits and vegetables, oil and condiments, potatoes and their products, cereal and cereal products, candy, beverages, eggs and egg products, soup, and seafood. Notable trends include a significant association of meat and meat products, baked foods, and eggs and egg products with the risk of sarcopenia.
The mediating effect of bone mineral density and serum 25 (OH) D3
The mediating effects of BMD and serum 25 (OH) D3 on the association between dietary AGE intake and ALMI were −0·29 (P < 0·05) and −0·25 (P < 0·05), respectively, with mediation proportions of 14·75 % and 12·95 %, respectively (Figure 2).
Mediation effects of bone density and serum vitamin D3 levels on the association between dietary AGE intake and ALMI from NHANES 2011–2018. The mediation analysis was performed using linear regression models and the RMediation package in fully adjusted model. Estimates for the mediation effect with their significance levels (P values) and the proportion mediated are shown. This analysis used the same fully adjusted covariates as in Model 3 of Table 3. AGE, advanced glycation end product; ALMI, appendicular lean BMI; NHANES, National Health and Nutrition Examination Survey.

Discussion
In this nationally representative sample of USA adults aged 20–59 years old, we found that higher intake of dietary AGEs, CEL and MG-H1 was positively correlated with sarcopenia, and that dietary AGE from meat and baked foods showed the strongest associations. In addition, BMD and serum 25 (OH) D3 were identified as significant mediators in this association. Although our findings suggest a positive association between dietary AGEs intake and sarcopenia, longitudinal studies are necessary to clarify its role in the development of sarcopenia.
In recent decades, a nutritional transition to a ‘Western diet’ is also associated with increased intake of dietary AGE(Reference Gottumukkala and Shakappa23). The associations between dietary AGE intake and sarcopenia need to be fully explored. AGE accumulation measured by skin autofluorescence was positively associated with the prevalence of sarcopenia in Japanese with type 2 diabetes(Reference Mori, Kuroda and Ishizu7) and in Chinese elderly population(Reference Zhang, Chen and Li24). Dietary AGE assessed by FFQ and food databases were cross-sectionally associated with a higher prevalence of sarcopenia in the Dutch population(Reference Waqas, Chen and Lu11), which aligns with our research findings. This study primarily investigates the association between dietary AGE and sarcopenia. It should be noted that significant overlap exists between sarcopenia and frailty in terms of clinical phenotypes and pathophysiological mechanisms(Reference Carmeli25,Reference Mori and Tokuda26) . Therefore, the positive correlation observed in this study between higher dietary AGE intake and sarcopenia provides a clue for exploring the potential role of dietary AGE in frailty. Future research is needed to directly assess the longitudinal association between dietary AGE and frailty, as well as to explore the potential for relevant interventions.
We further found that dietary AGE from meat and baked foods showed the strongest positive associations with sarcopenia; notably, these associations remained significant after adjustment for total dAGE intake. This pattern may be explained by two main features of the western diet, namely the high consumption of red and processed meats and the high intake of added sugars(Reference Clemente-Suarez, Beltran-Velasco and Redondo-Florez27), such as table sugar in baked goods, which undergo a Maillard reaction during thermal processing (grilling, baking and frying), resulting in the formation of higher levels of AGE(Reference Twarda-Clapa, Olczak and Białkowska6,Reference Jansen, Fogliano and Rubert28) . The adoption of a low-temperature cooking diet and wet environments, such as boiling, poaching, stewing and steaming, in addition to low pH, can reduce the formation of AGE in meats(Reference Uribarri, Woodruff and Goodman29,Reference Poulsen, Hedegaard and Andersen30) . Thus, modifying cooking techniques to reduce AGE formation could be a feasible dietary strategy. If the observed association is causal, this approach might help mitigate sarcopenia risk in the long term. Nevertheless, further randomised clinical trials are required to confirm this hypothesis.
An interesting finding of this study is the inverse association between dietary AGE derived from eggs and egg products and sarcopenia. This appears to contradict the general narrative that dietary AGE may be detrimental. Several non-exclusive mechanisms could explain this observation. First, eggs are a rich source of high-quality protein, leucine and other essential nutrients (e.g. vitamin D, choline), which are crucial for muscle protein synthesis and maintenance(Reference Santos, Gomes and Schoenfeld31). The beneficial effects of these nutrients on muscle health may counteract or outweigh the potential adverse effects of the concomitant AGE present in eggs. Second, compared with meat or baked goods, the specific types or molecular structures of AGE formed in eggs under typical cooking conditions may possess lower bioavailability or pro-inflammatory activity, this needs to be further clarified. Third, egg consumption might be a marker of a generally healthier overall diet or lifestyle pattern that was not fully accounted for in our analysis.
One previous study had shown serum AGE levels in patients with osteoporosis was negatively correlated with BMD(Reference Ge, Jie and Yao32), which may be owing to that AGE can disrupt the function of osteoblasts by inducing cellular iron death. Another study found that pentosidine displayed an inverse association with spine BMD in Mexican(Reference Ferreyro-Bravo, Ceballos-Cruz and Urruchua-Rodriguez33). An animal study also found that high AGE intake reduced trabecular BMD in female mice(Reference Illien-Junger, Palacio-Mancheno and Kindschuh17). An inverse association between AGE estimated by skin autofluorescence and serum 25 (OH) D3 has also been reported, which may be owing to vitamin D’s effects on inhibiting AGE accumulation through anti-oxidative and anti-inflammatory properties(Reference Chen, van der Duin and Campos-Obando18). Moreover, the level of serum 25 (OH) D3 was associated with muscle mass and physical performance(Reference Vaes, Brouwer-Brolsma and Toussaint34–Reference Houston, Cesari and Ferrucci36). Our mediation analyses found that BMD and serum 25 (OH) D3 partially mediated the association between dAGE and ALMI. Further mechanistic studies are required to clarify the roles of BMD and serum 25 (OH) D3 in regulating the associations between dAGE and ALMI.
Several biological mechanisms may help explain the observed association between dietary AGE and sarcopenia: First, intracellular damage to muscle cells linked to inflammation triggered by AGE binding to RAGE(37). Second, enhancement of intramuscular collagen accumulation through non-enzymatic cross-linking of AGE, which can result in stiffening of the skeletal muscle extracellular matrix(38). Third, AGE may induce skeletal muscle atrophy by activating a RAGE-mediated, AMPK-down-regulated, Akt pathway(Reference Chiu, Yang and Sheu39). Last but not the least, AGE might directly induce sarcopenia via inducing apoptosis(Reference Huang, Shang and Wan40). While the cited mechanistic studies primarily describe the biological effects of AGE in general, the exogenous AGE from diet are a major source of systemic AGE and are hypothesised to be a significant contributor to these pathways in the context of chronic, diet-related exposure.
The strengths of our study included that it was the first to investigate the association between dietary AGE from different food sources and sarcopenia with a relatively large sample size aged < 60 years old. In addition, the UPLC-MS method was used to more accurately assess dietary levels of CML, CEL and MG-H1. However, there are several limitations. First, owing to limitation of data, we could not explore the association between dietary AGE intake and the risk of sarcopenia in old populations, who have a higher prevalence of sarcopenia. Second, it is impossible to infer causality because of the cross-sectional design, although we showed a significant association between dietary AGE and sarcopenia. Third, this study may have recall bias because the dietary data from NHANES database was self-reported, also differences in cooking conditions and individual preferences for food doneness may affect our estimates of dietary AGE.
In conclusion, dietary AGE intake was positively associated with the prevalence of sarcopenia, with dietary AGE from meat and baked foods showing the strongest associations. BMD and serum 25 (OH) D3 were identified as partial mediators in the association between dietary AGE intake and sarcopenia. Further longitudinal studies are needed to examine the prospective associations between dietary AGE intake and the risk of sarcopenia.
Supplementary material
For supplementary material/s referred to in this article, please visit https://doi.org/10.1017/S0007114526106813
Acknowledgements
This study was supported by the National Natural Science Foundation of China (Grant No. 82473629&82073535), the Priority Academic Program Development of Jiangsu Higher Education Institutions (PAPD).
Z. W., Li-Qiang Qin, W. Z. and D. L. designed the study; W. Z. and D. L. performed the statistical analyses; W. Z. and D. L. drafted and M. Z., S. Y., Li-Qiang Qin and Z. W. revised the manuscript; Z. W. and Li-Qiang Qin supervised the data analysis and interpretation; Z. W. had the primary responsibility for the final content. All authors critically reviewed the manuscript and approved the final draft.
The authors declare no conflicts of interest.
The dataset analysed in this study is available on the NHANES’ official website (https://www.cdc.gov/nchs/nhanes/index.htm).