Introduction
Natural disasters have the potential to inflict devastating consequences on affected regions. From 1990-2013, approximately 4.8 billion people globally were affected by natural disasters, with a toll of 1.6 million deaths, 5.3 million injuries, and 109 million losing their homes. Reference Ciottone, Biddinger and Darling1 Additionally, the number of people affected by natural disasters has been trending upwards. From 1981 through 1990, an average of 147 million people per year were affected by natural disasters, increasing to 211 million people per year from 1991 through 2000. Reference Wisner and Adams2 Further research into the health effects of disasters is warranted as natural disasters are affecting denser population centers and requiring increasing costs for recovery. 3
The health system’s role around disasters is more frequently reactive than proactive and preventative. Inadequate preparation for these natural disasters can lead to potentially preventable casualties, damage to infrastructure, and depletion of resources. In the wake of a disaster, survivors can be affected by acute and chronic health problems exacerbated by lack of basic resources such as water, food, electricity, and housing. Reference Redlener and Reilly4
For example, Hurricane Katrina (2005) caused an estimated 1,200 deaths with approximately USD$108 billion in property damage. 5 Even more consequential, hurricanes can inflict damage on a national scale, as in the case of the country-wide intravenous fluid shortage after Hurricane Maria devastated Puerto Rico and the Baxter International manufacturing plant in 2017. Reference Mazer-Amirshahi and Fox6 More locally, tropical cyclones can dirty drinking water, decrease access to medical care, and increase the risk of food insecurity. Reference Wisner and Adams2 A recent study also found a decrease in pharmacy functionality after hurricanes, thus increasing the risk of exacerbations of acute or chronic diseases. Reference Sharpe and Clennon7
Literature in Disaster Medicine, particularly post hurricanes, usually focuses on the effects of natural disasters after a single event, and usually does not show a trend in whether the state is doing better or worse after each event. Reference Mongin, Baron, Schwartz, Liu, Taioli and Kim8 Current literature also focuses on acute conditions, such as acute coronary syndrome, with less attention paid to exacerbations of chronic conditions (eg, congestive heart failure [CHF] or chronic obstructive pulmonary disease [COPD]). Reference George-McDowell, Landron and Glenn9–Reference Keenan, Marshall, Nocera and Runyan12 Research regarding the effects of hurricanes on patients with chronic disease is limited. The few reported studies are retrospective or qualitative reviews which suggest that hurricanes can exacerbate symptoms of mental illness, diabetes, and kidney failure. Reference Dunne-Sosa and Cotter13–Reference Espinel, Kossin, Galea, Richardson and Shultz18 There is a significant lack of information regarding CHF exacerbations post hurricanes, despite this being one of the most common reasons for hospital admissions for patients over 65 years of age at baseline in the United States. Reference Hall, Leavant and DeFrances19 Babaie, et al in 2021 published a systematic review on cardiovascular diseases after storms (hurricanes, typhoons, and cyclones) that shows an increase in fatality caused by acute myocardial infarctions that could be attributed to an increase in unemployment, temporary housing, stress, and access to health care and medications caused by the storms. Reference Babaie, Asl, Naghipour and Faridaalaee20
This study focuses on tropical cyclones, as they are repetitive events in regions of the Southeast United States. This study analyzes CHF discharges in Florida (USA) post tropical cyclones from 2007 through 2017.
Methods
This is a retrospective longitudinal time series analysis of hospital CHF discharges across Florida using the publicly available Healthcare Cost and Utilization Project database (HCUP). 21 Patients with International Classification of Disease (ICD) versions 9 and 10 codes for CHF were included. 22,23 The target population was defined as all patients admitted to the hospital in the state of Florida from January 2007 through December 2017 due to CHF. This study was reviewed by the Harvard Institutional Review Board (Cambridge, Massachusetts USA) and was determined as non-human subject research (Protocol number: IRB19-1442).
Data Sources
Healthcare Cost and Utilization Program (HCUP)—The dependent variable of primary interest was in-patient discharge data for congestive heart failure (CHFdc) patients from January 2007 through December 2017, as captured in the publicly available HCUP database sponsored by the Agency for Health Research and Quality (AHRQ; Rockville, Maryland USA). 21 This database is derived from administrative data collected for billing purposes, validated internally through quality control procedures, and used in publication. 24,Reference Mutter and Stocks25 The State In-patient Databases (SID) that “encompass more than 95 percent of all US hospital discharges” was used for analysis. 21 The SID database contains diagnostic codes and the quarter of the year of discharge for each patient admitted to the hospital. The database does not specify the day or month of admission. Thus, quarter was used instead as the time increment unit in these analyses. Quarter was classified as follows: first quarter was from January through March; second quarter was from April through June; third quarter was from July through September; and fourth quarter was from October through December. Other information such as age, gender, and race were used as covariates in analyses. General statistics for CHFdc and predictor variables are shown in Table 1.
General Statistics of Dependent and Predictor Variables.

Abbreviations: CHF, congestive heart failure; Percent ILI, percent of influenza-like illness reported; SD, standard deviation; Min, minimum value; Max, maximum value.
National Hurricane Center—Information about tropical cyclones was obtained from the National Hurricane Center (Miami, Florida USA) and Central Pacific Hurricane Center’s (Honolulu, Hawaii USA) Tropical Cyclone Reports. 26 Tropical cyclones that had data for Florida in the reports were included in the study, whether or not the cyclones made landfall. Tropical cyclones were aggregated into the quarter of the year they occurred, and the frequency of the cyclones per quarter was calculated. The maximum sustained wind speed (in knots) was obtained from the reports as well.
Influenza Surveillance Reports—Reported incidence of influenza-like illness (ILI) was used as a regressor, as previous studies showed a correlation between CHF exacerbations and influenza. Reference Kytömaa, Hegde and Claggett27,Reference Panhwar, Kalra and Gupta28
This study uses the Influenza Surveillance Reports from the Center for Disease Control and Prevention (Atlanta, Georgia USA) to obtain data collected by out-patient providers with reports of symptoms of ILI. 29 The weekly reported data were binned into quarter and the average was calculated for use in analysis.
Florida Temperature—The average state-wide monthly temperature of Florida (in degrees Fahrenheit) was obtained from the Florida Climate Center (Tallahassee, Florida USA) and was added as a regressor in the model, as previous studies showed a correlation with extreme temperatures, particularly lower temperatures, and CHF exacerbation. Reference Fares30–32 The average temperature was aggregated into quarters and calculated as the average per quarter for use in analysis.
International Classification of Diseases (ICD) Codes for Cardiac Conditions
Discharges of patients with CHF were obtained by using diagnosis codes codified as the ICD. The ICD version 9 was used for admissions before the fourth quarter of 2015 and the ICD version 10 codes were used from the fourth quarter of 2015 onwards. For ICD-9, codes that started with 428 were included. For ICD-10, codes that started with I50 were included.
ICD Code Change
Graphical analysis of the raw time series data of CHF discharges by quarter showed an abrupt and constant higher elevation of number of CHF discharges for the fourth quarter of 2015 onwards relative to the earlier epoch. This numeric change is likely a reflection of the changes in ICD codes from version 9 to version 10 during the fourth quarter of 2015. Such a numeric change can distort the estimation of autocorrelation, and so ideally, it is recommended that the autocorrelation be estimated only on the timepoints before such a change. However, in order to increase the number of timepoints available for this analysis, the effect of the code switch was instead pre-removed, by subtracting from the fourth quarter of 2015 onwards 6,000 discharges per quarter, an estimate of the average quarter increase due to the coding change, based on a general linear regression model.
Quarter
There was a strong and consistent effect of the quarter that patients were discharged apparent in preliminary graphical analysis. This could contaminate and obscure other effects, especially the autocorrelation effects. In order to account for this, three orthogonal dummy coded contrast indicators were coded and entered into the model as regressors making “Quarter” effectively a four-level categorical predictor with three degrees of freedom: the contrasts were “Season” contrasting the combined quarters one and four versus the combined two and three (“WinFall” [Winter and Fall] contrasting quarters one versus four and “SpringSum” [Spring and Summer] contrasting quarters two versus three).
Statistical Analysis
The autoregressive integrated moving average (ARIMA) model Reference Box33,Reference Locascio, Jennings, Moore and Corkin34 was used to adjust for potential autocorrelated errors typically found in time series data, using the statistical software University Edition SAS Program (Version 9.4M6; SAS Institute Inc.; Cary, North Carolina USA; the ARIMA Procedure) with conditional least-squares estimates for coefficients.
A small number of ARIMA model variations were tested for best fit, defined as having the least evidence of autocorrelation among model residuals, and statistically significant autocorrelation predictor terms. The first ARIMA model presented below was obtained by first running a model with all regressors of interest and covariates but with no autoregressive (p) or moving average (q) autocorrelation correction, or “ARIMA(0,0,0)” in standard notation. Graphical analysis showed clear evidence of nonstationary time change (increase in CHFdc with time), but rather than crudely transforming the dependent variable to differences in CHFdc from adjacent timepoints as a means of eliminating the non-stationarity, linear time was included as an additional predictor as well as the square of linear time as there was graphical evidence of a slight upward acceleration with time.
For this initial model, the following regressors and covariates were used: the three orthogonal binary indicator variables for quarter, average temperature of Florida, a linear and squared time function, concurrent percent incidence of ILI, lag of one quarter of the percent incidence of ILI, frequency of tropical cyclones, lag of one quarter of the frequency of tropical cyclones, maximum cyclone wind speed, and lag of one quarter of the maximum cyclone wind speed. Autocorrelation Function (ACF) and the Partial Autocorrelation Function (PACF) correlogram graphs for the residuals were used to add appropriate p and q terms to improve the fit of the model. For the final model, regressors that were not significant were backward eliminated for better fit of the model.
Results
This study identified 3,372,993 patients discharged from hospitals in Florida with CHF from 2007 through 2017. Forty nine percent of the patients were female, and the average age ranged from 72.2 to 73.9 years. Racial distribution of the population was as follows: 69.69% White, 15.96% Black, 11.55% Hispanic, 0.50% Asian, 0.11% Native American, 1.67% Other, and 0.53% with no reported race.
Overall mortality ranged from 4.3% to 6.4% with no significant difference in mortality among quarters. The length-of-stay in the hospital ranged from 6.78 days to 7.61 days. An independent samples t-test showed a significant difference (P = .002) in the length-of-stay between quarter two (mean = 7.19; SD = 0.19) and quarter four (mean = 6.92; SD = 0.12).
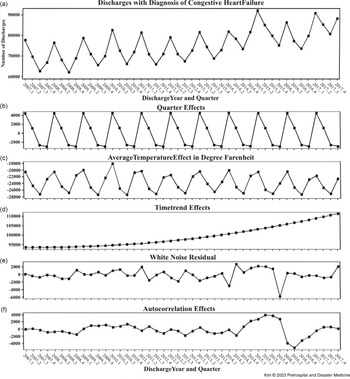
Total CHF discharges fluctuated every year with peak discharges from October through December and nadiring from April through June. There was also an overall increasing trend of CHF discharges over time with an accelerating shift upwards from the third quarter of 2014. Figure 1 shows the CHF discharges over time after the removal of ICD change augmentations from the discharges.
Graphical Representation of the ARIMA Model Partialed by Effect Estimates.
Note: (1A) CHF discharge by quarter after removal of ICD change augmentations. ARIMA model partialed effect estimates of (1B) quarter effects, (1C) average temperature, (1D) time trend effect (linear time effect plus time squared effect; the intercept added into panel arbitrarily), (1E) white noise residual, and (1F) autocorrelative effects (CHF discharge subtracted by above variables, including intercept). Note that for each given timepoint, the components in Panel B through Panel F sum to the corresponding timepoint value in Panel A.
Abbreviations: ARIMA, autoregressive integrated moving average; CHF, congestive heart failure; ICD, International Classification of Disease.

The Pearson’s correlation matrix for model predictor variables, as shown in Table 2, shows significant correlation among variables. Of note, the “season” variable is highly correlated with the average temperature of Florida, percent of ILI reported, frequency of cyclones in a quarter, and the maximum windspeed in a quarter. The average temperature of Florida was also highly correlated with percent of ILI reported, frequency of cyclones in a quarter, and the maximum windspeed in a quarter. Also, the percent of ILI reported was correlated with frequency of cyclones in a quarter and the maximum windspeed in a quarter.
Pearson’s Correlation Matrix of All Predictor Variables.

Note: The first value in each table is the Pearson correlation coefficient and the second value underneath are the P values. CHFdc is the discharges due to CHF prior to any removal of ICD change augmentations; season, Win-Fall, and Spring-Sum are orthogonal dummy coded contrasts among quarters; avg-temp is average temperature of Florida each quarter; time is the code for the linear time term; timesq, the squared time value; pILI is the percentage of influence-like illness reported each quarter; Cnt-Cyclone is the number of cyclones affecting Florida in each quarter; Mx-Cyclone is the highest cyclone windspeed in knots in each quarter; “lag” represents the previous quarter of the indicated variable.
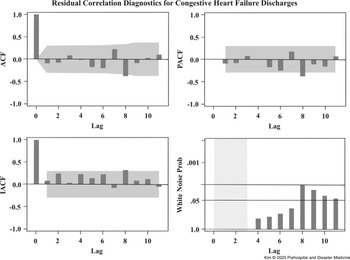
The first ARIMA model showed significant residual deviation from white noise, which indicated significant autocorrelation. Based on the ACF and PACF correlograms, the initial best fit model was ARIMA(3,0,0). Among the concurrent and lag regressors (percent incidence of ILI, frequency of tropical cyclones, maximum cyclone wind speed), regressors that had less significance were backward eliminated from the initial ARIMA(3,0,0) model. The covariates were further backward eliminated to fit the model better. The following covariates were included in the final model, regardless of statistical significance, in order to adjust for the extraneous factors affecting CHFdc data: three orthogonal categorical variables for quarter, and a linear and squared time function.
The regressors of the final model were the three orthogonal indicators for quarter, average temperature of Florida, a linear and squared time function, and the percent incidence of ILI. With this new set of regressors, a final best fit model was found with an autoregressive term of three, or ARIMA(3,0,0).
The final retained ARIMA model (Table 3 and Figure 2) showed no significant adjusted relation between CHF discharges and the following regressors of interest and their lag variables: percent of ILI reported, frequency of tropical cyclones in a quarter, or maximum tropical cyclone windspeed.
ARIMA (3,0,0) Model Data

Note: (A) Conditional least squared estimation of the ARIMA model. AR represents autoregression value. (B) Autocorrelation check for residuals of the final model. DF represents degree of freedom.
Graphical Representation of the ARIMA (3,0,0) Residual Correlation Diagnostics for the Dependent Variable CHF Discharges.
Note: ARIMA (3,0,0) model data. Graphical representation of residual correlation diagnostics for the dependent variable CHFdc (CHF discharges with the pre-removed values for ICD code change).
Abbreviations: ACF, autocorrelation function; PACF, partial autocorrelation function; IACF, inverse autocorrelation function; CHF, congestive heart failure; ICD, International Classification of Disease; ARIMA, autoregressive integrated moving average.

Significant adjusted relations with CHF discharge were found with the orthogonal categorical variables of “WinFall” and “SpringSum” but not for “season.” The “WinFall” variable was significant (P <.0001) with an estimate of 3,757.9 (SE = 375.4) more CHF discharges in quarter one than quarter four. The “SpringSum” variable was significant (P ≤.0001) with an estimate of 1,912.3 (SE = 372.7) more CHF discharges in quarter two than quarter three (Figure 1).
There was also a significant relation with the average temperature of Florida (P <.001) with approximately 331.8 less CHF discharges (SE = 91.7) per degree of increase in temperature. Graphical representation of the effects estimates from the ARIMA model is shown in Figure 1. Figure 3 shows a graphical representation of the correlation between CHFdc and the average temperature in Florida. The quadratic effect of time was significant (P = .0042), reflecting a gradually accelerating increase in CHF discharges as time went on (Figure 1): the linear time term was not significant, but in the presence of the squared time term, the linear term merely serves to locate the curve laterally and does not index overall linearity, which would have probably been significant in the absence of the squared term, though the overall fit would have been slightly degraded by taking out the quadratic term.
Graphical Representation of the Correlation between CHF Discharges and Temperature.
Note: Average temperature of Florida (USA) blind to time.
Abbreviation: CHF, congestive heart failure.

Discussion
This study sought to analyze the correlation between tropical cyclones and CHF in order to better understand the effects of natural disasters on chronic disease. The results show that there are no significant relations between storm frequency or maximum storm winds speed and CHF discharges in Florida. This result could be interpreted in different ways.
One interpretation is that tropical cyclones have no effect in exacerbating CHF. However, this is unlikely given the plethora of ways that a tropical cyclone, particularly hurricanes, could affect the access to basic transportation, nutrition, medications, and health care. It is also possible that tropical cyclones overall may not affect CHF discharges, but the frequency of more intense storms such as tropical storms or hurricanes (excluding tropical depressions) may cause increased exacerbations of CHF.
Another interpretation is that Florida is able to efficiently mitigate and prevent any surplus CHF discharges due to tropical cyclones. This could be due to the improved awareness and changes in policies regarding hurricane preparedness, particularly after hurricane Katrina’s devastating consequences. The Post-Katrina Emergency Management Reform Act of 2006 was passed through Congress leading to major reforms in emergency management. In summary, the reform included clearer definitions of the authority of the Federal Emergency Management Agency (Washington, DC USA), new leadership organization, strategies for increasing human capital in disaster response, better national preparedness systems, more accountability and oversight by the Department of Homeland Security Office of Inspector General (Washington, DC USA), and more. Reference Bea, Halchin and Hogue35
Consistent with the literature, CHF discharges were increased with colder temperatures. However, the incidence of ILI was not significantly related to CHF discharges despite literature evidence, likely due to the limitations of this study.
Limitations
This study has limitations that should be considered in interpretation. First of all, as the HCUP dataset for Florida does not contain information regarding admissions, this study used discharge data as a proxy for hospital flow. This also means that patient fatality from admission or prehospital mortality is not accounted for with this method of analysis.
Another significant limitation of this study is the generalization of the data available for analysis. Using data from the whole state of Florida rather than the specific counties that were directly affected by the cyclones could wash out significant signals. Additionally, tropical cyclones can take various paths and affect different parts of Florida, with no two cyclones being equal in severity and damage. A more focused regional analysis over time may provide more robust information, particularly with more clarity on specific post tropical cyclone infrastructure damages.
The lack of correlation could also be due to the aggregation of data into quarters rather than months or days. Given that the HCUP dataset reported discharges by quarter, the regressors and covariates were binned and averaged in quarters. Therefore, effects due to cyclones on CHF may be masked by averaging out the data. For example, from aggregated data from Babaie, et al in 2021, cardiovascular disease incidence increased significantly in the first week after a flood, then decreased, but then peaked again with a second wave in the seventh week. Reference Babaie, Asl, Naghipour and Faridaalaee20 A more granular data source may better elucidate heart failure patterns post tropical storms that may have been washed out by these methods.
Relatedly, though the dataset captures information for over 95% of discharges in the United States, it lacks the granularity of time points needed for more detailed analysis. This study looks at the discharge data for one decade. Yet, discharge data are only available in quarters, yielding a total of 44 datapoints available for use in the ARIMA model. It is generally recommended that a minimum of 50 data points are used for the ARIMA model. Reference Ahmad Lone36 This leads to a lack of granularity that may be needed to fully elucidate how natural disasters, in this case tropical cyclones, affect CHF discharges.
Multicollinearity of the regressors and covariates could be an issue as well. The high correlation between independent variables can undermine the statistical significance of the variables. However, the variables this study uses occur in very similar times of the year. For example, hurricane season is from the beginning of June through the end of November. Yet during that period, the average temperature usually drops and the incidence of ILI usually increases. Perhaps a more granular dataset looking into the months or days of admissions would be better able to parse out the nuanced seasonal variables.
Further work is still warranted to improve management of the chronically ill during and after natural disasters. Future analysis of tropical cyclones and CHF should strive to include a more granular dataset so that the time series data can be better modeled. Although literature exists for the effects of hurricanes on diabetes, mental illness, and kidney disease, further research is needed to include other chronic disease processes such as COPD, neurodegenerative disease (particularly patients with dementia who require close coordination and follow up), access to dialysis, and more.
Conclusion
The goal of this study was to further add to the research of the vulnerable chronically ill populations affected by natural disasters, particularly in discharged patients with CHF in tropical storms. This study suggests that with the current methods and the HCUP dataset, there is no significant increase in overall CHF discharges in Florida as a result of recent previous cyclone occurrences.
Conflicts of interest/funding
IK, RS, AH, GC, and JL report no conflicts of interest. Funding from Beth Israel Deaconess Medical Center, Disaster Medicine Fellowship. Presentation as an ePoster, Society of Academic Emergency Medicine Conference 2020.
Author Contributions
IK: Concept and design, acquisition of data, analysis and interpretation, drafting and revision of manuscript.
RS, AH, GC: Concept and design, data interpretation, drafting and revision of manuscript.
JL: Statistical expertise in concept and design, data interpretation, drafting and revision of manuscript.