Implications
The aim of this study was to characterize sheep milk produced in the traditional way in the mountain and highland (H) areas of the Alpine region of Slovenia. The fatty acid (FA) profile in sheep milk was determined during the pasture season according to different pasture altitude. The results suggest a beneficial FA profile of sheep milk from the mountain and H pastures as compared to lowland pastures. Traditional grazing management could be a useful strategy in obtaining high-quality dairy products that encourage sheep breeders to continue with mountain grazing management in the Alps.
Introduction
The FA profile of milk and its dairy products can be changed by the feeding system (Atti et al., Reference Atti, Rouissi and Othmane2006; Biondi et al., Reference Biondi, Valvo, Di Gloria, Scinardo Tenghi, Galofaro and Priolo2008). In most cases, appropriate feeding systems are used to increase the content of highly valuable FA in milk (Atti et al., Reference Atti, Rouissi and Othmane2006; Morand-Fehr et al., Reference Morand-Fehr, Fedele, Decandia and Le Frileux2007; Biondi et al., Reference Biondi, Valvo, Di Gloria, Scinardo Tenghi, Galofaro and Priolo2008; Ostrovský et al., Reference Ostrovský, Pavlíková, Blaško, Górová, Kubinec, Margetín and Soják2009; Revello Chion et al., Reference Revello Chion, Tabacco, Giaccone, Peiretti, Battelli and Borreani2010). Most sheep milk studies have investigated differences in the FA composition of milk from ewes raised indoors (by various feeding regimes) or grazed on pasture (Atti et al., Reference Atti, Rouissi and Othmane2006; Biondi et al., Reference Biondi, Valvo, Di Gloria, Scinardo Tenghi, Galofaro and Priolo2008; De Renobales et al., Reference De Renobales, Amores, Arranz, Virto, Barrón, Bustamante, Ruiz de Gordoa, Nájera, Valdivielso, Abilleira, Beltrán de Heredia, Pérez-Elortondo, Ruiz, Albisu and Mandaluniz2012). Grazing is the most natural method of sheep milk production, with the best potential for high-quality milk due to the high proportion of some polyunsaturated FA (PUFA) in green grass (Atti et al., Reference Atti, Rouissi and Othmane2006; Biondi et al., Reference Biondi, Valvo, Di Gloria, Scinardo Tenghi, Galofaro and Priolo2008; Revello Chion et al., Reference Revello Chion, Tabacco, Giaccone, Peiretti, Battelli and Borreani2010). The milk of grazed ewes contains less atherogenic and thrombogenic saturated FA (SFA) (lauric, myristic and palmitic acids) and more CLA, as well as n-3 PUFA, than that of indoor fed ewes (Atti et al., Reference Atti, Rouissi and Othmane2006; Biondi et al., Reference Biondi, Valvo, Di Gloria, Scinardo Tenghi, Galofaro and Priolo2008). The benefits of some PUFA on human health include anti-carcinogenic, anti-atherogenic, anti-diabetic properties and immune system enhancement (Cook and Pariza, Reference Cook and Pariza1998; Wright et al., Reference Wright, McBride and Holub1998). Likewise, the amount of beneficial n-3 PUFA and CLA in milk depends on several factors, such as seasonal changes (Mel’uchová et al., Reference Mel’uchová, Blaško, Kubinec, Górová, Dubravská, Margetín and Soják2008), botanical composition and the phenological stage of the grass (Cabiddu et al., Reference Cabiddu, Decandia, Addis, Piredda, Pirisi and Molle2005) growing in pasture. The milk FA profile is affected by the botanical composition (Collomb et al., Reference Collomb, Bütikofer, Sieber, Jeangros and Bosset2002a) and/or pasture altitude (Bugaud et al., Reference Bugaud, Buchin, Coulon and Hauwuy2001a; Collomb et al., Reference Collomb, Bütikofer, Sieber, Jeangros and Bosset2002b). Both effects have been studied mainly in relation to the FA profile of cow milk, whereas sheep milk has only been included to a lesser extent (Mel’uchová et al., Reference Mel’uchová, Blaško, Kubinec, Górová, Dubravská, Margetín and Soják2008).
In the Alpine region located in the northwest of Slovenia sheep rearing on mountain pastures is an ancestral tradition. The indigenous Bovec sheep are widespread there. Bovec sheep are well adapted to the rough high-mountain rearing conditions and are able to produce a considerable milk yield (~234 kg in 191 days of lactation) based on meagre feed. Nowadays, the breed is mainly kept to produce milk for Bovec cheese and is still reared under traditional extensive conditions (Feldman et al., Reference Feldman, Bietzker and Mendel2005). Lambing occurs from January to March. The milking season starts in April or May, when the vegetation period begins. At the beginning of the vegetation period, the sheep graze on lowland pastures near the sheep pens. Subsequently, they are gradually moved to higher mountain pastures, until they reach the H pastures at 2200 m above sea level.
A few studies have reported the FA composition of cow milk in relation to pasture altitude (Collomb et al., Reference Collomb, Bütikofer, Sieber, Jeangros and Bosset2002a; Reference Collomb, Bütikofer, Sieber, Jeangros and Bosset2002b) but to the best of our knowledge, there have been no studies on the FA composition of sheep milk produced at different pasture altitudes. Furthermore, there are no data about the characteristics of Bovec sheep milk. Therefore, it is of great importance to provide scientific evidence of the advantages and benefits of grazing in this area in order to relate mountain and H grazing management to sheep milk quality. The aim of this work was to determine the FA profile of sheep milk produced during the grazing season in four geographical areas and, consequently, to investigate the effect of pasture altitude on the FA profile of sheep milk.
Material and methods
Flock monitoring and sampling design
The study was conducted in natura under the usual rearing system and appropriate management of the flock in the Alps (northwestern Slovenia). According to the traditional rearing system in the area, sheep are housed on lowland farms during wintertime and, during the vegetation period, they are on all-day mountain grazing. The dairy sheep flock (a total of 120 sheep) was monitored during the grazing period. In all, 15 ewes were randomly selected and observed during the study. Lambings occurred in February and March and ewes were first milked on 21 April, all of them were approximately at the same lactation stage during the study. After weaning, the ewes started grazing in the lowland (L) (480 m) pastures and were then gradually moved to mountain pastures M1 (1100 to 1300 m), M2 (1600 to 1900 m) and, finally, to the H pasture (2100 to 2200 m) on the Mangart mountain. Pasture regime and sampling design are presented in Table 1. The monitored flock was grazed on the mountain M1 and M2 pastures and H pastures of Mangart from 18 June to 4 September. From 26 April to 16 June, the ewes were grazed on the L pasture. On 17 June, the flock was moved to the M1 pasture. The flock stayed there for 10 days. On 28 June, the flock was moved to the M2 pasture and grazed there for 23 days. From 21 July to 18 August, the ewes were grazed at the highest altitude of the Mangart mountain, on the H pasture. The sheep were grazed there for 29 days. When the grazing period in the H was finished, the sheep were moved back to pasture location M2 and, subsequently, to M1 (4 September). The duration of grazing on the same pasture location depended on environmental factors, such as rainfall quantity and pasture area. The longest grazing period was in the lowland pasture (51 days).
Grazing regime of Bovec ewes and milk and pasture forage sampling design

L=lowland; M1 and M2=mountain; H=highland.
Milk sampling was performed according to the International Committee of Animal Recording (ICAR) (2011) guidelines for AT4 milk recording, with the recommended first (month) sampling during the morning and the second (next month) sampling during the evening milking etc. During the lowland grazing, ewes were milked by machine in the stable, whereas during the mountain grazing they were milked by hand in the dairying cottage located at an altitude of 1300 m. The milk of 15 Bovec ewes, which were chosen from the monitored flock at the beginning of the study, was sampled 10 times during the grazing season. During the study, milk samples were taken from the same 15 ewes. The last sampling of a particular location was performed just before moving the flock to the next pasture location (Table 1). In total, two aliquots of milk samples (50 ml) were taken from each ewe: one for chemical composition determination and one for FA profile analysis. Milk samples were immediately packed into a cold chamber and transported to the laboratory. Samples for FA composition analysis were shaken to homogenize the milk and then distributed into aliquots of 1.5 ml and stored at −20°C until analysis.
Botanical and chemical composition of the pasture
The botanical compositions of the pastures were mapped according to the four different pasture locations (L, M1, M2 and H) and at three vegetation stages (early spring, early summer and late summer), using the Braun-Blanquet (Reference Braun-Blanquet1964) method, a combined assessment of frequency and cover, as well as, the sociability of all species present. In total, 16 phytosociological surveys were performed for each location. The proportion of functional groups (grasses, grass-like species, legumes and forbs) was determined on 10 m2 plots, as the mean botanical composition of the pasture areas. The individual plant families in this study were not determined. Only total grass species (Poaceae), total grass-like species (Juncaceae and Cyperiaceae), total legumes (Fabaceae) and total herbs (dicots other than Fabaceae) were considered (Dietl, Reference Dietl1987). The chemical composition of the pasture was determined from clipped samples cut from randomly selected locations at which the botanical surveys were made. Pasture samples were cut using hand-held grass shears and collected as a composite sample from each location (L, M1, M2 and H) on the same days as the milk samples were collected (Table 1), and then packed into polyethylene bags and stored at −20°C until analysis. Proximate analyses of the pasture were determined by standard procedures. Dry matter, CP, crude fat, crude fibre and crude ash were obtained using Association of Official Analytical Chemists (AOAC) official methods (AOAC, 2000).
Climatic conditions
The average daily temperatures in May, June, July and August were 15.4°C, 18.0°C, 18.9°C and 20.2°C, respectively, whereas the average daily relative humidities were 64.3%, 65.5%, 72.7% and 72.5%, respectively. Monthly rainfall was very low; 139 mm (May), 207 mm (June), 144 mm (July) and 172 mm (August). On average, there were 16 dry days per month, so the studied grazing season on Mangart’s pastures was finished earlier than in previous years.
Fat concentration and fatty acid analysis
Milkoscan 6000FT was used for determining the fat, protein and lactose concentrations in the milk samples. The method was based on mid IR spectrometry (International Standard, ISO 9622:1999). The fat, protein and lactose concentrations were expressed as mass fractions, in percentages (m/m).
Fatty acid methyl esters (FAME) from milk and pasture samples were prepared using the in-situ transesterification method of Park and Goins (Reference Park and Goins1994). For separation of FAME, an Agilent 6890 series GC instrument equipped with an Agilent 7683 Automatic Liquid Sampler, a split injector, a flame-ionization detector and a WCOT fused silica capillary column CP-select CB for FAME (Varian, 100×0.25 mm i.d.) were used. Agilent GC ChemStation was used for data acquisition and processing. Separated FAME were identified by retention time comparison and the results were calculated using response factors derived from chromatographic standards of known composition (Nu Chek Prep). The FA profile was expressed as g/100 g of the total identified FAs. The response factors for each FAME were calculated using an available FAME standard mixture (Nu-Check 85 Prep. Inc. in a NuCheck 68D Prep Inc). Fatty acids were quantified in relation to the stoichiometric factors (the ratio of methyl ester and FA molar masses) and response factors. The accuracy and reliability of the method used was assessed with certified reference material (NIST 8435 whole milk powder). The repeatability of the method was tested with six injections of a composite milk sample, as follows: (a) 0.1%; (b) 0.2% to 1.7%; (c) 1.2% to 10.9% in: (a) all major FA and those accounting for >10.0/100 g of total FA, (b) FA accounting for 10.0 to 0.35/100 g of total FA and (c) FA with very low concentrations 0.34 to 0.001/100 g of total FA. The limit of detection was 0.005% and the limit of quantification was 0.05/100 g of total FA.
Statistical analysis
Data were statistically analysed by MIXED procedure in the statistical software package SAS/STAT (SAS Institute Inc., 2001). The model considered pasture altitude (lowland L, mountain pastures M1 and M2 and H) as a fixed effect on the FA profile estimation. The linear and quadratic regression of days in milk (DIM) were included in the model for all FA with the exception of C16:0, C18:0, C18:1, C20:0, C20:4 n-6, C20:5n-3 and milk fat concentration where only the linear regression of DIM was included. All FA with a value above 0.01/100 g of total FA were included in the data processing. Results were expressed as LSM±SE. Differences were considered significant at P<0.05.
Results
Botanical composition of the pasture
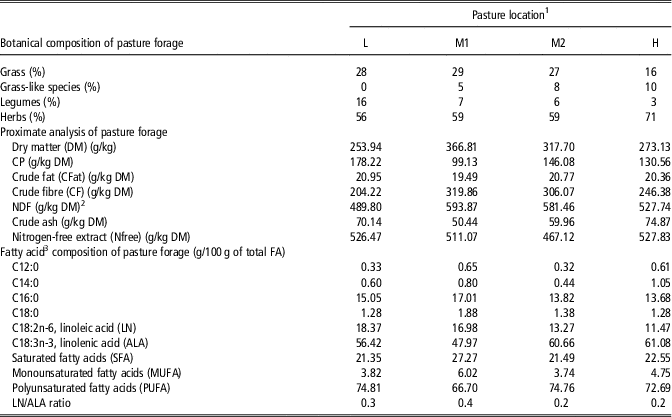
The botanical composition, proximate analyses and FA composition at the four pasture locations (L, M1, M2 and H) are presented in Table 2. The percentage of grass species and legumes was reduced from L to H pastures. With regard to herb composition, the highest percentage of herbs was found in the H pasture (71%). The percentage of grass-like species in the pasture in relation to pasture altitude was increased from 0% in the L pasture to 10% in the H pasture. The vegetation at each pasture location was in the vegetative phase, since the ewes were moved gradually throughout the grazing season in accordance with vegetation growth. In terms of FA composition, pasture samples from the H pasture contained the lowest concentration of linoleic acid (LN) and the highest concentration of α-linolenic acid (ALA). α-Linolenic acid was the most abundant FA in all pasture samples, with the highest value at H (61.08 g/100 g of total FA). The LN/ALA ratio was the lowest in M2 and H pasture forage.
Botanical composition, proximate analysis and fatty acid composition of pasture forage during the grazing period of Bovec ewes from four pasture locations with different altitudes

1 Pasture location: L=lowland at 480 m; M1=mountain at 1100 to 1300 m; M2=mountain at 1600 to 1900 m; H=highland at 2100 to 2200 m.
2 NDF was calculated using the equation: 0.90CF+306 (Agabriel, Reference Agabriel2007).
3 Fatty acids: saturated fatty acid (SFA) includes C8:0, C10:0, C11:0, C12:0, C13:0, C14:0, iso-C15:0, anteiso-C15:0, C15:0, iso-C16:0, anteiso-C16:0, C16:0, iso-C17:0, anteiso-C17:0, C17:0, iso-C18:0, anteiso-C18:0, C18:0, C19:0, C20:0, C21:0, C22:0, C23:0, C24:0; MUFA includes C10:1, C11:1n-1, C13:1n-1, C14:1n-5, C15:1n-5, C17:1n-7, C18:1c9, C18:1t9, C18:1c12, C18:1t12, C19:1n-9, C20:1n-9, C20:1n-12, C20:1n-15, C21:1n-9, C22:1n-9, C23:1n-9 and C24:1n-9.
Milk fat concentration and milk fatty acid profile
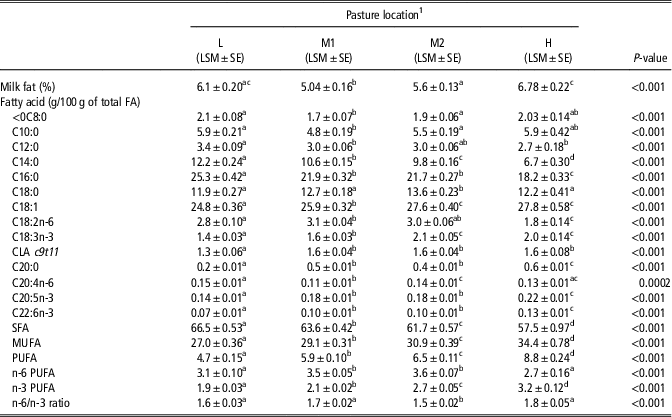
Milk fat concentration, mean concentrations of some individual FA and the sum of FA in L, M1, M2 and H pasture samples are summarized in Table 3. Milk fat concentration and milk FA profiles were affected by pasture location, as well as by DIM. A significant decrease (P<0.001) in the fat concentration was observed between milk from L (6.1%) and M1 (5.04%) pasture locations. In milk from M2 and H pastures, milk fat concentration increased significantly to 5.6% and 6.8%, respectively. Milk fat concentration also increased as DIM progressed.
Milk fat concentration and fatty acid profile in Bovec sheep milk from different pasture locations

1 Pasture location: L=lowland at 480 m; M1=mountain at 1100 to 1300 m; M2=mountain at 1600 to 1900 m; H=highland at 2100 to 2200 m.
a-d Means within a row with different superscripts differ significant (P<0.05).
SFA=saturated fatty acids include C8:0, C10:0, C11:0, C12:0, C13:0, C14:0, iso-C15:0, anteiso-C15:0, C15:0, iso-C16:0, anteiso-C16:0, C16:0, iso-C17:0, anteiso-C17:0, C17:0, iso-C18:0, anteiso-C18:0, C18:0, C19:0, C20:0, C21:0, C22:0, C23:0, C24:0; MUFA=monounsaturated faty acids include C10:1, C11:1n-1, C13:1n-1, C14:1n-5, C15:1n-5, C17:1n-7, C18:1c9, C18:1t9, C18:1c12, C18:1t12, C19:1n-9, C20:1n-9, C20:1n-12, C20:1n-15, C21:1n-9, C22:1n-9, C23:1n-9, C24:1n-9; n-3 PUFA=polyunsaturated fatty acids include C18:3n-3, C18:4n-3, C20:3n-3, C20:5n-3, C22:3n-3, C22:5n-3, C22:6n-3; n-6 PUFA includes C18:2n-6, C18:3n-6, C20:2n-6, C20:3n-6, C20:4n-6, C22:2n-6, C22:4n-6; PUFA=n-3 PUFA+n-6 PUFA; n-6/n-3 ratio=n-6 PUFA/n-3 PUFA.
In general, the most abundant FA in milk was oleic acid (C18:1) with significant variation from 24.8 g/100 g to 27.8 g/100 g of total FA among the pasture altitudes (P<0.001). The SFA with the highest concentrations in milk from all pasture locations were C16:0 (18.2 g/100 g to 25.3 g/100 g of total FA), C18:0 (11.9 g/100 g to 13.6 g/100 g of total FA), C14:0 (6.7 g/100 g to 12.2 g/100 g of total FA) and C10:0 (4.8 g/100 g to 5.9 g/100 g of total FA). The concentrations of C8:0, C10:0 and C12:0 significantly decreased in milk from L to M1 pasture locations (P<0.001) and then remained similar in milk produced on M2 and H pastures. The concentration of C18:0 was similar in milk from L, M1 and H, and varied significantly between L and M2 milk, M1 and M2 milk and H and M2 milk (P<0.001). The concentration of C14:0 and C16:0 decreased significantly according to pasture altitude (P<0.001). All individually measured SFA significantly decreased as DIM progressed, except C16:0, where the positive linear regression coefficient for DIM was determined.
The concentration of LN in milk increased significantly from L to M1 pasture location and then stayed similar in milk from the M2 pasture. Subsequently, it decreased in milk from the H pasture location. Milk produced from the L pasture contained the lowest concentration of ALA (1.4 g/100 g of total FA) and then gradually increased to 1.6, 2.1 and 2.0 g/100 g of total FA in milk from M1, M2 and H, respectively. The highest difference in ALA concentration of milk fat was observed between milk from the L and milk from the M2 locations.
The CLA concentration in sheep milk increased significantly from 1.3 g/100 g in L to 1.6 g/100 g of total FA in M1 milk (P<0.001) and then remained the same in M2 and H milk. The concentrations of EPA and DHA in sheep milk differed significantly (P<0.001) according to pasture altitude and increased from L to M1 and from M2 to H (Table 3).
In milk, the concentration of total SFA was highest (57.5 g/100 g to 66.5 g/100 g of total FA), followed by total monounsaturated FA (MUFA) (27.0 g/100 g to 34.4 g/100 g of total FA) and total PUFA (4.7 g/100 g to 8.8 g/100 g of total FA). The highest concentration of SFA was observed in milk from lowland pasture (66.5 g/100 g of total FA) and the concentration then decreased significantly to 57.5 g/100 g of total FA in the H pasture (P<0.001). In milk, the total MUFA, PUFA and the total n-3 PUFA significantly increased with increasing pasture altitude (P<0.001). In addition, the total n-3 PUFA concentration observed in H milk was 1.7 times higher than that observed in L milk. The n-6/n-3 PUFA ratio was similar in L, M1 and H milk (1.6, 1.7 and 1.8, respectively) and it was best (1.5) in milk produced at the M1 location in terms of nutritional requirements (P<0.001).
Discussion
Botanical composition of the pasture
A significant correlation has been found between the FA profile of cow milk and the main botanical families on the pastures of the mountains and H regions where the animals grazed (Collomb et al., Reference Collomb, Bütikofer, Sieber, Jeangros and Bosset2002a). The results of the pasture composition analysis showed that herbs were dominant in all pasture locations with higher occurrence in the H pasture. Likewise, in the H pasture low occurrences of legumes and grass species were determined. The results of this study were in agreement with the results of Collomb et al. (Reference Collomb, Bütikofer, Sieber, Jeangros and Bosset2002a) who found that Poaceae and Fabaceae were in low and total herbs were in high occurrence in the H compared with the lowlands.
Milk fat concentration
In this study, we found the highest fat concentration in H milk. Milk fat concentration decreased from L to M1 pastures and then increased significantly from M1 to H pastures. Variation in milk fat concentration in this study was also affected by DIM with increasing concentrations during the lactation period (P=0.01). Similar results were reported by Oravcová et al. (Reference Oravcová, Margetín, Preškovičová, Daňo, Milerski, Hetényi and Polák2007) where high variation in fat concentration was observed throughout the lactation period of ewes of three different sheep breeds. The values of fat concentration observed in milk in this study (6.67%) was similar to the milk fat concentration of Tsigai (7.77%), improved in Valachian (7.48%) and Lacuane ewes (6.97%) as reported by Oravcová et al. (Reference Oravcová, Margetín, Preškovičová, Daňo, Milerski, Hetényi and Polák2007). There is also evidence that the fat concentration in sheep milk increased during the lactation period due to the consumption of grass at different vegetative stages and, consequently, with different fibre content (Tsiplakou et al., Reference Tsiplakou, Mountzouris and Zervas2006). However, the variation in milk fat concentration among pasture locations observed in this study was probably due to a combination of effects, such as DIM and botanical composition, and did not result solely from different pasture altitude.
Changes of saturated fatty acids in sheep milk according to pasture altitude
The SFA composition of milk in this study was consistent with the four SFA (C10:0, C14:0, C16:0 and C18:0) found to be most abundant in sheep milk (Tsiplakou et al., Reference Tsiplakou, Mountzouris and Zervas2006; Hilali, et al., Reference Hilali, El-Mayda and Rischkowsky2011). The most frequently present SFA in cow milk from lowland pastures were C8:0, C10:0, C14:0 and C16:0, their concentrations decreased or remained similar in milk from mountain and H pasture locations (Collomb et al., Reference Collomb, Bütikofer, Sieber, Jeangros and Bosset2002b). In this study, the concentrations of C14:0 decreased significantly according to pasture altitude, whereas the concentrations of C8:0, C10:0 and C12:0 decreased importantly when ewes were moved from L to M1 pastures. Subsequently, they remained similar during grazing on M1, M2 and H pastures. The results suggest, that grazing on the mountain M1 pasture improved the sheep milk FA profile, which became evident through decreased concentrations of SFA. These results confirm the observations of Bugaud et al. (Reference Bugaud, Buchin, Coulon, Hauwuy and Dupont2001b) and Collomb et al. (Reference Collomb, Bütikofer, Sieber, Jeangros and Bosset2002b), who found that the total SFA proportion in cow milk from the H was lower compared with milk from the lowlands.
Changes of polyunsaturated fatty acids in sheep milk according to pasture altitude
Some authors suggest that the high concentration of PUFA in milk fat from cows grazing at high altitudes (mountains, H) compared with lowlands may be due to a number of factors associated with high altitude grazing including: lower temperatures, greater walking distance and/or a decrease in fat intake (Bugaud et al., Reference Bugaud, Buchin, Coulon, Hauwuy and Dupont2001b). They also suggest that a higher proportion of PUFA in milk samples from cows grazed on mountain pastures may be more related to a lower rate of ruminal biohydrogenation than to the FA composition in the grass (Bugaud et al., Reference Bugaud, Buchin, Coulon, Hauwuy and Dupont2001b). In addition, they assumed that ruminal biohydrogenation activity was reduced by a dietary energy deficiency (Bugaud et al., Reference Bugaud, Buchin, Coulon, Hauwuy and Dupont2001b; Leiber et al., Reference Leiber, Kreuzer, Nigg, Wettstein and Scheeder2005; Hilali et al., Reference Hilali, El-Mayda and Rischkowsky2011) and/or as a consequence of one or more plant components found in the H. The higher proportion of PUFA in cow milk from H pastures was found to be related to the botanical composition of the pasture (Collomb et al., Reference Collomb, Bütikofer, Sieber, Jeangros and Bosset2002a). Collomb et al. (Reference Collomb, Bütikofer, Sieber, Jeangros and Bosset2002a) found that the main botanical families in the lowland pastures were Poaceae (64.7%) and Fabaceae (35.3%). Poaceae were also the dominant family in the mountain (64.5%) and H (42.4%) pastures but with lower percentages compared with lowland pastures. Highland pastures were characterised by high occurrence of plant species (Collomb et al., Reference Collomb, Bütikofer, Sieber, Jeangros and Bosset2002a). Similar to the results of Collomb et al. (Reference Collomb, Bütikofer, Sieber, Jeangros and Bosset2002a), the H pastures in this study can be characterised as pastures with high occurrence of plant species, especially herbs, when compared with M2, M1 and L.
This study reported a significant increase of ALA concentrations in milk according to pasture altitude with the highest values of ALA in milk from M2 (2.1 g/100 g of total FA) and H (2.0 g/100 g of total FA) pastures. In addition, the concentration of ALA in milk followed the trend of changes of ALA concentration in pasture forage according to pasture altitude.
Similarly, some other investigations found that variation of ALA concentrations in ewe milk correspond to changes of ALA in pasture from May to September (Mel’uchová et al., Reference Mel’uchová, Blaško, Kubinec, Górová, Dubravská, Margetín and Soják2008). However, the concentration of ALA in milk is dependent on the amount of ALA that flows out of the rumen. The results of this study assumed that ruminal biohydrogenation activity of ewes grazing on M1, M2 and H pastures was reduced. Therefore, a higher concentration of ALA escaped biohydrogenation in the rumen and a higher concentration of ALA appeared in milk fat from M1, M2 and H pastures. Hypotheses that could confirm our assumption for reduced biohydrogenation activity of ewes on M1, M2 and H pastures compared with L pastures are: (i) energy deficiency; and (ii) the effect of some plant components associated with the higher altitude. Leiber et al., (Reference Leiber, Kreuzer, Nigg, Wettstein and Scheeder2005) suggested that the Alpine effect on the milk FA profile may be due to preferential mobilization of ALA from body reserves when cows grazed on high altitude pastures, and reduced biohydrogenation may be a consequence of one or more plant components found at higher altitudes. Because of low feed and energy intake of cows in the high Alpine regions, the mobilization of body fat depots was observed (Leiber et al. Reference Leiber, Kreuzer, Nigg, Wettstein and Scheeder2005). In this study, the energy intake was not measured. Only slower grass growth was observed due to the low volume of precipitation and high humidity, which could have affected the feed intake. In addition, significantly higher concentrations of C18:1 in milk from M2 and H pastures suggest that mobilization of body fat depots occurred in ewes during the grazing period on M2 and H pastures. An additional explanation that could be related to the H conditions is that higher amounts of secondary plant ingredients, such as polyphenols and terpenoids, found on Alpine pastures (Mariaca et al., Reference Mariaca, Berger, Gauch, Imhof, Jeangros and Bosset1997), could inhibit hydrogenating microorganisms in the rumen (Min et al., Reference Min, Barry, Attwood and McNabb2003). In this study, a high occurrence of herbs was observed on H pastures, and they were characterised as richer in terpenoids compared with lowland pastures (Mariaca et al., Reference Mariaca, Berger, Gauch, Imhof, Jeangros and Bosset1997).
Changes of n-3 polyunsaturated fatty acids in sheep milk according to pasture altitude
The enhancement of n-3 PUFA such as EPA and DHA in milk through diet is difficult because of the high level of biohydrogenation in the rumen. The ALA is a precursor of EPA and DHA and competes with LN for FA chain elongation into EPA and DHA or arachidonic FA by the same enzymatic scheme (Ostrovský et al., Reference Ostrovský, Pavlíková, Blaško, Górová, Kubinec, Margetín and Soják2009). Due to the higher ALA concentration of H milk, an enhancement of EPA and DHA concentrations in H milk could be expected as well. In this study, the concentrations of EPA and DHA in milk fat were increased significantly according to pasture altitude (P<0.001). Based on the facts about the transfer of PUFA from blood into milk, the results on the EPA and DHA concentrations in milk should be considered more carefully. It was reported that in particular FA of 20 and 22 carbons preferentially bound to phospholipids in lipoproteins and therefore were hardly cleaved by lipoprotein lipases in the mammary gland (Offer et al., Reference Offer, Mardsen, Dixon, Speake and Thacker1999). This could partly explain the similar concentrations of EPA and DHA in sheep milk from the M1 and M2 pasture locations.
Changes of conjugated linoleic acid in sheep milk according to pasture altitude
The concentration of CLA in ewe milk fat increased from 1.3 g/100 g in L to 1.6 g/100 g of total FA in the M1 pasture and then remained the same at the M1, M2 and H pastures. The highest concentration of CLA in milk from the M2 and H pastures is in agreement with the corresponding high concentration of ALA measured in the pasture. Similar conclusions were reported by Mel’uchová et al. (Reference Mel’uchová, Blaško, Kubinec, Górová, Dubravská, Margetín and Soják2008) where the variation of CLA in ewe milk during pasture season was directly proportional to ALA in the pasture. There are few reports in literature on the effect of pasture altitude on the CLA content in cow milk (Bugaud et al., Reference Bugaud, Buchin, Coulon and Hauwuy2001a, Reference Bugaud, Buchin, Coulon, Hauwuy and Dupont2001b; Collomb et al., Reference Collomb, Bütikofer, Sieber, Jeangros and Bosset2002a). Those authors observed a correlation between CLA in milk fat and the botanical composition of the pastures. Moreover, the content of CLA in ewe milk is affected by the vegetative phase of the forage (Cabiddu et al., Reference Cabiddu, Decandia, Molle, Pinna, Addis, Spada, Pirisi and Piredda2003, Reference Cabiddu, Decandia, Addis, Piredda, Pirisi and Molle2005). These authors concluded that among free grazing animals, the CLA content in milk increases when the forage is in the vegetative phase, but when the same forage is in the reproductive phase, the CLA falls considerably. In addition, these effects are caused by the varying content of PUFA in the forage depending on the phase in question (Cabiddu et al., Reference Cabiddu, Decandia, Molle, Pinna, Addis, Spada, Pirisi and Piredda2003, Reference Cabiddu, Decandia, Addis, Piredda, Pirisi and Molle2005).
Conclusion
Bovec sheep milk is a very good source of MUFA, n-3 PUFA, ALA, EPA and DHA. Interestingly, these increase depending on the altitude of the Alpine pastures. The CLA concentration in ewe milk was lowest on L pasture. After moving the ewes from the L to the M1 pasture, the CLA concentration increased and then remained the same among the M1, M2 and H pastures. Milk of grazed ewes on H pasture contains less total SFA, especially less atherogenic and thrombogenic SFA (lauric, myristic and palmitic acids), compared with milk of ewes grazed on M2, M1 and L pastures. Thus, the FA profile of Bovec sheep milk could be affected by the altitude of the pastures. Because this study was carried out in natura, only DIM values were considered. However, many other factors could also have influenced the FA profile in sheep milk. The increases in concentrations of MUFA, ALA, n-3 PUFA, EPA and DHA as a function of altitude could be related to variation in the concentrations of these FA in pasture and the botanical composition of the pasture location. Further investigation of the correlations between the concentrations of FA in milk and the concentrations of FA in pasture forage, as well as, the percentage of individual plant species, should be performed.
Acknowledgements
The authors wish to thank Assist. Alenka Levart, PhD, for determining the fatty acid profile in milk and the Ministry of Agriculture, Forestry and Food (contract 2311-11-000122) for their financial support. The authors would also like to thank Elisabeth Kunz and Tina Likar for language text editing.
Declaration of interest
None.
Ethics statement
None.
Software and data repository resources
None.