1 Introduction
Over the past few decades, academics and policymakers have become increasingly interested in advancing how we measure human well-being. In particular, extensive research has been focused on developing measures of subjective well-being (SWB) as complements to traditional proxy measures of welfare, such as income and education levels (Dolan & Metcalfe, Reference Dolan and Metcalfe2012). The 2009 Stiglitz–Sen–Fitoussi Commission, for example, endorsed SWB research, stating that it has been “shown that it is possible to collect meaningful and reliable data on subjective wellbeing” and recommending that “national statistical agencies ... incorporate questions on subjective well-being in their standard surveys” (Stiglitz, Sen & Fitoussi, Reference Stiglitz, Sen and Fitoussi2009, p. 216). Since 2011, the Office for National Statistics in the UK has included SWB questions in its Annual Population Survey (APS) (Dolan, Layard & Metcalfe, Reference Dolan, Layard and Metcalfe2011) and, in 2013, the OECD published guidelines on measuring SWB (OECD, 2013). The SWB literature largely distinguishes between three broad categories of measures: evaluative (individuals’ global assessments such as reports of satisfaction with their lives); experiential (feelings over relatively short periods of time); and “eudemonic” (reports of purpose and meaning) (Dolan et al., Reference Dolan, Layard and Metcalfe2011). SWB is most often captured using positively framed questions but it is equally valid to use negatively framed questions, e.g. reports of dissatisfaction with life, negative feelings or reports of pointlessness. There is an emerging consensus that the various measures of SWB capture different, though related, aspects of how well an individual’s life is going and that they should be measured separately in order to gain a more complete understanding of the multifaceted nature of SWB (Kahneman & Krueger, Reference Kahneman and Krueger2006; Forgeard, Jayawickreme & Kern, Reference Forgeard, Jayawickreme, Kern and Seligman2011).
In practice, however, the research has mostly considered the determinants of the evaluative measures, principally because variants of the life satisfaction question have been most widely used in large, longitudinal and international surveys (Dolan, Peasgood & White, Reference Dolan, Peasgood and White2008). These surveys typically contain data on people’s objective life circumstances, and so we now know quite a lot about how income, education, employment and marital status are all positively associated with life satisfaction (Clark, Frijters & Shields, Reference Clark, Frijters and Shields2008; Dolan et al., Reference Dolan, Peasgood and White2008). There is also now a well-established U-shaped pattern in relation to age, i.e. people in middle age appear less satisfied on average than younger and older individuals (Blanchflower & Oswald, Reference Blanchflower and Oswald2008).
In recent years, a richer set of right-hand-side variables have been considered as potential determinants of life satisfaction, including environmental quality. Studies have generally found significant positive (negative) associations between people’s life satisfaction and the environmental goods (bads) they are exposed to. These factors include their proximity to the coast (Brereton, Clinch & Ferreira, Reference Brereton, Clinch and Ferreira2008), local levels of airport noise (Van Praag & Baarsma, Reference Van Praag and Baarsma2005), levels of air pollution or traffic congestion (Levinson, Reference Levinson2012; Luechinger, Reference Luechinger2010; Ferreira et al., Reference Ferreira, Akay, Brereton, Cuñado, Martinsson, Moro and Ningal2013; Smyth, Mishra & Qian, Reference Smyth, Mishra and Qian2008) and the prevailing climate (Rehdanz & Maddison, Reference Rehdanz and Maddison2005). Research also exists which suggests that more transient environmental conditions such as flooding and drought (Luechinger & Raschky, Reference Luechinger and Raschky2009; Carroll, Frijters & Shields, Reference Carroll, Frijters and Shields2009) can influence life satisfaction.
A separate research enterprise has begun considering whether the measure matters; that is, whether our conclusions about what affects SWB and by how much is affected by whether evaluative, experiential or eudemonic measures are used as left-hand-side variables. The results have considered the “standard” determinants and suggest that the relationship between SWB and a given determinant can vary greatly depending on the measure used (Deeming, Reference Deeming2013). Kahneman and Deaton (Reference Kahneman and Deaton2010), for example, demonstrate that life satisfaction is always increasing in income but daily moods do not improve at all beyond an annual income of $75,000. The U-shape in age also becomes much less obvious in both experiential and eudemonic accounts (Dolan and Kudrna, Reference Dolan and Kavetsosin press).
This paper considers whether the measure matters in relation to the impact of environmental quality on SWB? Given that it does for characteristics such as income, employment and age, it is reasonable to expect that there might be some important differences in how environmental quality affects SWB when SWB is measured using experiential or eudemonic measures, in addition to evaluative ones. Moreover, although life satisfaction has done all the heavy lifting in the environmental quality literature to date, it is questionable whether it can bear this weight. Life satisfaction measures have been shown to be susceptible to context effects, such as the question that proceed them (Bertrand & Mullainathan, Reference Bertrand and Mullainathan2001; Deaton, Reference Deaton2011), are answered too quickly to fully reflect answers to the question posed (Vittersø, Oelmann & Wang, Reference Vittersø, Oelmann and Wang2009), and may not even reflect SWB as it us understood as a representation of the mental state account of well-being (Adler, Reference Adler2012; Dolan, Reference Dolan2014).
The 2013 U.S. National Academy of Sciences (NAS) panel on Measuring Subjective Well-Being noted that: “To make well-informed policy decisions, data are needed on both experienced well-being and evaluative well-being. Considering only one or the other could lead to a distorted conception of the relationship between SWB and the issues it is capable of informing, a truncated basis for predicting peoples’ behaviour and choices, and ultimately compromised policy prescriptions.” (Stone & Mackie, Reference Stone and Mackie2013). Whatever the views taken about the robustness and validity of life satisfaction responses, when looking to draw policy implications from this research we should, in the very least, consider whether the impact of environmental quality is impacted by the measure used.
The results so generated may particularly matter when they are used in well-being valuation (WV) to monetize the impact of nonmarket environmental goods. Well-being valuation uses the effects of income on SWB and the effects of the nonmarket good on SWB to place an equivalent income value on the nonmarket good. This then enables the use of these estimates in benefit-cost analysis (BCA) for policy appraisal. In 2011, the UK’s HM Treasury amended their Green Book (the formal guidance on how to appraise and evaluate policy proposals) to incorporate the WV approach (Fujiwara & Campbell, Reference Fujiwara and Campbell2011). This method avoids some of the key issues which face traditional methods of BCA, such as the difficulty of identifying people’s revealed preferences through appropriate proxy markets, and the instability of people’s stated preferences (see Robinson & Hammit, Reference Robinson and Hammit2013 for further discussion of issues in traditional BCA approaches and Fujiwara & Campbell, Reference Fujiwara and Campbell2011 for a discussion of the strengths and limitations of BCA based on revealed and stated preferences, as well as WV). Despite the potential appeal of WV, it is a relatively new approach and there are many issues that need to be addressed in order to enhance its usefulness as a further way to value nonmarket goods (seeSunstein in this issue for an interesting discussion of some of the key limitations of the approach).
One important and unresolved issue, which is of particular relevance to this work, is the question of which SWB measure to use in a given context. Elsewhere in this special issue, Graham has suggested that WV should be based on the dimension of well-being that are most relevant to the context, with experiential well-being measures being more suited to assessing day-to-day effects and evaluative measures more suited to assessing circumstances which relate to long-term outcomes. Whilst this argument certainly has its merits, there are some contexts, such as nonmarket goods relating to the environment, where there is considerable ambiguity about which measure is best “fit for purpose”.
Air pollution stands as the most widely valued aspect of environmental quality, where studies have documented negative relationships between life satisfaction and particulate matter, nitrogen dioxide and sulfur dioxide (Welsch, Reference Welsch2002, Reference Welsch2006; Mackerron & Mourato, Reference MacKerron and Mourato2009; Menz & Welsch, Reference Menz and Welsch2010; Luechinger, Reference Luechinger2010; Ferreira et al., Reference Ferreira, Akay, Brereton, Cuñado, Martinsson, Moro and Ningal2013). Evidence is currently lacking on the relationship between air pollution and other dimensions of SWB. Currently, the UK’s Department for Environment Food and Rural Affairs (DEFRA) uses “Impact Pathway Assessment” or “Damage Cost” approaches to estimate the social costs of air pollution. Despite the fact that DEFRA highlights four key areas of air quality impacts: health; amenity; productivity and ecosystems impacts, presently these approaches produce monetary estimates based on the adverse health effects of air pollution and express other nonhealth effects qualitatively, within the impact assessment (DEFRA, 2011, 2013). Well-being valuation based on SWB affords the prospect of being able to capture negative impacts beyond those that relate to health, such as the level of environmental degradation and poor visibility and even concerns over the health impacts of air pollution, which may affect well-being independently of actual health effects. Since the particular measure of SWB used may affect our conclusions about the impact of air pollution relative to other policy concerns, it is vital that research considers how pollution affects a range of SWB measures.
Beyond the urgent need for considering different measures of SWB on the left-hand variable, there also needs to be more rigorous consideration of the right-hand-side variables. First, the research currently lacks spatial detail. Much of the analysis to date has used cross-country comparisons of average pollution levels (Welsch, Reference Welsch2002, Reference Welsch2006; Menz & Welsch, Reference Menz and Welsch2010), but there are large variations in air pollution levels within countries, and so country-mean concentrations are very imprecise measures of an individual level exposure to air pollution (Luechinger, Reference Luechinger2009). Second, there is omitted variable bias. The existing literature suggests that air pollution is simultaneously determined by local characteristics, including weather, population density and economic activity (Levinson, Reference Levinson2012; Luechinger, Reference Luechinger2009; Schmitt, Reference Schmitt2013; Cuñado & De Gracia, Reference Cuñado and De Gracia2013). These are characteristics which have also been shown to be associated with SWB. Many studies fail to control for these local characteristics, which affect SWB, and therefore will often paint a misleading picture of the association between air pollution and SWB (Welsch, Reference Welsch2006; Orru, Orru, Maasikmets, Handrikson & Ainsaar, Reference Orru, Orru, Maasikmets, Handrikson and Ainsaar2016).
Against this background, this paper considers the impact of a more elaborate measure of air pollution on a more expansive range of measures of SWB. In doing so, our WV estimates will be both richer and more rigorous. We analyze responses to the evaluative, experiential and eudemonic questions in the UK’s APS. Since 2011, SWB data in the APS have been used to: make international well-being comparisons between the UK and other OECD countries (Beardsmore & Randall, Reference Beardsmore and Randall2015); monitor changes in the UK’s well-being (Evans, Macrory & Randall, Reference Evans, Macrory and Randall2015); and investigate the relationship between the “standard determinants” and SWB (Deeming, Reference Deeming2013). In this paper, we consider their relationship to modeled concentrations of particulate matter at the unitary authority level, whilst controlling for weather and other local area characteristics, which have previously been shown to be associated with SWB. We additionally provide WV estimates that can potentially be fed directly into BCA.
We find evidence of a strong and statistically significant negative association between background concentrations of fine particulate matter (PM2.5) and reports of life satisfaction. This finding is in line with existing literature and additionally provides a detailed estimate of the magnitude of that negative association between evaluative well-being and levels of PM2.5 in a UK context. We also find evidence of a similarly sized negative association between air pollution and reports of happiness yesterday and the worthwhileness of activities. The happiness result provides evidence that air pollution not only impacts how individuals evaluate their lives but also how they feel on a day-to-day basis. The association with the worthwhile measure is the first evidence to suggest that air pollution is linked to eudemonic well-being, which we speculate may come about through the mechanism of decreased engagement with nature-based activities in more polluted environments. Moreover, all three associations remain statistically significant when self-reported health status is controlled for. This suggests that traditional social cost estimates of air pollution, which focus on health effects alone, may underestimate the impact of air pollution on SWB. We do, however, acknowledge the problematic nature of measures of self-reported health and so we call for further research using objective measures of health in this area to investigate this issue further.
Monetary values based on WV methods are also calculated for the impact of air pollution on SWB for a subsample of the population for which income data are available and these valuations are found to vary substantially according to the measure used. When taking life satisfaction as the dependent variable, we calculate a utility-constant trade‐off of £261 of gross weekly income for every 1 microgram per meter-cubed reduction in annual background concentrations of fine particulate matter. The corresponding value based on happiness yesterday is £299. Finally, in relation to worthwhile we calculate a figure of £379. So, very disparate valuations result when using different dependent measures of well-being. There are many caveats that need to be added, and future research to be conducted, before these numbers can be treated as robust estimates of the marginal rates of substitution between income and air pollution, and we consider some of these further in the discussion. Our substantive point, though, is that if the UK government looks to carry out CBA of air quality using WV techniques, then they need to be alert to these kinds of differences that result from measuring SWB in different ways.
Perhaps even more interestingly, we find no association between reports of anxiety yesterday with background concentrations of PM2.5. Some eminent academics, including Daniel Kahneman, have argued that policymakers should pay greater attention to changes in negative measures of “pain” rather than to positive ones of “pleasure” (Lelkes, Reference Lelkes2013; Kahneman, Reference Kahneman2011) and doing so in the context of air pollution would make this particular aspect of environmental quality less of a priority for policymakers. We discuss some of the issues emanating from these findings in the discussion in Section 4. Sections 2 and 3 now detail the methods and results, respectively.
2 Data and methods
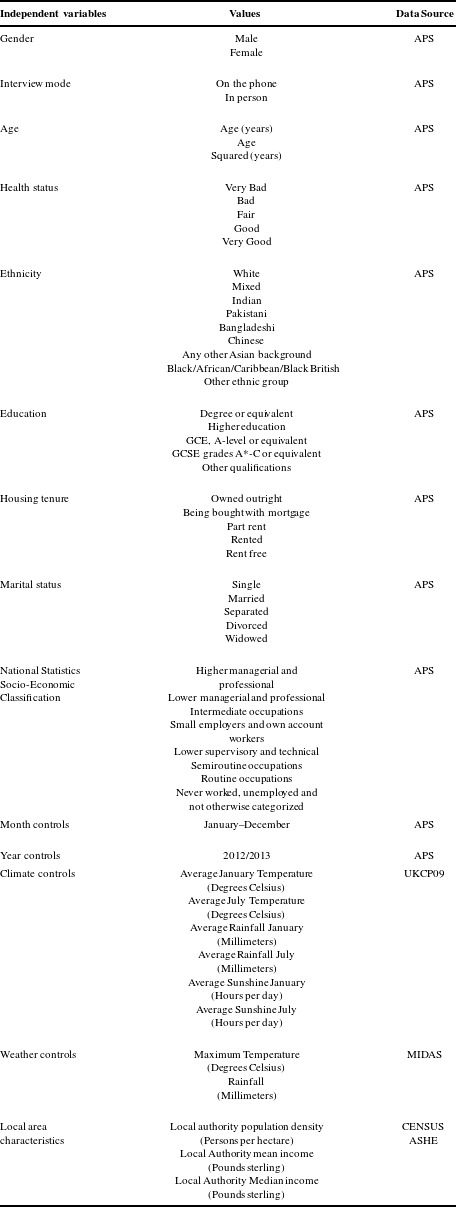
Data on SWB, air pollution and other relevant control variables were drawn from a number of sources and merged together using QGIS and Stata 12. All control variables included in the analysis and their sources are documented in Table 1 of the appendix.
2.1 Annual population survey
The dependent variables are taken from responses to the UK’s Office for National Statistics Annual Population Survey’s SWB questions. These are:
(1) “Overall, how satisfied are you with your life nowadays?” (Satisfaction);
(2) “Overall, how happy did you feel yesterday?” (Happy);
(3) “Overall, to what extent do you feel the things you do in your life are worthwhile?” (Worthwhile);
(4) “Overall, how anxious did you feel yesterday?” (Anxious).
The first three questions represent positive measures of SWB; the first question is evaluative; the second represents a measures of positive experiential SWB; and the third is a eudemonic measure. The fourth question is a negative experiential measure and the only negative framed SWB measure featured in the survey. For each question, respondents indicated their answer on an 11-point scale, with 0 indicating “not at all” and 10 representing “completely”.
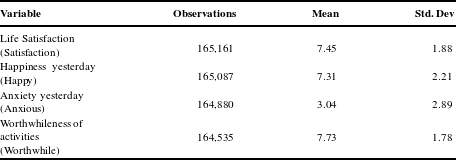
The March 2012–April 2013 APS wave is the focus in this paper because of the availability of concurrent modeled air pollution and weather data. It contains SWB data from around 165,000 individuals. In addition, survey weights are provided which make the SWB responses representative of the UK’s adult population at the time. The survey dataset also provides other demographic information including age, sex and ethnicity and other indicators relating to education, employment and marital status, which act as important control variables.
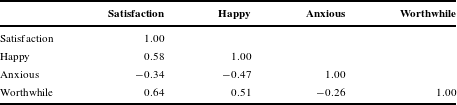
The tables below show summary statistics for the four SWB variables of interest and report the correlations between the measures. The averages and the correlations are illustrative of the fact that the questions are disparate, though related, aspects of SWB.
SWB Summary statistics
SWB correlation matrix
2.2 Population weighted centroids
We were granted access to the APS’s Special Access User licence, which allowed us to undertake spatially detailed analysis using the survey’s unitary authority variable (UACNTY09), and their local authority level (UALAGB09) variable, which divides the UK into 144 and 382 low level geographical areas. Using these variables we matched the weather conditions on the date of the interview and local air pollution levels, climate, and population density to individual responses. The Geographic Information System QGIS was used to merge the APS with the necessary spatial data on climate, weather and air pollution. Population data in the form of median population weighted centroids (PWCs) for output areas from the ONS’s 2011 population census were then downloaded from the ONS’s Open Geography portal and loaded in to QGIS. PWCs consist of single summary reference points which represent how the population at census time was spatially distributed and grouped within that output area.
These data were spatially joined to the unitary authority map using QGIS’s join attributes by location tool. Following the ONS’s PWC guidance output area centroids were fit to the higher unitary authority level, by plotting the PWCs into the boundaries of the output geography and assigning the output area to that unitary authority when the centroid fell within that boundary. PWCs of unitary authorities were then calculated by finding the mean coordinates of the PWCs of the output areas contained within each area. This method provided us with a point for each unitary authority to which we could match the air pollution, climate and weather data using QGIS’s point sampling tool.
2.3 Pollution data
Particulate matter was chosen as the air pollutant of interest because it is a key pollutant highlighted by The EU’s Air Quality Directive and existing evidence suggests that it is the air pollutant most strongly associated with increased mortality risks (Committee on the Medical Effects of Air Pollutants [COMEAP], 2010). Particulate matter is a measure of the respirable solid and liquid particles suspended in the atmosphere which are categorized as either coarse particulate (PM10) if they are greater than 2.5 micrometers ( ${\rm\mu}$m) in diameter, or fine particulate (PM2.5) which relates to those smaller than 2.5
 ${\rm\mu}$m in diameter. Particulate matter is a complex mixture consisting of many different components from a range of sources including man-made and natural materials such as dust, smoke and soot, as well as pollen and soil particles.
Much evidence exists documenting the detrimental effects of both PM10 and PM2.5 on ecosystems and on population health (Air Quality Expert Group, 2012a,b). Particulate matter has been shown to have direct negative impacts on our natural environment through the degradation of vegetation and indirect effects on the acid and nutrient status of soils and waters (DEFRA, 2007). It also negatively impacts visibility (U.S. Environmental Protection Agency, 2011). In addition, research on public health has demonstrated that long-term exposure to particulate matter is associated with a range adverse health effects, including the development of lung dysfunction and cardiovascular diseases, leading to increased mortality risk (COMEAP, 2010; Pope et al., Reference Pope, Burnett, Thun, Calle, Krewski, Ito and Thurston2002; Atkinson et al., Reference Atkinson, Carey, Kent, Van Staa, Anderson and Cook2013). In the UK in 2008, the COMEAP estimates that 29,000 people died prematurely and 340,000 healthy life years were lost as a result of exposure to fine particulate matter.
Recent research suggests that there are no clear concentration levels below which adverse health effects do not occur and that PM2.5 is more closely associated with the aforementioned negative health outcomes than is PM10 (Air Quality Expert Group, 2012a,b). On this basis, we chose to model the relationship between SWB and PM2.5.
Annual average levels of fine particulate matter were identified for each unitary authority using the DEFRA’s 2012 map of background concentrations of fine particulate matter which was produced using a dispersion modeling approach. The map was created under the UK’s Ambient Air Quality Assessments contract and as part of the UK’s obligations under the European Commission’s Air Quality Directive. The map models background annual average PM2.5 concentrations on a 1 km  $\times$ 1 km grid using an air dispersion model which incorporates measured observations from DEFRA’s Automatic Urban and Rural Network; emissions inventory data from the National Atmospheric Emissions Inventory, which provides information on emissions to the atmosphere from sources such as cars, trucks, power stations; and point source data, for example, for secondary inorganic compounds. The maps are produced and evaluated in accordance with DEFRA’s best practice guidelines, for example, measured concentrations relating to area sources are amended by subtracting the modeled point source contribution so that the modeled area sources are being fairly compared with the area source component of the measured concentrations (Ricardo-AEA, 2013).
The direct monitoring of air pollution only provides data for specific locations and so it is common practice to adopt an air pollution modeling approach to convert information about atmospheric emissions into estimates of air pollution concentrations in order to supplement this information. This strategy is helpful in providing estimates for areas in which pollution is a long distance from observation sites but, as with any modeling, it requires the simplification of real-world conditions into a series of algorithms and it suffers from issues around uncertainty, e.g. in relation to emissions from missing sources (Air Quality Expert Group, 2012a,b). Outputs from air pollution modeling are therefore necessarily imperfect measures of ambient air pollution in any given location, which need to be checked against monitored data to assess their reliability.
In order to do this, Ricardo-AEA verify their pollution maps using independent monitoring data from other measurement networks that are not used in the calibration of the model. For further detail of the sites within the Ricardo-AEA “Calibration Club” see Ricardo-AEA (2013). Expert assessment contained in the relevant technical report, which was published alongside the air pollution map, considers the level of the agreement between measured data and the modeled values of PM2.5 to be good (Ricardo-AEA, 2013). The average modeled concentration at background sites was  $11.8~{\rm\mu}\text{g}~\text{m}^{-3}$ whilst the average measured concentration, as captured by the National Network of Filter Dynamics Measurement Systems was
 $12.5~{\rm\mu}\text{g}~\text{m}^{-3}$. The modeled PM2.5 concentrations estimates fell within the modeled data quality objectives set out by the European Commission’s Air Quality Directive at 97% of the monitoring site locations (Ricardo-AEA, 2013). Reflecting this reliability, these background concentration maps have been widely used in UK-based epidemiological studies, to investigate the relationship between air pollution and various health conditions, including all-cause mortality (Carey et al., Reference Carey, Atkinson, Kent, Van Staa, Cook and Anderson2013a,Reference Carey, Atkinson, Kent, Van Staa, Cook and Andersonb), chronic obstructive pulmonary disease (Atkinson et al., Reference Atkinson, Carey, Kent, Van Staa, Anderson and Cook2015), adult lung function (Forbes et al., Reference Forbes, Kapetanakis, Rudnicka, Cook, Bush, Stedman, Whincup, Strachan and Anderson2009a,Reference Forbes, Patel, Rudnicka, Cook, Bush, Stedman, Whincup, Strachan and Andersonb) and cardiovascular diseases (Atkinson et al., Reference Atkinson, Carey, Kent, Van Staa, Anderson and Cook2013).
2.4 Climate
Modeled climate data were downloaded from the Met office’s UKCP09 gridded observation data sets. The PWCs were then matched to raster files of  $5\times 5$ km modeled data that represented the long-term average (1981–2010) mean daily temperature and rain in January and July using QGIS’s point sampling tool. Long-term average measures of temperature, rainfall and sunshine were incorporated. These measures relate to maximum temperature in January and July and average rainfall, and sunshine hours also in January and July. These measures are commonly found in the literature (Brereton et al., Reference Brereton, Clinch and Ferreira2008; Cuñado & De Gracia, Reference Cuñado and De Gracia2013) and, rather than representing climate extremes, these summer and winter conditions act as proxy measures for the overall climate conditions.
2.5 Weather
Daily measures of weather conditions were not available in modeled format but instead came from station data the Met Office’s Integrated Data Archive System (MIDAS). Daily surface station weather observations on maximum air temperature and rainfall were extracted from MIDAS using their web processing system for the dates 01/03/2012–30/04/2013. Daily readings from approximately 687 temperature monitors as well as 2715 rainfall gauges were linked with longitude and latitude information and imported into QGIS. The data points were then interpolated using batch SAGA processing with an inverse‐distance‐weighting (IDW) scheme in order to build daily weather condition raster files. The interpolation process was specified so as to include data from stations up to 20 km from any given point with up to a maximum of the 10 closest stations providing data. This spatial interpolation technique allowed us to estimate weather conditions for areas between monitoring stations (Denby, Garcia, Holland & Hogrefe, Reference Denby, Garcia, Holland and Hogrefe2010).
2.6 Local area effects
All other local area effects were matched to respondents at local authority level using the APS variable UALAGB09. A measure of population density, in the form of persons per hectare at local authority level, was taken from the ONS’s population density estimates from the 2011 census and was included as a proxy measure of urbanization. Both the local mean and the median income were taken from the ONS’s Annual Survey of Household Earnings.
2.7 Models
Ordinary least squares (OLS) regression models were estimated in order to investigate the relationship between the local average background concentration of fine particulate matter and responses to the SWB questions contained in the APS. The regression models take the general form:
 $$\begin{eqnarray}\text{EQ}_{1}:\text{SWB}_{\mathit{ijt}}={\it\alpha}P_{\mathit{jt}}+{\it\beta}X_{\mathit{ijt}}+{\it\pi}Z_{\mathit{jt}}+{\it\eta}_{\mathit{t}}+{\it\varepsilon}_{\mathit{ijt}}\end{eqnarray}$$
where  $\text{SWB}_{\mathit{ijt}}$ is the subjective well-being rating of the respondent
 $i$ in location
 $j$ at date
 $t$.
 $P_{\mathit{jt}}$ is the annual average background particulate matter concentration at location
 $j$ at date
 $t$.
 $X_{\mathit{ijt}}$ is other demographic and interview characteristics,
 $Z_{\mathit{jt}}$ are local area characteristics in location
 $j$ at date
 $t$,
 ${\it\eta}_{t}$ are month and year fixed effects and
 ${\it\varepsilon}$ represents the error term.
The Annual Population Survey Subjective Well-Being Population weight is applied to all regressions and standard errors are clustered at local authority level (Jones, Reference Jones2012; Cameron & Miller, Reference Cameron, Miller, Ullah and Giles2011). SWB responses are treated differently across studies with some researchers treating them as cardinal whilst others respect the strict ordinality of the data and use ordered logit or probit models to analyze the data. Ferrer-i-Carbonell and Frijters (Reference Ferrer-i-Carbonell and Frijters2004) find that assuming cardinality or ordinality of the responses to SWB questions has little effect on the results. For ease of exposition, we therefore present the results from OLS regressions.
In order to investigate the relationship between modeled background concentrations of particulate matter at the population centroid of each unitary authority and reports of SWB, we ran various specifications of the models, regressing background concentrations of fine particulate matter on all four SWB measures. An outline of the different models estimated between SWB and air pollution is below. PM2.5 and responses to the life satisfaction question are chosen for illustrative purposes but all model output for all SWB measures can be found in the appendix Tables 2–4.
In Model I, we estimate an unweighted simple linear regression model of the relationship between SWB and average background air pollution levels. In Model II we add the SWB weights, which causes the total number of cases in the dataset to be grossed up to the estimated population of adults (aged 16 and older) within the UK as at end of September 2011, and control for individual characteristics that have been found in previous studies to have an impact on SWB: age, sex, marital status, housing tenure, educational level, employment status, national statistics socioeconomic classification (see e.g. Dolan et al., Reference Dolan, Peasgood and White2008; Deeming, Reference Deeming2013). In addition, we controlled for whether the interview took place on the phone or in person, since this was found by Dolan and Kavetsos (Reference Dolan and Kavetsos2016) to have a significant association with SWB in the APS data, and month and year fixed effects.
In Model III we add climate controls. In Model IV we introduce the other local area characteristics; weather; a measure of population density; and local area mean income. Country controls were avoided as Northern Ireland is considered a country but also a single unitary authority in the APS and as such only has one pollution value. Model V is estimated as Model IV except for the exclusion of self-reported health status. Other models that were estimated but not shown included: country and regional fixed effects (these controls introduced issues of multicollinearity in to the model which was established using a variance inflation factor (VIF) test in STATA 12); local unemployment rate (this variable were found to be insignificant and introduced issues of multicollinearity in to the model); and controls for weather “yesterday” (i.e. the reference day for the two experiential SWB questions as opposed to weather on the day of interview, which actually did not substantively change the pollution estimates).
3 Results
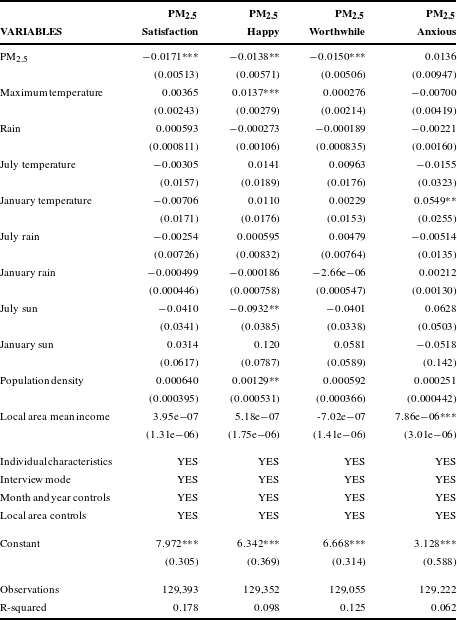
Table 1 shows the relationship between satisfaction and PM2.5. See the appendix for tables detailing the other measures. The different specifications of the models outlined above do not qualitatively change the associations between PM2.5 and all of the positive measures of SWB. Significant negative associations are found between PM2.5 and reports of life satisfaction, happiness yesterday and the worthwhileness of activities across Models I to IV. Anxiety is found to have a significant association with PM2.5 in Models I and II but this association disappears once the climate proxies are included in the Model III and the coefficient remains insignificant in Model IV, when further local area characteristics are introduced. Model IV is chosen as the preferred specification to present in Table 2 because it provides estimates of the associations between our measures of SWB and concentration of PM2.5, holding constant sociodemographic, and local area and interview characteristics, which have previously been shown to be linked to SWB or suggested as potential confounders.
Various model specifications for Life satisfaction and PM2.5.

Note: Robust standard errors clustered at local authority level, in parentheses. *** $p<0.01$, **
 $p<0.05$.
PM2.5 and the range of SWB measures.
Note: Robust standard errors clustered at local authority level, in parentheses. *** $p<0.01$, **
 $p<0.05$.
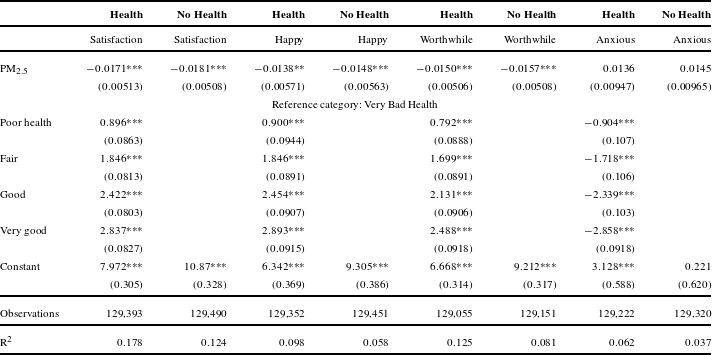
A comparison of SWB–PM2.5 models with and without health controls.
Note: Robust standard errors clustered at local authority level, in parentheses. *** $p<0.01$, **
 $p<0.05$.
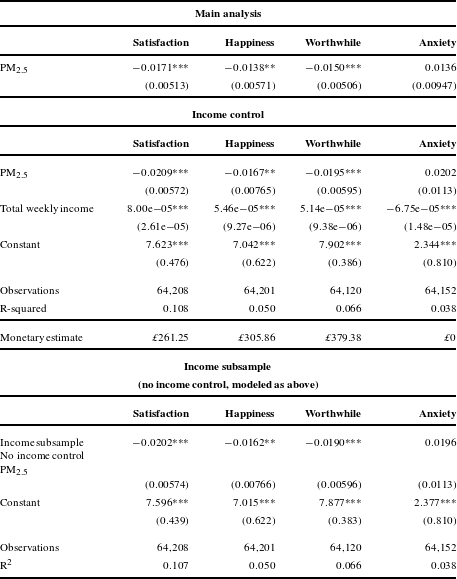
Income subsample analysis.
Note: Robust standard errors clustered at local authority level. *** $p<0.01$, **
 $p<0.05$.
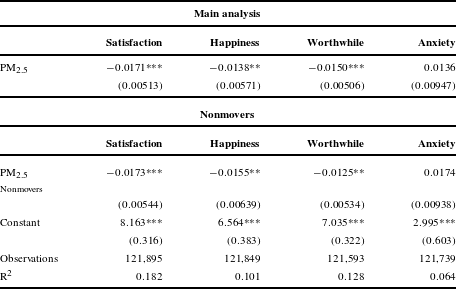
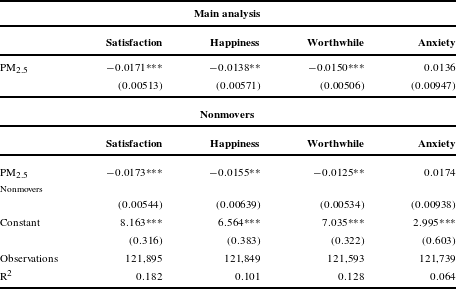
Nonmovers.
Note: Robust standard errors in parentheses. *** $p<0.01$, **
 $p<0.05$, *
 $p<0.1$.
For the most part, the SWB measures are not found to be significantly associated with the local area characteristics included in the analysis. Some exceptions include the sunshine hours in July (population density), which we find is negatively (positively) associated with happiness, and average January temperature which is positively associated with anxiety. The interpretation of these coefficients is problematic, however, as they suffer from multicollinearity issues. This does not pose a problem for our own analysis as these variables are simply acting as controls, and we obtain low VIF scores across all of our models for our PM2.5 coefficients, but conclusions should not be drawn about the relationships between SWB and other local area characteristics from these results.
3.1 Pollution effects
Our preferred specification in Model 4 finds evidence of significant relationships between pollution and all three positive measure of well-being: life satisfaction; worthwhileness and happiness yesterday. The decrease in satisfaction associated with a  $1~{\rm\mu}\text{g}~\text{m}^{-3}$ increase in fine particulate matter in the main analysis is
 $-$0.0171 on an 11-point scale. This result is remarkably similar to that found by Orru et al. (Reference Orru, Orru, Maasikmets, Handrikson and Ainsaar2016) which documents a negative association of
 $-$0.0171, on a 10-point scale, with
 $1~{\rm\mu}\text{g}~\text{m}^{-3}$ increase in coarse particulate matter, using data from the European social survey. Interestingly, the associations between PM2.5 and reports of happiness yesterday and worthwhileness of activities are almost as large in magnitude: an increase of
 $1~{\rm\mu}\text{g}~\text{m}^{-3}$ in PM2.5 concentrations is associated with an average reduction of
 $-$0.0138 and
 $-$0.0150 points, respectively. No such associations were found between PM2.5and reports of anxiety yesterday.
3.2 Health effects
Air pollution may act to reduce an individual’s SWB indirectly through its impact on their health and also directly. By running regression models that incorporate self-reported health status, we are estimating the effect of air pollution on SWB over and above its effect through health. Here we present the regression estimates for the association between air pollution and SWB with and without controlling for self-reported health status and note that self-reported health status appears to partially mediate the relationship between air pollution and SWB. The association between PM2.5 and satisfaction, for example, is reduced by approximately 6% when health is controlled for in the model, compared to the same coefficient when health controls are removed. Similarly, the coefficients are reduced by nearly 7% and 4% in the happiness yesterday and the worthwhile model, when health is controlled for. These results suggest that health is one mechanism through which air pollution influences life satisfaction but that it is not the exclusive pathway. In contrast to this, we find no evidence of an association between anxiety yesterday and PM2.5 concentrations, either when health controls are present or absent from the model.
3.3 Income subsample analysis
Ideally, income would be included as a control variable, but household income was not included in our main models, as it is not available for the whole sample. Only a subsample, which represents those who were either employees or under government employment at the time of interview, provided a response to income related questions about gross weekly pay in their main and second job (n  $=$ 65,626). We therefore opted to exclude the income variable from the primary analysis, in order to maintain the representativeness of the sample. Dolan and Kavetsos (Reference Dolan and Kavetsos2016) took the same approach in their work on the APS dataset, which investigated the relationship between mode of interview and reports of SWB, as did Connolly (Reference Connolly2013) in her work using the Princeton Affect and Time Survey, which looked at the relationship between climate and SWB. Local area mean income, socioeconomic status and housing tenure were all included as proxies instead.
We then estimate separate regressions of the same model presented above but this time also controlling for income (by including gross weekly pay in main and second job) using the subsample for which income data are available. Income is found to have a significant relationship with all measures of SWB. Qualitatively equivalent results were found between both PM2.5 and all measures of satisfaction, worthwhileness and happiness in the regressions that control for income as were found in the main analysis. However, once income was controlled for the magnitudes of the associations do increase, for example, a  $1~{\rm\mu}\text{g}~\text{m}^{-3}$ increase in PM2.5 is associated with a
 $-$0.0209 point drop in life satisfaction when income is controlled for as compared to a
 $-$0.0171 drop in the main analysis. Similar patterns are observed for reports of happiness yesterday and worthwhileness. The coefficients on anxiety remains statistically insignificant at conventional levels. Looking at the subsample for which income data are available, we see that, without controlling for income, very similar coefficients as those that were obtained when income was incorporated are found for satisfaction, happiness and worthwhileness. The change therefore is arguably largely due to the subsample analysis and not as a result of bias being induced in the main analysis by the omission of income. On the basis of these findings, and whilst acknowledging that the point estimates presented in the main analysis almost certainly suffer from some omitted variable bias due our inability to control for income, we hold that the results from the main analysis allows us to make valid claims about the relationship between fine PM2.5 and measures of SWB for the UK population.
3.4 Well-being valuation
Based on the estimates of the effects of income and PM2.5 on SWB, it is possible to calculate the utility-constant trade‐off ratio between income and air pollution for the subsample for whom income data are available. The units of analysis are based on pounds sterling of total gross weekly income (£) and micrograms per meter cubed of annual background concentrations of fine particulate matter ( ${\rm\mu}\text{g}~\text{m}^{-3}$). Total gross weekly income has a mean value of £462 and a standard deviation of £575. Annual background concentrations of PM2.5 have a mean value of
 $10.56~{\rm\mu}\text{g}~\text{m}^{-3}$ and a standard deviation of
 $2.77~{\rm\mu}\text{g}~\text{m}^{-3}$. Model 4 was specified to include total gross weekly income and took the following form:
 $$\begin{eqnarray}\text{EQ}_{2}:\text{SWB}_{\mathit{ijt}}={\it\alpha}P_{\mathit{jt}}+{\it\beta}X_{\mathit{ijt}}+{\it\gamma}{\it\delta}_{\mathit{ijt}}+{\it\pi}Z_{\mathit{jt}}+{\it\eta}_{\mathit{t}}+{\it\varepsilon}_{\mathit{ijt}}.\end{eqnarray}$$
 $\text{SWB}_{\mathit{ijt}}$ is the subjective well-being rating of the respondent
 $i$ in location
 $j$ at date
 $t$.
 $P_{\mathit{jt}}$ is the background particulate matter concentration at location
 $j$, at time
 $t$.
 $X_{\mathit{ijt}}$ is other demographic and contextual characteristics,
 $Z_{\mathit{jt}}$ are local area characteristics in location
 $j$ at date
 $t$,
 ${\it\delta}_{\mathit{ijt}}$ represents total gross weekly income of individual
 $i$,
 ${\it\eta}$t represents month year fixed effects and
 ${\it\varepsilon}$ represents the error term. The average marginal rate of substitution (MRS) between income and pollution was then based on the ratio of the coefficients on average background concentrations of PM2.5 and total gross weekly income,
 $$\begin{eqnarray}\text{MRS}=-{\it\alpha}/{\it\gamma}.\end{eqnarray}$$
Once income is controlled for in the sample of individuals for whom we have income data (i.e. those in employment, n  ${\sim}$ 64,000) based on the satisfaction coefficient on an extra unit (
 ${\rm\mu}\text{g}~\text{m}^{-3}$) of PM2.5 of
 $-$0.0209 and on an extra unit (£) of total gross income of 0.0000800. The MRS between a one‐unit reduction in PM2.5 and income is calculated as £261.25, if we take life satisfaction as the relevant measure of well-being. In comparison to this, we calculate an MRS of £305.86 if we base it on reports of happiness yesterday and £379.38 if we base our calculations on the worthwhile measure of well-being.
3.5 Robustness check
Our main analysis focuses on investigating the impact of annual average background concentrations of pollution and SWB assuming that where someone lives at the time of the interview affects them. Some people may have lived there for many years and others only a few weeks, however. A robustness check was therefore carried out to see if the relationships suggested by the analysis reported in Table 2 hold when only those individuals who had lived at the same address for at least six months were included ( $n\sim \text{121,700}$). All of the relationships relating to PM2.5 do indeed hold, with slight increases in the magnitude of the effects relating to reports of both life satisfaction and happiness yesterday and a decrease in the relationship between worthwhile and fine particulate matter.
4 Discussion
To further enhance the evidence base on the determinants of SWB in ways that could ultimately help inform policy decisions, this paper considers the impact of a more elaborate measure of air pollution on a more expansive range of measures of SWB. The results based on responses to the question “Overall, how satisfied are you with your life nowadays?” are in line with existing literature relating to evaluative well-being and air pollution (Orru et al., Reference Orru, Orru, Maasikmets, Handrikson and Ainsaar2016; Ferreira et al., Reference Ferreira, Akay, Brereton, Cuñado, Martinsson, Moro and Ningal2013). On average, those exposed to higher air pollution in the UK report lower life satisfaction. The size of this effect is considerable: a one standard deviation change in the levels of PM2.5 is associated with a drop in life satisfaction roughly equivalent the difference between having no education compared to a degree. Whilst there are serious challenges to using life satisfaction as a measure of well-being (Dolan and Kudrna, Reference Dolan and Kavetsosin press), that we and others consistently find negative associations between life satisfaction and air pollution at least suggests that life satisfaction ratings pick up more than just what is on a respondent’s mind at the time of assessment. It is highly unlikely that particulate matter is thought about in a life satisfaction response yet it still seems to affect it: in much the same way as museum visits (Fujiwara, Reference Fujiwara2013), fruit and vegetable consumption (Blanchflower, Oswald & Brown, Reference Blanchflower, Oswald and Brown2012) or proximity to the coast (Brereton et al., Reference Brereton, Clinch and Ferreira2008) do.
In addition, we also find evidence of a significant relationship between background levels of PM2.5 and individual responses to the question “Overall, how happy did you feel yesterday?” Holding constant other determinants of SWB, individuals living in more polluted unitary authorities report lower levels of happiness. This is the first study to find a negative link between the levels of happiness people experience day to day and the air quality in their locality. The size of this effect is also meaningful: a one standard deviation change in the levels of PM2.5 is negatively associated with a 0.024 drop in happiness, which is approximately half of the effect of being disabled. This is an important result in the context of recent emphasis on experiential measures of SWB (Stone & Mackie, Reference Stone and Mackie2013; Dolan & Kahneman, Reference Dolan and Kahneman2008; Dolan, Reference Dolan2014) and the dearth of evidence linking environmental quality to experiential SWB. So, not only do people evaluate their lives as less good the more polluted is their local environment, they are also less happy living in that environment day to day.
We also find an association between eudemonic well-being captured by the question “Overall to what extent do you feel the things you do in your life are worthwhile?” and the level of local air pollution they are exposed to. One possible explanation for this result, and indeed the other significant relationships found, may be that individuals living in differently polluted areas engage in different activities. In yet unpublished research carried out by the authors using Nature England’s Monitoring Engagement with the Natural Environment survey (see Nature England, 2013, for more details), which now incorporates the four SWB measures used in this study, the number of nature related activities and individual engaged in was found to be positively associated with all three positive measures of SWB. Speculatively, if individuals are less likely to engage in nature related activities, such as walking through local parks or green spaces on the way to other places and doing unpaid voluntary work out of doors, in areas that are more polluted, then this could be one mechanism through which air pollution affects reports of the worthwhileness of activities overall as well as life satisfaction and happiness yesterday. Further research linking time use, SWB and air pollution is required in order to further develop and test this idea.
The results also suggest that air pollution influences life satisfaction, worthwhileness and happiness through its effect on health; all coefficients on PM2.5 increase in magnitude when health status is not included in the models. But a comparison of these coefficients with those from models incorporating health status reveals that much of the negative associations between PM2.5 and life satisfaction and happiness are not mediated by self-reported health status. These results confirm the idea that air pollution negatively impacts SWB over and above health effects. The comparison across these models are imperfect as a result of the imprecise nature of the measure of health included in the dataset (a 0–5 scale of self-reported health) (Baker, Stabile & Deri, Reference Baker, Stabile and Deri2004). Having said that, self-reported health measures have been found to be more highly correlated with SWB than are objective health measures (Kahneman & Riis, Reference Kahneman, Riis, Baylis, Huppert and Keverne2005), and so controlling for self-reported health is likely to produce lower estimates of the independent effect of air pollution on SWB, than would be produced if we incorporated objective health measures in to our models. In order to better understand the relationship between SWB, air pollution and health as it relates to BCA, future research should incorporate objective measures of health, e.g., by linking air pollution and health damages by locality to SWB. Our study provide the motivation for such work as it presents suggestive evidence that traditional approaches to valuing air pollution, such as damage cost estimates and impact pathway assessments, which are currently based on the health effects of air pollution exposure alone, are likely to be underestimating the overall welfare costs of air pollution.
Interestingly, and perhaps also surprisingly, is the fact that we do not find a relationship between the negatively framed measure of SWB – anxiety yesterday – and air pollution. Our simple linear regression model finds evidence of the expected positive association between PM2.5 and anxiety, and this remain the case when we control for individual characteristics. Once local climate is controlled for, however, and in all other specifications of the model, which introduce further local area characteristics, no significant relationship is found between PM2.5 and anxiety. If, as some have argued (Lelkes, Reference Lelkes2013; Kahneman, Reference Kahneman2011), policymakers should prioritize the minimization of misery over the maximization of happiness, then these results suggest that traditional CBA based on health effects alone fully captures the relevant SWB costs of pollution. That the measure matters complicates matters for policy appraisal but it also highlights that different measures of SWB are affected by different determinants and in so doing vindicates the use of multiple measures of SWB in the APS. The difference between the positive and negative measures of affect, in particular, highlight that they are different constructs (Larsen & Mcgraw, Reference Larsen and McGraw2011) that, in the very least, have different determinants. It would be interesting for future research to investigate if negatively framed evaluative and eudemonic measures were similarly unaffected by air pollution, or if they share the same determinants as their positive counterparts.
We additionally derive monetary estimates based on the SWB responses and gross weekly income reports for the subsample of respondents for whom we have income data. The analysis of this subsample yields broadly similar results: life satisfaction, worthwhileness and happiness still appear to be negatively associated with PM2.5 levels and we find no evidence of a relationship with anxiety. The magnitudes of these significant associations increase in all cases and the relative importance when the associations across measures are compared remains the same. In terms of the actual monetary values generated, we estimate a trade‐off ratio of £261.25 for every one‐unit reduction in PM2.5 in relation to life satisfaction, and £305.86 for happiness yesterday and £379.38 for worthwhile. These valuations are derived from estimates of the associations between PM2.5 and SWB, but also from our estimates of the relationship between gross weekly income and SWB.
With regards to the three measures of positive SWB, we find gross weekly income to be most closely associated with life satisfaction followed by happiness yesterday and then reports of the worthwhileness of activities. That we derive lower WV estimates for the impact of PM2.5 on life satisfaction is being driven by the fact that we estimate stronger associations between life satisfaction and income. Existing research has found life satisfaction-based WV estimates to be lower than experiential ones for health conditions for precisely this reason (Powdthavee & Van Den Berg, Reference Powdthavee and Van Den Berg2011). As we find no significant relationship between PM2.5 and the negative measure of SWB, the associated MRS is £0. As was highlighted in the introduction, a key issue in WV is which measure is most appropriate in a given context. Our finding of disparate valuations for air pollution, across the different measures of SWB, does not definitively answer this question, of course, but it does speak to its importance and suggests that, as long as this issue remains unresolved, WV must consider a wide range of measures. The positive valuations we find in relation the three positive measures of SWB suggest that there may well-being gains to be made from interventions that bring about reductions in air pollution levels that cost less than the estimated monetary values. This study is not without its limitations, which create lines for future enquiry. We draw the reader’s attention to four main caveats and opportunities. First, although a great number of control variables were incorporated into our models, the cross-sectional nature of our data mean that drawing causal inferences about the impact of air pollution on SWB is problematic. Having said that, given that previous studies, across a wide range of different contexts and at different levels of spatial and temporal detail, have provided continual evidence of a negative association between air pollution and evaluative well-being, we would suggest that the overall body of evidence is suggestive of an underlying causal relationship. Future research should look to reproduce our findings in relation to experiential and eudemonic well-being in order to establish similar levels of evidence for the other measures of SWB used here. To be more confident about causality, researchers should look to use natural experiments where possible (Luechinger, Reference Luechinger2009).
Second, and related, we are cautious not to suggest that the monetary WV estimates reported here are precise. As is the case with much of the WV literature, one key issue with deriving monetary valuation from SWB data is that gross weekly income may be endogenous with respect to happiness. There exists some evidence to suggest that a two-way causal relationship exists between income and happiness with money influencing SWB but with SWB also influencing subsequent earnings (Clark et al., Reference Clark, Frijters and Shields2008). Research which has compared instrumental variable based estimates to simple OLS estimate of the relationship between income and SWB has found that OLS estimates tend to be biased downwards (Luttmer, Reference Luttmer2005; Dolan & Metcalfe, Reference Dolan and Metcalfe2008). Dolan and Metcalfe (Reference Dolan and Metcalfe2008), for example, find that instrumented estimates of the effect of household income on life satisfaction were between two and three times higher than their OLS equivalents. On this basis, it is likely that our reported estimates between air pollution and income are biased upwards (Levinson, Reference Levinson2012) and that estimates based on instruments could be less than half the value of the ones presented. Future research on valuing environmental quality should look to use instrumental variable approaches to try to estimate the effect of exogenous changes in income (Fujiwara & Campbell, Reference Fujiwara and Campbell2011; Gardner & Oswald, Reference Gardner and Oswald2007).
Moreover, given that the estimates in our study are derived from a subsample who are in employment and government training, and income is likely to be differently associated with SWB in the sample as a whole which additionally contain individuals who are unemployed, inactive, the self-employed and unpaid family workers, these estimates are not representative of the UK population and are likely to be biased, although the direction and magnitude of the bias is unclear. Future research should look to surveys with more complete income data for a representative sample such as the UK’s Wealth and Assets survey which now incorporates the four ONS SWB questions as part of the ongoing Measuring National Well-Being program. With the aforementioned limitations in mind, we report the monetary estimates with the sole goal of highlighting that, as a result of the potential differences between environmental quality and various measures of SWB on the one hand, and the differences between how income relates to different measures of SWB on the other, any WV estimates of nonmarket environmental goods will almost certainly vary according to the SWB measure used.
Third, we have assumed that the responses to the happiness and anxiety yesterday questions are experiential measures of SWB. These measures are, however, somewhat imperfect experiential measures as the questions refer to yesterday and so represent retrospective judgments rather than “in the moment” experiences. More instantaneous measures of positive and negative affect could be obtained using the Experience Sampling Method (ESM), which involves prompting individuals through portable technology at various points over the course of a day, and eliciting information from them about their physical location, the activities which they are engaged in, the people they are with and how they are feeling (Schwarz, 2010). One recent study which finds evidence of a link between environmental quality and an ESM-based measure of SWB was carried out by Mackerron and Mourato (Reference MacKerron and Mourato2013). They measure happiness of self-selecting individuals at random points in the day via app technology and their location via global positioning systems (GPS) and find a positive link between happiness and being outdoors in a natural environment. Given the scale of the APS, however, an ESM would not have been feasible and so the happiness and anxiety questions included represent attempts to capture experiential measures of SWB within a short recall period, and for a nationally representative sample of individuals. Future research should capitalize on the ability for modern technologies to track where individuals are via GPS, and look to investigate the relationship between environmental quality and ESM-based data on representative samples.
Fourth, considerable evidence exists that SWB responses adapt to changes in circumstances over time. Previous studies have documented this phenomenon in relation to many significant life events using longitudinal analysis. For example, adaptation to the positive effect of marriage was found to be complete after two years on average; and individual’s life satisfaction almost totally rebounds after the loss of a spouse, eight years after the event (Lucas, Clark, Georgellis & Diener, Reference Lucas, Clark, Georgellis and Diener2003). It is also important to note, however, that adaptation it is not inevitable for everyone and for every event. Many studies document significant difference in the rate and extent of adaptation across individuals (Lucas et al., Reference Lucas, Clark, Georgellis and Diener2003) and adaptation to some life events such as disability and unemployment would appear to be only partial (Lucas, Reference Lucas2007). There is also some evidence to suggest that individuals may even become sensitized to some stimuli, such as unpredictable noise, over time (Weinstein, Reference Weinstein1982). These issues are complicated further by the possibility that adaptation processes may vary across measures of SWB. (Luhmann, Eid & Lucas, Reference Luhmann, Eid and Lucas2012) carried out a meta-analysis of studies relating to ten key life events including marriage and unemployment, in order to investigate the difference in adaptation processes in relation to evaluative and experiential SWB. They find evidence that the extent and rate of adaptation to many of the life events considered varies across measures and that it is not the case that one measure adapts quicker or more fully across all life events.
Against this background, and given the cross-sectional nature of our data, it is difficult to say what role adaptation may play in the relationships we find between air pollution and the different measures of SWB. Unfortunately, there is no work that we are aware of that investigates adaptation of SWB to changes in air pollution, or whether the rate of adaptation (if any) to air pollution and environmental quality more generally differs across evaluative and experiential well-being. That the significant negative relationships found in the main analysis all hold when looking at the subsample of people who have lived in the area for over six months suggests that our results are not solely driven by individuals who are being newly exposed to the local levels of pollution and that adaptation amongst these nonmovers is not complete. Yet our results only represent a snap shot at one time period of the association between local air pollution and measures of SWB.
As such, our estimates represent the average associations between these SWB measures and background concentrations of particulate matter but do not get at individual differences in sensitivity to air pollution levels or estimate different effect sizes for individuals who are accustomed to different levels of air pollution. We consider these to be important research gaps which should be addressed in future. Moreover, the differences we find in the magnitude of the effects, with the association between pollution and the measures of evaluative well-being being larger than that of happiness levels, may in fact reflect different propensity to adapt to air pollution across these different dimensions of well-being. Longitudinal research examining adaptation in response to shocks to local pollution levels is required in order to investigate whether this is the case or if those differences in fact reflect something more permanent.
Overall, the results reported in this paper lend weight to the idea that the various measures incorporated in the APS are capturing different but related characteristics of an individual’s SWB. We adopt a spatially detailed approach to modeling the determinants of SWB including features of the physical environment such as local climate, weather and air pollution. Drawing on best practice from a number of sources (Levinson, Reference Levinson2012; Met Office, 2014; DEFRA, 2014; Brereton et al., Reference Brereton, Clinch and Ferreira2008) we use modeled concentrations of PM2.5 and PWCs from the 2011 census to link individuals to air pollution levels in a precise manner. We also incorporate a wide range of controls relating to the physical environment and other local area characteristics which previous literature suggests may affect SWB (Luechinger, Reference Luechinger2009; Schmitt, Reference Schmitt2013; Cuñado & De Gracia, Reference Cuñado and De Gracia2013). In so doing, we find evidence that background particulate matter concentrations are negatively associated with all positive measures of SWB investigated, even when controlling for health. We also document null results in relation to reports of anxiety yesterday.
Taken together, these results build on existing evidence from the SWB literature based on evaluative measures, and other estimates from traditional methods of CBA based on health effects, to show the links between air quality and well-being. Our results pose a challenge to policymakers to think more carefully about the full range of impacts of air pollution, beyond its health effects. The findings also demonstrate that our conclusions about the relationship between well-being and environmental quality can vary according to the richness of the left-hand side (the measure of SWB used) and the rigor of the right-hand side (the environmental quality and control variables). By being alert to how pollution relates to individuals’ reports of their own SWB and how these associations vary across different measures of SWB, we can obtain a clearer and more complete picture of the well-being costs to society of bad air days.
Appendix
List of Control variables included in the analysis.
Various model specifications for PM2.5 and Happiness.
Various model specifications for Worthwhile and PM2.5.
Various model specifications for Anxious and PM2.5.