Pathological inflammation of the mammary gland, mastitis, is one of the most costly diseases in the dairy industry, causing both direct and indirect losses (Seegers et al. Reference Seegers, Fourichon and Beaudeau2003; Bannerman, Reference Bannerman2009; Cha et al. Reference Cha, Bar, Hertl, Tauer, Bennett, Gonzalez, Schukken, Welcome and Grohn2011). The pathogenicity and involvement of Staphylococcus aureus as a causative factor in intramammary infection (IMI) has been widely discussed (Bayles et al. Reference Bayles, Wesson, Liou, Fox, Bohanch and Trumble1998; Hensen et al. Reference Hensen, Pavicic, Lohuis, de Hoog and Poutrel2000; Schukken et al. Reference Schukken, Gunther, Fitzpatrick, Fontaine, Goetze, Holst, Leigh, Petzl, Schuberh, Sipka, Smith, Quesnell, Watts, Yancey, Zerbe, Gurjar, Zadoks and Seyfert2011) as has its relevance as a major cause of chronic subclinical mastitis. Defining and establishing better and more reliable diagnostic biomarkers for earlier detection of clinical mastitis would be immensely valuable (Eckersall Reference Eckersall1995; Eckersall & Bell, Reference Eckersall and Bell2010) but so would better methods for diagnosing subclinical mastitis (Akerstedt et al. Reference Akerstedt, Forsback, Larsen and Svennersten-Sjaunja2011). The mammary gland is also subject to inflammatory responses not attributable to microbial invasion. This is most evident at the end of lactation when milk accumulation causes increased intramammary pressure leading to an inflammatory acute phase response (Stein et al. Reference Stein, Morris, Davies, Weber-Hall, Duffy, Heath, Bell, Ferrier, Sandilands and Gusterson2004), disruption of the mammary epithelium, apoptosis and extensive tissue remodelling (Quarrie et al. Reference Quarrie, Addey and Wilde1996; Theil et al. Reference Theil, Labouriau, Sejrsen, Thomsen and Sørensen2005). Non-pathogenic mammary inflammation may also occur to some extent during the normal filling of the gland between milkings/sucklings, especially if the latter is delayed for some reason (Lakic et al. Reference Lakic, Sjaunja, Norell, Dernfalk and Ostensson2011). In many cases the aetiology of mammary inflammation is not easy to determine. For instance, many breastfeeding practitioners consider that human mastitis rarely involves a pathogen, but is due to ‘blocked ducts’ and hence milk accumulation (Kvist, Reference Kvist2013). The use of antibiotic therapy to treat human mastitis varies greatly from country to country (Scott et al. Reference Scott, Robertson, Fitzpatrick, Knight and Mulholland2008) whereas the majority of bovine mastitis is treated by antibiotic, often without direct evidence of infection (and hence unnecessarily: Roberson, Reference Roberson2012). There is a diagnostic need across species to be able to distinguish between infectious mastitis and ‘physiological inflammation’.
The involvement of different cytokines and acute phase proteins (APPs) has been reported in different inflammatory responses including mastitis (see Murata et al. Reference Murata, Shimada and Yoshioka2004 for review). Tissue damage, including mastitis, induces an acute phase response (APR) which mostly comprises the release of inflammatory mediators from tissue macrophages at the damaged site (Koj, Reference Koj1996). As a result, mastitic milk contains elevated levels of cytokines (Peli et al. Reference Peli, Scagliarini, Britti and Boari2003). APPs are also found in milk. Colostrum was shown to contain high levels of mammary-associated serum amyloid A3 (SAA3: McDonald et al. Reference McDonald, Larson, Mack and Weber2001) which was later also found, together with haptoglobin (HP) in naturally occurring and experimentally induced mastitis (Nielsen et al. Reference Nielsen, Jacobsen, Andersen, Niewold and Heegaard2004; Eckersall et al. Reference Eckersall, Young, Nolan, Knight, McComb, Waterson, Hogarth, Scott and Fitzpatrick2006). A third APP, α1-acid glycoprotein (AGP) is also present in colostrum and mastitic milk (Ceciliani et al. Reference Ceciliani, Pocacqua, Provasi, Comunian, Bertolini, Bronzo, Moroni and Sartorelli2005; Eckersall et al. Reference Eckersall, Lawson, Bence, Waterson, Lang, Donachie and Fontains2007). Systemic as well as local production of APPs is believed to play an important role in host defence (see Eckersall& Bell, Reference Eckersall and Bell2010 for review).
Using mice as a model for infectious mastitis has been well established for several decades (Chandler, Reference Chandler1970; Anderson, Reference Anderson1977) and more recently has been used for Staph. aureus mastitis (Brouillette & Malouin, Reference Brouillette and Malouin2005a; Brouillette et al. Reference Brouillette, Grondin, Talbot and Malouin2005b; Hu et al. Reference Hu, Gong, Guo and Chen2010). However, the murine APR has not been characterised, nor has pathogenic inflammation been compared with non-pathogenic. The objective of this study was to establish a mouse model to allow comparison of the APR in response to infusion of Staph. aureus and to accumulation of milk caused by teat sealing. Cytokines included for study were IL1β, IL6 and TNFα, and APPs were AGP, SAA3 and HP. We focused at both local and systemic level, measuring mammary tissue gene expression with qRT-PCR (real-time quantitative PCR) and analysing milk and blood plasma using commercially available ELISA and Multiplex immunoassays. The research addresses two hypotheses: firstly, that acute phase proteins present in milk are in part or wholly of local (mammary) origin; and secondly, that the profile of APP production will differ between pathogenic inflammation and inflammation caused by milk accumulation.
Material and methods
Animals
The experiment was performed according to the guidelines of the European Convention for protection of Vertebrate Animals and Animal Experimentation Act under Danish national legislation and conducted at Technical University of Denmark (DTU), (License Number: 2012-15-2934-00587). NMRI outbred mice (male around 35 g and female around 25 g) were purchased from two different companies, Taconic and Harlan, from Denmark and Netherlands, respectively, in order to establish our own breeding colonies. Experimental mice were fed fortified breeding diet (Altromin Spezialfutter GmbH&Co.KG, Germany) ad libitum. Females were placed singly with males and examined daily for the presence of a vaginal plug. Pregnant mice were transferred into single cages and provided with nesting material. Following parturition the number of pups was adjusted to 10 (Shipman et al. Reference Shipman, Docherty, Knight and Wilde1987) to ensure a constant suckling stimulus.
Experimental procedure
Lactating mice were used on day 7±2 of lactation. General anaesthesia was induced with isoflurane (IsoFlo Vet, Orion Pharma Animal Health) and continued with hypnorm/dormicum (VetPharma Ltd/Dormicum 5 5 mg/ml ROCHE) 0·075 ml/10 g/mouse. Individual teats were cleaned with 70% ethanol and visualised through a binocular stereomicroscope. A Nanofil™ 100-μl microinjection syringe (World Precision Instruments Inc, SG2 7EG UK) attached to a micromanipulator was carefully positioned such that the tip of a blunt 36-g needle attached to the syringe was close to the tip of the teat, which was then carefully lifted onto the needle using microforceps. Once the needle was located within the teat the contents of the syringe were carefully discharged through the teat into the gland. A total of 36 mice were inoculated in this way. In each mouse, the fourth and fifth inguinal glands on one side were infused with 100 μl of Staph. aureus suspension whilst the two contralateral inguinal glands were infused with 100 μl of normal saline vehicle. The second and third thoracic glands on one side were sealed with tissue adhesive (Loctite super glue universal) whilst the contralateral glands were untreated as control. The treatment sides were randomised between mice, and in each mouse the pathogen and sealing treatments were made on opposite sides. Following inoculation the mouse was kept separated from its pups for 4 h in order to obtain better colonisation of the bacteria.
Bacterial strain
Staph. aureus AO35 was obtained from an infected cow and kindly provided by our colleague, Dr Arshnee Moodley, at the Department of Veterinary Disease Biology, Copenhagen University, Denmark. The isolate was propagated in 10 ml of Luria-Bertani (LB) broth for 18 h at 37 °C, sedimented by centrifugation and re-suspended in stile isotonic saline. The viable count was made by counting the number of colonies formed on the LB agar medium, inoculated with 10-μl volumes of tenfold dilution and incubated at 37 °C for 24 h. The suspension was then diluted with sterile isotonic saline to obtain a suspension containing 10 000 cfu/ml. The bacterium was successfully re-isolated from the infused mice (data not shown).
Sampling
The 36 inoculated mice were divided into 6 groups of 6 mice for sample collection at 0 (control), 4, 10, 24, 48 and 72 h after inoculation. Mice were anaesthetised and injected with 0·15 iu oxytocin (Oxytocin-S 0·18 mg/ml, Intervet) IP for milk sample collection into micro-capillary, non-heparinised tubes. Milk samples were obtained from the three treatments (inoculated, vehicle infused and control glands) at 0, 4, 10, 24 and 48 h. Owing to extreme inflammatory response at the bacterial infused gland at the 72-h group samples could not be reliably collected. Blood samples were collected by cardiac puncture and 22-gauge needles, stored at 4 °C overnight then centrifuged at 1500 g at 4 °C for 10 min for serum collection. Blood sera and milk samples were stored at −80 °C for further analysis. The anaesthetised mouse was then sacrificed by cervical dislocation for tissue sampling. Control, Staph. aureus-inoculated, vehicle-infused and teat-sealed mammary tissues were quickly collected and divided into two pieces; a larger portion for flash freezing with liquid nitrogen and storing at −80 °C, and a smaller portion fixed in 4% PFA (v/v) (paraformaldehyde) for 24 h followed by transferring into 70% ethanol for 3 d before paraffin embedding.
RNA preparation
Frozen mammary glands and livers were cut into smaller pieces of 20–25 mg on dry ice. Tissues were homogenised with Trizol (Life Technologies Europe BV, 2850 Naerum, Denmark) and frozen stainless steel beads (5 mm Qiagen Cat.no 69989) with TissueLyser II from Qiagen (Cat.no 85300). They were then centrifuged for 10 min at 4 °C and transferred into MaXtract High Density 1·5-ml tubes (Qiagen Cat.no 129046); final isolation was performed by using SV Total RNA isolation system kit from Promega (Naka, Sweden) according to the guidelines. RNA yield was afterwards checked by NanoDrop ND-1000 Spectrophotometer and the quality of RNA was determined by using Aligent 2100 Bioanalyzer System (Aligent Technologies).
cDNA synthesis, primer design and qRT-PCR
Isolated RNA transcribed to cDNA by using 5× MMLV reverse transcriptase, dNTP, random hexamer primer, RN-ase inhibitor and MMLV enzyme by adding H2O up to 25 μl cocktail in total (Promega. Nacka, Sweden). The cDNA was stored at −20 °C for short periods and −80 °C for longer times and also diluted to a concentration of 4 ng/μl before quantification.
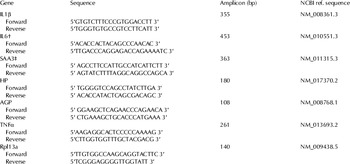
Three reference genes, RPL13A (ribosomal protein L13a), HPRT (hypoxanthine-guanine phosphoribosyltransferase) and GAPDH (glyceraldehyde 3-phosphate dehydrogenase) were selected (Han et al. Reference Han, Yang, Zhu, Wang, Wang, Guo, Lu, Li and Wang2010). RPL13A was selected as the most stable reference gene for normalisation of the data. Target and reference genes were tested for genomic DNA on 2% agarose gel, standard curves were obtained, and acceptance efficiency range was set to 1·8–2 with satisfactory melting curves. Products were sent for DNA-sequencing at TAG Copenhagen A/S, Denmark. Samples were run in triplicate with inter-plate calibrators using LighCycler® 480 machine (SYBr green 1 master mix) from Roche Applied and Diagnostics (Hvidovre, Denmark) 10 μm for each primer in a 10-μl reaction mixture containing 2 μl of total cDNA (Rahbek et al. Reference Rahbek, Nazemi, Ødum, Gupta, Poulsen, Hay-Schidt and Klærke2014). Primer sequences are listed in Table 1.
Primer sequences used for real-time PCR reactions

† IL6 reverse primer sequence was from Wang et al. (Reference Wang, Diao, Guan, Cruikshank, Delovitch, Jevnikar and Du2008)
‡ SAA3: Villalba et al. (Reference Villalba, Hott, Martin, Aguila, Valdiva, Quezada, Zambrano, Concha and Otth2012)
Serum cytokine, APP and milk amyloid A concentrations
Serum concentration of IL1β, IL2, IL6, IL10 and TNFα were measured with a Mouse Magnetic Cytokines/Chemokines panel, MCYTOMAG-70 MILLIPLEX Map, Millipore by Luminex 200. The assay was provided with calibration and standards. The observed assay response from calibrators and controls were acceptable and showed the accuracy of the measurements. The samples were run in one batch and all samples were assayed in duplicate.
SAA and HP concentrations were measured by commercially available ELISA kits. Murine serum amyloid A (SAA) (TP-802M), pre-coated microplate and haptoglobin (HP) (TP-801) Tridelta (Development Ltd, Ireland) assays were used for APP measurement in serum samples and by following the manual instruction, both kits were provided with their calibrators. Concentration of mouse milk amlyloid A (MAA) was also determined by using a kit from Tridelta (Development Ltd, Ireland) (TP-807). This ELISA kit was also pre-coated and provided with the calibrators. Concentrations in blood sera and milk samples were determined using BioTek ELx800 Absorbance Microplate Reader® by reading at both 450 and 630 nm, and calculated by Gen5 software. Samples were assayed in duplicate and samples with higher concentration than the standards were re-diluted and re-analysed in order to obtain their concentration values within the range of the standard curves.
Statistical analysis
Relative gene expression analysis was implemented based on Pfaffl (Reference Pfaffl2001) and statistical analysis of all data was performed by using the mixed procedures in SAS (version 9.3, SAS Institute Inc. 2010). Variables in the statistical model included the group, treatment and their interaction as fixed effects, and the factors such as animal, gland side within a row in the animal as random effects, as shown in the following model:
 $$Y{\rm = \mu + \alpha} _i + {\rm \beta} _j {\rm + \alpha \beta} _{ij} {\rm + \gamma} _k {\rm + \rho} _{lm} {\rm + \varepsilon} _{ijklm} {\rm,} $$
where Y=the dependent variables, μ=the overall means, α i =group (i=control, right or left), β j =treatment (j=control, staph, sealed or saline), αβ ij =interaction between group and treatment, γ k =random effect of animal (l=1, 2,… and 35), ρ lm =random effect of gland side within a row (l=left or right; m=gland number), ε ijklm =random variation which was assumed to be normally distributed with a variance σ2 and a mean of zero. For expression analysis between control glands and liver samples, variables in the statistical model included the group (control gland and liver), treatment (control, 4, 10, 24, 48 and 72 h) and their interaction as fixed effects, and the factor animal (1, 2,… and 35) as random effect. For analysis of mouse milk amlyloid A (MAA) data, group (control, 4, 10, 24 and 48 h), treatment (control, Staph. or saline) and their interaction were included as fixed effect and animal (1, 2,… and 30) as random effect. For analysis of serum amyloid A (SAA) ELISA, colorimetric haptoglobin and mouse MAGNETIC cytokines assays, group (control, 4, 10, 24, 48 and 72 h) was included as fixed effect and animal (1, 2,… and 35) as random effect. Before performing the final statistical analyses, data were checked for outliers based on residual plots. One mouse from the 24-h group was excluded from the whole study.
Presented results are expressed as least squares means±sem for the graphs and the significance levels for overall effects in table. The PDIFF option in SAS was used to generate comparisons between treatment means. The level of significance was set at P<0·05 and graphs were made with SigmaPlot 12.0.
Results
Mammary gland mRNA expression analysis
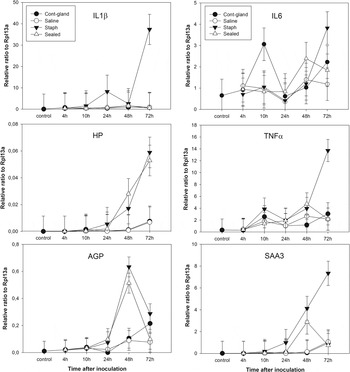
Data for mammary gland expression of the three cytokines IL1β, IL6, and TNFα are in Fig. 1 and significance levels for the overall effects of time after inoculation and treatment are in Table 2.
Relative expression of IL1β, IL6, TNFα, HP, AGP and SAA3±se between four treatments within time intervals for mammary glands.

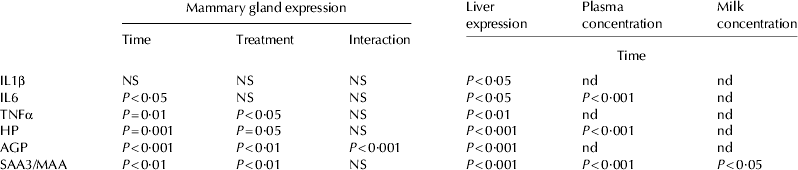
Significance levels for overall effects. Data are shown in Figs. Figs. 1–3 and the statistical models used are described in the text. Mammary gland expression of cytokines and APP was analysed for effects of time after inoculation/teat sealing and for treatment effects comparing Staphylococcus aureus inoculation, vehicle infusion, teat sealing and no treatment. Liver expression and appearance of cytokines and APP in plasma and milk were analysed only for time after inoculation/teat sealing. NS: not significant. nd: not determined

Relative to the reference gene RPL13A, IL1β expression remained at pre-inoculation level until 24 h, when there was a small (non-significant) and transient increase in glands infused with Staph. aureus. A much larger and significant (P<0·05 vs. control) increase occurred in the same treatment at 72 h, whilst all other treatments (including sealed glands) showed no increase (Fig. 1, IL1β). When statistical analysis was restricted to the Staph. aureus glands, there was a significant effect of time after inoculation (P<0·05) but when all treatments were included there was no significant effect (Table 2). A different pattern was observed for IL6. There was a small but significant (P<0·05) increase in overall IL6 expression with time after inoculation, but whilst the eventual increase was numerically greatest in Staph. aureus-inoculated glands, there was no significant difference between the treatments at any time point (Fig. 1, IL6). Changes in TNFα were similar to IL1β in that there was a large and significant increase in the Staph. aureus-treated glands at 72 h (P<0·05 vs. control) but in this case there was an overall effect of time after inoculation (P=0·01, Table 2) indicating that the increased expression was not restricted to the Staph. aureus glands. Nevertheless, there was a significant treatment effect.
Mammary expression of the three APP, HP, AGP and SAA3 are in Fig. 1 (HP, AGP and SAA3). HP was expressed at low levels compared with the cytokines and other APP; nevertheless, there was a clear increase in expression with time after inoculation (P<0·001 overall). In contrast to the cytokine patterns, this increase occurred to approximately equivalent extents in Staph. aureus- and teat-sealed glands, where it was evident at both 48 and 72 h. At 72 h there were small increases in expression in control and vehicle glands, but the difference between treatment groups was significant (P<0·05). Expression of AGP was significantly affected by time after inoculation (P<0·001) and by treatment (P<0·01) with the main effect being a parallel large increase in Staph. aureus- and teat-sealed glands at 48 h, followed by a decrease. There was a clear tendency for expression to increase at 72 h in control and vehicle glands; hence, there was a significant interaction between time and treatment effects (P<0·001). Expression of SAA3 also increased with time after inoculation (P<0·01 overall) and in response to treatments (P<0·01 overall). Initially, there was a parallel increase in Staph. aureus- and teat-sealed glands at 48 h, but in the former this increase was sustained to 72 h whereas in the latter there was a decline after 48 h.
Liver mRNA expression analysis
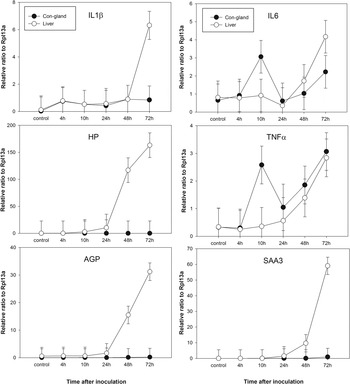
Expression levels of cytokines and APP in liver and control mammary gland tissue are compared in Fig. 2. Based on expression relative to RPL13a, expression of the three cytokines was higher or similar in mammary tissue compared with liver, whilst expression of the three APPs was much lower in mammary gland compared with liver. Hepatic expression of all three cytokines and all three APPs increased significantly with time after inoculation (Table 2). The time course of increased hepatic expression of IL6 and TNFα was parallel in liver and control mammary tissue, whereas IL1β increased at 72 h in liver only. Hepatic expression of HP, AGP and to a lesser extent SAA3 increased at 48 h, and all three increased further at 72 h.
Relative expression of IL1β, IL6, TNFα, HP, AGP and SAA3±se between control glands and liver samples within time intervals.

Blood serum and milk analysis
IL6, HP and SAA serum concentrations were quantified using a cytokine panel and commercially available ELISA kits. Data are in Fig. 3 and significance levels in Table 2. All three markers gradually and significantly increased beginning after 10 h. IL6 concentrations were very much lower than either of the APPs, with HP present at much higher levels than SAA. MAA was detected in milk from Staph. aureus-inoculated glands at 24 and 48 h and from vehicle-infused glands at 48 h, although at levels approximately 5-fold lower than in inoculated glands.
Concentration of SAA, HP and IL6 in blood serum±se between groups. MAA concentration±se between control group, saline and staph injected groups within time intervals.

Discussion
Using a novel model that compares pathogenic and non-pathogenic inflammation we have characterised the local response to mammary inflammation in mice, and have demonstrated increased expression of various inflammatory cytokines and APPs. We have shown that the response to pathological inflammation (infection with Staph. aureus) is different from the response caused by ‘physiological inflammation’ (due to milk accumulation). The expression of inflammatory cytokines was increased only in individual glands inoculated with the pathogen, whereas APP expression was increased in both pathogen-inoculated and teat-sealed glands. The time course of the APP response was similar for the two inflammatory states, with the exception that SAA3 remained elevated beyond 48 h in pathologically inflamed glands, but not in physiologically inflamed.
Milk contains a great many bioactive factors, but the mammary gland is a complex structure, hence in many cases the precise origin of these factors (including cytokines and APPs) has not been totally elucidated. Proteolytic breakdown of synthesised protein (largely caseins) during storage, transcellular trafficking and secretion of intact molecules from plasma to milk, paracellular transfer of molecules through ‘leaky’ tight junctions and de-novo synthesis and secretion by mammary epithelial cells are all possible sources of proteins and peptides in milk. It must also be recognised that detection of mammary expression of a particular protein does not necessarily imply production by mammary secretory cells, since the tissue is very highly vascularised. Where cytokines are concerned, it is important to recognise that mastitic milk contains very large numbers of neutrophils and other immune cells, and whilst mammary epithelial cells have been shown to synthesise certain cytokines (Goldman et al. Reference Goldman, Chheda, Garofalo and Schmalstieg1996) it is likely that the majority of cytokines in mastitic milk will be derived from immune cells of one sort or another. The situation is less clear for APPs. On the basis of milk/plasma profile comparison and expression within mammary tissue, Eckersall et al. (Reference Eckersall, Young, Nolan, Knight, McComb, Waterson, Hogarth, Scott and Fitzpatrick2006) proposed that MSAA3 was a specific product of mammary tissue, and our data support that conclusion. Pedersen et al. (Reference Pedersen, Aalbæk, Røntved, Ingvartsen, Sorensen, Heegaard and Jensen2003) used a bovine Streptococcus uberis model and observed a marked increase in milk HP without a concomitant increase in plasma levels, and Hiss et al. (Reference Hiss, Mielenz, Bruckmaier and Sauerwein2004) observed expression of HP in mammary tissue after endotoxin challenge. Nevertheless, Lai et al. (Reference Lai, Tsao, Lu, Lee, Zhao, Chien and Mao2009) consider that neutrophils are the major source of HP in mastitic milk, although they also showed epithelial expression. Expression of AGP in mammary tissue has been shown (Ceciliani et al. Reference Ceciliani, Pocacqua, Provasi, Comunian, Bertolini, Bronzo, Moroni and Sartorelli2005, Reference Ceciliani, Pocacqua, Lecchi, Fortin, Rebucci, Avallone, Bronzo, Cheli and Sartorelli2007), but the same group subsequently demonstrated that bovine neutrophils also express AGP (Rahman et al. Reference Rahman, Miranda-Ribera, Lecchi, Bronzo, Sartorelli, Franciosi and Ceciliani2008). To our knowledge, AGP has not previously been investigated in relation to mastitis. Our expression data provide additional indirect evidence for production of all three APPs by mastitic mammary tissue, as opposed to immune cells contained within the sample. Although we did not measure immune cells in our milk (or tissue) samples, the fact that cytokine levels increased in the Staph. aureus-challenged glands but not appreciably in the teat-sealed glands leads us to suggest that the number of immune cells was probably greater in the former than the latter. In support of this, Brouillette et al. (Reference Brouillette, Grondin, Lefebvre, Talbot and Malouin2004) observed marked infiltration of polymorphonuclear monocytes 12 h after inoculation with Staph. aureus in a mouse mastitis model. Despite this likely difference in immune cells, the expression of HP and AGP was identical in the two scenarios, and the expression of SAA3 was very similar prior to 72 h. This time-point has physiological relevance for the mammary involutionary process in mice. Sorensen & Knight (1997, unpublished data) showed that murine lactation could be ‘rescued’ by resuckling after periods of non-suckling of up to 72 h, but not thereafter. Stein et al. (Reference Stein, Morris, Davies, Weber-Hall, Duffy, Heath, Bell, Ferrier, Sandilands and Gusterson2004) demonstrated a biphasic immune response in involuting mouse mammary tissue, with an initial and rapid acute phase response followed by significant infiltration of neutrophils and macrophages only after day 4, providing additional confirmation that our data are most likely to represent actual mammary expression. At the same time, it is important to recognise that our current model represents involution due entirely to local factors within the gland, since the systemic suckling stimulus was maintained throughout. From a diagnostic point of view our model is appropriate; detecting non-pathogenic mastitis due to milk accumulation in the context of bovine or human lactation would be done when milking or suckling was continuing. On the basis of our data, we can propose that the combination of cytokine and APP measurement might allow for discrimination between pathogenic and non-pathogenic mastitis. Such discrimination is important, since the former would be likely to respond to antibiotic treatment whereas the latter would not.
The normal course of events in an inflammatory response is for local signals originating at the site of inflammation to subsequently activate hepatic cytokine and APP production (Yoshioka et al. Reference Yoshioka, Watanabe, Shimada, Murata, Yokomizo and Nakajima2002). We observed increased mammary expression of IL6 at 10 h, but the significance of this observation is uncertain because it was only in the control gland. Plasma levels of IL6 increased at 24 h, but hepatic expression remained low until 48 h. There was a generalised increase of mammary TNFα expression at 10 h, but overall our data do not shed significant light on the local signals that provide the earliest indication of an infection. IL1β had the highest and also earliest mammary expression response to Staph. aureus and is probably worthy of more detailed study if an early diagnostic tool is the target. Gunther et al. (Reference Gunther, Katrin, Poschadel, Petzl, Holm, Simone, Helmut and Hans-Martin2011) compared Escherichia coli and Staph. aureus challenge of bovine MEC in vitro and observed very marked and early stimulation of TNFα, IL6 and IL1A in response to the former, but not the latter. It is likely that early detection will be particularly challenging where Staph. aureus mastitis is concerned. Similar conclusions have been drawn by others (Bannerman et al. Reference Bannerman, Paape, Lee, Zhao, Hope and Rainard2004; Petzl et al. Reference Petzl, Zerbe, Gunther, Yang, Seyfert, Nurnberg and Schuberth2008). The plasma cytokine analysis that we performed should have been capable of detecting additional cytokines had they been present, which may have been a methodological problem but could also have indicated low responsiveness to Staph. aureus. The large increase that we observed in plasma IL1β at 72 h was accompanied by symptoms of systemic infection in some of the mice, including lack of normal behaviour, grooming and loss of appetite. Interpretation of our mammary data must take these systemic responses into account. In quantitative terms, we observed much greater expression of APP by liver than by mammary gland, but the increased plasma levels of APP were first observed at 24 h, in advance of both hepatic activation and the major increases in mammary expression. The one APP that we measured in milk, MAA was at much lower concentration than SAA in blood, but these data are not directly comparable since they were obtained using different antibodies. Kovacevic-Filipovic et al. (Reference Kovacevic-Filipovic, Ilic, Vujcic, Dojnov, Stevanov-Pavlovic, Mijacevic and Bozic2012) have recently compared bovine milk and plasma SAA and observed rather similar concentrations during Staph. aureus mastitis, but on the basis of isoform distribution concluded that plasma SAA and M-SAA did not simply equilibrate through leaky tight junctions. Our data do not allow us to speculate on the relative importance of locally or systemically produced APP in local host defence within the mammary gland. Given the different degrees of up-regulation, it is possible that liver is the major site of APP production, acting in response to inflammatory cytokines produced by the mammary gland. However, this cannot be stated with certainty.
In conclusion, we observed different patterns of mammary expression of inflammatory cytokines and APPs in pathogenic vs. non-pathogenic mammary inflammation in a mouse model. This could potentially form the basis for differential diagnosis of the two conditions. Further research is needed to clarify the interrelationships between cytokine and APP production in mammary tissue and liver.