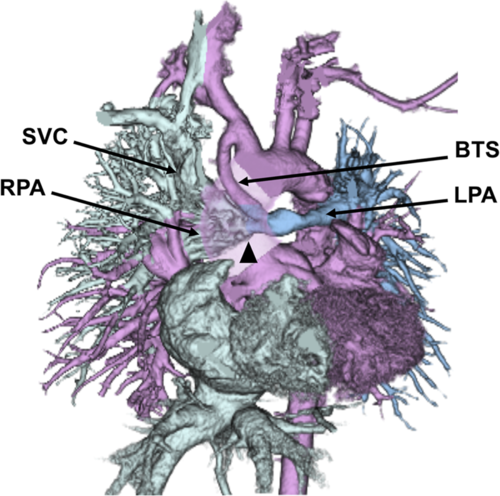
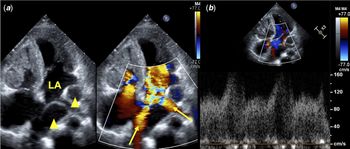
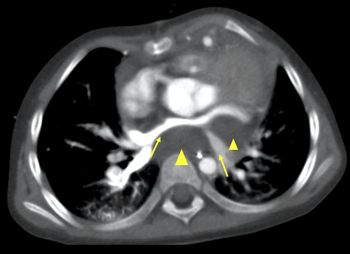
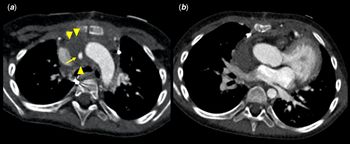
A 3-year-old girl was diagnosed with pulmonary atresia with intact ventricular septum at birth. She had undergone right-sided modified Blalock–Taussig shunt when 1 month old, followed by the bidirectional Glenn procedure, and shunt removal when 7 months old. However, Fontan procedure could not be performed due to residual hypoplasia of the left pulmonary artery. Therefore, left-sided modified Blalock–Taussig shunt and intra-pulmonary artery septation were performed. The brachiocephalic and left pulmonary arteries were connected using a polytetrafluoroethylene graft, and a polytetrafluoroethylene sheet was placed into the pulmonary artery lumen (Fig 1). On post-operative day 6, she developed shock without pre-cursor symptoms. Transthoracic echocardiography and chest computed tomography revealed compression of both the pulmonary veins and pulmonary venous flow acceleration by a cystic lesion on the posterior aspect of the left atrium (Figs 2 and 3). Emergency surgical drainage was performed, and serous fluid accumulation in the dorsal aspect of the left atrium was found. Thus, diagnosis of post Blalock–Taussig shunt seroma was confirmed. Pericardial, anterior mediastinal, and right thoracic tubes were placed. The drained fluid was not serous but slightly bloody (considered normal post-operatively). Given the low drainage volume, the thoracic tube was removed 6 days post-operatively, and the others, 10 days later. Post-operative computed tomography revealed persistence of the seroma surrounding the graft (not related to the shock), although the shock-related seroma disappeared (Fig 4). Although tracheal compression due to seroma has been reported,Reference Jennifer, Wojtek and Deborah1 this was a rare case of pulmonary vein compression where the seroma was not in contact with the shunt.
Three-dimensional computed tomography shows the anastomotic site of the polytetrafluoroethylene sheet in the pulmonary artery lumen (arrow head, BTS, Blalock–Taussig shunt; LPA, left pulmonary artery; RPA, right pulmonary artery; SVC, superior caval vein). The ascending aorta was omitted to show the Blalock–Taussig shunt on the posterior aspect.

(a) Four-chamber view of two-dimensional transthoracic echocardiography showing the cystic lesion on the posterior aspect of the left atrium (arrow heads) and accelerated flow of both main pulmonary veins (arrows, LA, left atrium); (b) Pulsed wave Doppler shows that the peak flow velocity in the pulmonary vein is approximately 150 cm/second.

Contrast enhanced computed tomography showing the low-density lesion behind the left atrium (arrow heads) and pulmonary vein compression (arrows).

(a) Post-operative computed tomography showing that the Blalock–Taussig shunt had opened (arrow) and the perigraft seroma persisted (arrow heads). (b) Serous fluid accumulation on the posterior aspect of the left atrium had disappeared.

Acknowledgements
None.
Financial support
This research received no specific grant from any funding agency, commercial, or not-for-profit sectors.
Conflicts of interest
None.
Ethical standards
Not applicable.