1 Introduction
The expectations of economic agents play a crucial role in almost any inter-temporal economic model. This certainly applies to the decisions of working age individuals that relate to pension and retirement planning, which automatically require agents to be forward looking in a life-cycle context. This is probably one of the reasons why measuring individuals’ expectations has become particularly popular in the context of the economics of ageing; see, e.g., Hurd (Reference Hurd2009). With the recent and ongoing pension reforms in many countries, individual responsibility for pension planning increases, increasing the relevance of what drives consumers’ pension related expectations and decisions and how this varies across socioeconomic groups.
In this paper, we study the Dutch adult population's subjective expectations on household income, on the retirement age, and on pension income, using household panel data with four waves administered in 2009–12. This was a time period of ongoing pension reforms in combination with a deep economic crisis. We first analyze consumers’ short-run expectations of the development of the crisis and its financial and labor market impact on the household. Second, we study how these perceptions of the crisis are associated with subjective expectations of the adequacy of next year's household income. Comparing expected changes in household income adequacy with realizations reported 12 months later, we also analyze the deviations between realizations and expectations, and how they are shaped by what people think about the nature of the crisis.
We then analyze the subjective expectations of the retirement age and pension income replacement rates. We consider how they change over time (due to either the pension reforms or the recession) and then focus on how they vary across socio-economic groups and with the crisis perceptions.
A few other studies have considered consumers’ subjective expectations during the recent recession. Christelis et al. (Reference Christelis, Georgarakos and Jappelli2011) find that among older Americans, the consumption drop during the crisis is larger for those who expect that the negative shocks to the asset markets are permanent than for those who expect them to be temporary, suggesting that individuals respond in a plausible way to more optimistic or pessimistic expectations. Hurd and Rohwedder (Reference Hurd, Rohwedder, Maurer, Mitchell and Warshawsky2012a ) analyze how several subjective probabilities of Americans aged 50 and over changed from 2008 to 2009, and conclude that the crisis led to more pessimism about house and stock price developments, to later expected retirement, and, in particular, to lower expected bequests. This pessimism is reflected in lower spending and higher saving. The pessimism concerning stock and housing markets is confirmed using data covering the complete adult population in the US from November 2008 until April 2010 in Hurd and Rohwedder (Reference Hurd and Rohwedder2010). Banks et al. (Reference Banks, Crawford, Crossley and Emmerson2013) find evidence that among the 50+ population in England, negative wealth shocks due to the crisis reduced the probability of leaving a bequest. On the other hand, Crawford (Reference Crawford2013) finds no effect on the expected age of retirement among older UK workers.
As expected, we find that the expectations of short-run changes in income adequacy are associated in a plausible way with consumers’ perceptions of the crisis. More interesting is that the same applies to realized changes in income adequacy: those who are afraid the crisis will affect their family or are more concerned about losing their job, more often report a negative change in income adequacy 12 months later (keeping other variables constant), confirming that the subjective crisis perceptions indeed have predictive value for changes in actual income adequacy in the expected direction. The higher educated attach a higher likelihood to a (substantial) increase as well as a (substantial) fall in income adequacy, suggesting that they are more uncertain about changes in their future income during the recession than the lower educated groups.
When considering pension expectations, aggregate changes over time have to be interpreted with care since pension reforms and recession coincided, and the short time period covered by our data makes it impossible to disentangle the two effects. We therefore focus on the variation across consumers with different characteristics and crisis perceptions, revealing some interesting and plausible patterns. For example, we find that people who think the crisis will affect them more severely expect an older earliest age at which they can retire. People who are concerned about losing their job during the crisis also have more uncertainty concerning their pension income replacement rate. The most salient differences in the subjective pension income replacement rate distributions are those related to education level: higher educated groups expect lower replacement rates, but are also less uncertain about their replacement rates.
Overall, the relations between crisis perceptions, income expectations, realized income changes, and pension expectations and their associations with background characteristics are largely in line with the notion that individuals form their expectations according to the precepts of financial theory. In this sense, our findings are an addition to the growing literature demonstrating that investors behave according to financial theory, such as Calvet et al. (Reference Calvet, Campbell and Sodini2007, Reference Calvet, Campbell and Sodini.2009), Calvet and Sodini (Reference Calvet and Sodini2014) and Betermier et al. (Reference Betermier, Calvet and Sodini2014).
The remainder of this paper is organized as follows. Section 2 gives a brief overview of the development of the crisis and the debate on pension reforms in the Netherlands over the time period covered by the data. Section 3 describes the data used in the analysis. In Section 4, the variables describing the respondents’ perceptions of the crisis are analyzed. Section 5 focuses on how the perception of the crisis relates to expectations of next year's income adequacy and deviations between expected and realized changes in income adequacy. Section 6 analyzes how the perception of the crisis and other factors determine retirement expectations. Section 7 concludes.
2 The crisis, pensions, and pension reforms in the Netherlands
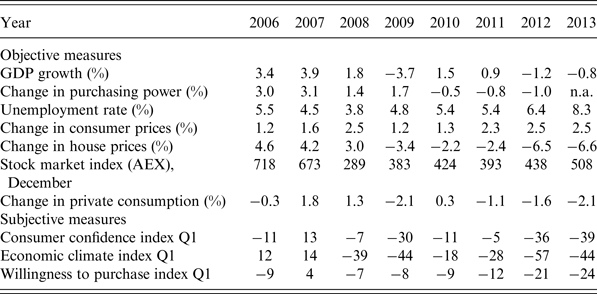
To sketch the context that the respondents faced when answering the survey questions over the time period considered (2009–12), we briefly discuss some crisis indicators and the public debate on pensions and reforms. Table 1 presents some macro-economic indicators for the Netherlands in the time period 2006–13. It shows that the timing of the crisis is ambiguous. While the Amsterdam stock exchange index already went down in 2007, dropped dramatically in 2008, and partly recovered since 2009, gross domestic product (GDP)-growth remained positive until 2008, purchasing power started falling from 2009, and unemployment remained fairly stable until a dramatic increase in 2012. This is what one would expect in an asset-pricing model, since the stock market is forward-looking and tends to lead the real economy. The subjective indexes in the bottom panel of the table confirm that consumers perceived the crisis as very serious in 2009. They saw some recovery in 2010 but are remarkably pessimistic in 2012 and 2013, a time period when other countries already seemed to have perceived the end of the recession. Still, the pessimism of Dutch consumers in 2012 and 2013 seems rational ex post, since Dutch GDP fell in both years. The timing of the crisis clearly differed with that in other countries. For example, Hurd and Rohwedder (Reference Hurd and Rohwedder2012b , p. 14) find that in the US, spending started recovering from the second quarter of 2010. Still, the notion that subjective indexes of the perception of the crisis lag behind the objective crisis indices is in line with findings for the US, where the crisis formally ended in June 2009 but pessimism among private consumers remained large for a much longer time period (Hurd and Rohwedder, Reference Hurd and Rohwedder2010, Reference Hurd, Rohwedder, Maurer, Mitchell and Warshawsky2012a ).
Objective and subjective macro-economic indicators, 2006–13

Source: Statistics Netherlands, Statline; http://statline.cbs.nlhttp://statline.cbs.nl (retrieved Summer 2014)
Consumer confidence index: based upon five subjective questions on own financial situation and economic situation in general
Economic climate index: based upon two subjective questions on economic situation in general.
Willingness to purchase index: based upon three subjective questions on own financial situation and whether it is a good time for large purchases.
Changes in pension and retirement expectations over this period were not only induced by the crisis, but also by a sequence of reform plans and actual reforms in the Dutch pension system; see, for example, Goudswaard (Reference Goudswaard2013) for an overview. The Dutch pension system is characterized by a flat rate pay-as-you-go state pension at the subsistence level for everyone who has continuously been a Dutch resident from age 15 until age 65, in combination with a relatively large second pillar of mandatory occupational pensions, covering more than 90% of Dutch employees (see, e.g., OECD, 2011). The large majority of occupational pensions have a defined benefit nature, with risk sharing across participating employees of several generations in the same firm or the same sector of industry. Compared to other countries, replacement rates of the combined first and second pillar are high. There is also substantial dispersion, but the subsistence level state pension helps to reduce poverty among the elderly. In 2013, the Dutch system ranked second after Denmark according to the overall Melbourne Mercer Global Pension Index which ranks 20 countries in the world. It ranked first in pension adequacy, second in integrity (after Australia), and third in sustainability (after Denmark and Sweden); see Australian Centre for Financial Studies and Mercer (2013).
Still, already in the years before the crisis the sustainability of state and occupational pensions has been under pressure. Population ageing has increased the costs of the pay-as-you-go state pension. After several proposals that for various reasons were never implemented, the government implemented a reform in 2012 that gradually increases the eligibility age for a state pension to 67 years in 2021. For younger cohorts, the eligibility age will be linked to life expectancy, which means that it will probably rise further. Moreover, occupational pension funds have experienced a deterioration of their financial position due to low interest rates and poor investment returns on the stock market during the financial crisis. This has prevented them from compensating the pension benefits for inflation, and has even in many cases made them cut nominal pension levels. The latter happened on a large scale for the first time in 2013, when many pension funds felt forced to reduce benefit levels of current and future retirees by up to 10%.Footnote 1 Further reductions are implemented by a smaller number of pension funds in 2014.
As in many other countries, already in the years before the crisis, pension funds cut down generous early retirement arrangements that made it possible to retire before the standard retirement age (then 65) without any reduction in annual pension benefits. As a consequence, labor force participation of the age group 55–65 has increased substantially over the past decade. The average retirement age of employees increased from 61.0 years in September 2006 to 63.9 years of age in September 2013.Footnote 2 In response to the increase in the state pension eligibility age, pension funds have started working with higher benchmark retirement ages, but there is a tendency toward flexibility, with occupational pension arrangements allowing for retirement in some age band and an actuarially fair reduction or increase in the pension benefit level in case of earlier or later retirement, and including opportunities for gradual retirement. Van Vuuren (Reference Van Vuuren2014) argues that for most workers, flexibility in retirement can be realized through the second pillar, even if there is no flexibility in the subsistence level state pension. There are no plans to replace defined benefit (DB) by defined contribution (DC) pensions at a large scale, but the nature of the DB pension is going to change (Goudswaard, Reference Goudswaard2013). The current DB contracts provide nominal guarantees, but due to inflation, these guarantees are not meaningful in the long run and may even misguide consumers due to money illusion. The general public is not well aware of the risk of incomplete indexation (i.e., incomplete compensation for wage or price inflation) for future purchasing power. The new plans involve making these risks more explicit and allow for a choice between nominal guarantees or a real ‘defined ambition’ contract where part of the longevity and inflation risks are born by the consumers. In terms of purchasing power, these pensions involve about the same risk as existing DB plans with nominal guarantees (CPB, 2012, Figure 5.7).
The mandatory retirement age used to be 65. It will probably follow the state pension eligibility age and rise till 67 years and even further in the longer run. Opportunities to work beyond the mandatory retirement age are scarce but may increase in the future, in line with the tendency toward more flexibility. The extent to which employers will be willing to cooperate with the several forms of flexibility, however, is not yet clear. A promising sign is that, as shown by Van Vuuren (Reference Van Vuuren2014), there has been a substantial increase in the number of part-time jobs in the age group 65–69 (beyond the standard retirement age) from 1992 until 2008, accounting for almost the complete labor market participation increase in that age group.
3 Data
The data are taken from the Netspar Pension Monitor (NPM), a survey initiated and funded by Netspar (the (Dutch) Network for Studies on Pensions, Aging and Retirement). This survey was administered to respondents who participate in the ongoing CentERpanel, an online panel survey administrated by CentERdata affiliated with Tilburg University.Footnote 3 The CentERpanel covers the population in the Netherlands of ages 16 and older and consists of households in which one or more adults are invited to complete questionnaires over the Internet every weekend. Households are randomly selected from the Dutch population registers, and those without prior Internet access are given access and the necessary equipment. About 75% of all panel members respond to the questions in a given weekend. Panel attrition is compensated by an annual refreshment sample.
The questionnaires of the NPM are distributed to all CentERpanel members of ages 25 and older (since younger respondents were assumed not to think much about pensions or retirement). Data collection started in Summer 2006 and ended in December 2012. The NPM consists of short monthly questionnaires including questions on expectations concerning pension reforms and on satisfaction with pension provisions and the pension system, which have been analyzed elsewhere (see, e.g., Bissonnette and van Soest, Reference Bissonnette and van Soest2012; De Bresser and van Soest, Reference De Bresser and van Soest2015) and a longer annual survey (usually administered in June) including the questions on expected retirement and replacement rates, expected income changes, and, since 2009, the perceived importance of the crisis. The early waves of annual data on expected replacement rates have been analyzed in Van Santen et al. (Reference Van Santen, Alessie and Kalwij2012) and De Bresser and van Soest (Reference De Bresser and van Soest2013, Reference De Bresser and van Soest2015). In the present paper, we reanalyze these data focusing on their relation to the perception on the crisis (the data on which have not been used in earlier studies). The data on income change expectations and realizations are similar to the older data used in earlier studies of, for example, Dominitz and Manski (Reference Dominitz and Manski1997) and Das and van Soest (Reference Das and van Soest1999). Here our main goal is to investigate whether systematic deviations between realizations and expectations are related to background characteristics and the perceived nature and impact of the crisis.
3.1 Perceptions of the effects of the crisis
We will use five variables on the perception of the crisis and its potential effect on retirement. They are the answers to the survey questions on how much respondents agree with five statements, on a scale from 1 (not at all) to 10 (completely). The first two questions refer to the influence of the crisis on the respondent and his or her household:
-
• Cris_family: I am afraid the crisis will affect my family in the next 12 months.
-
• Cris_job: I am confident that I will keep my current job in the next 12 months.
-
• The other three questions refer to the (potential) effect of the crisis on retirement planning:
-
• Cris_delay: I would rather delay retirement for a few years than save more.
-
• Cris_retage: I do not think the crisis will affect when I retire.
-
• Cris_retinc: I do not think the crisis will affect the level of my retirement income.
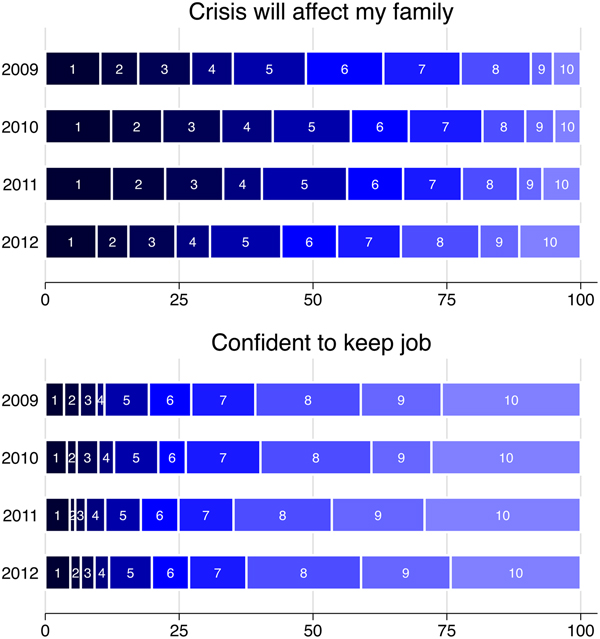
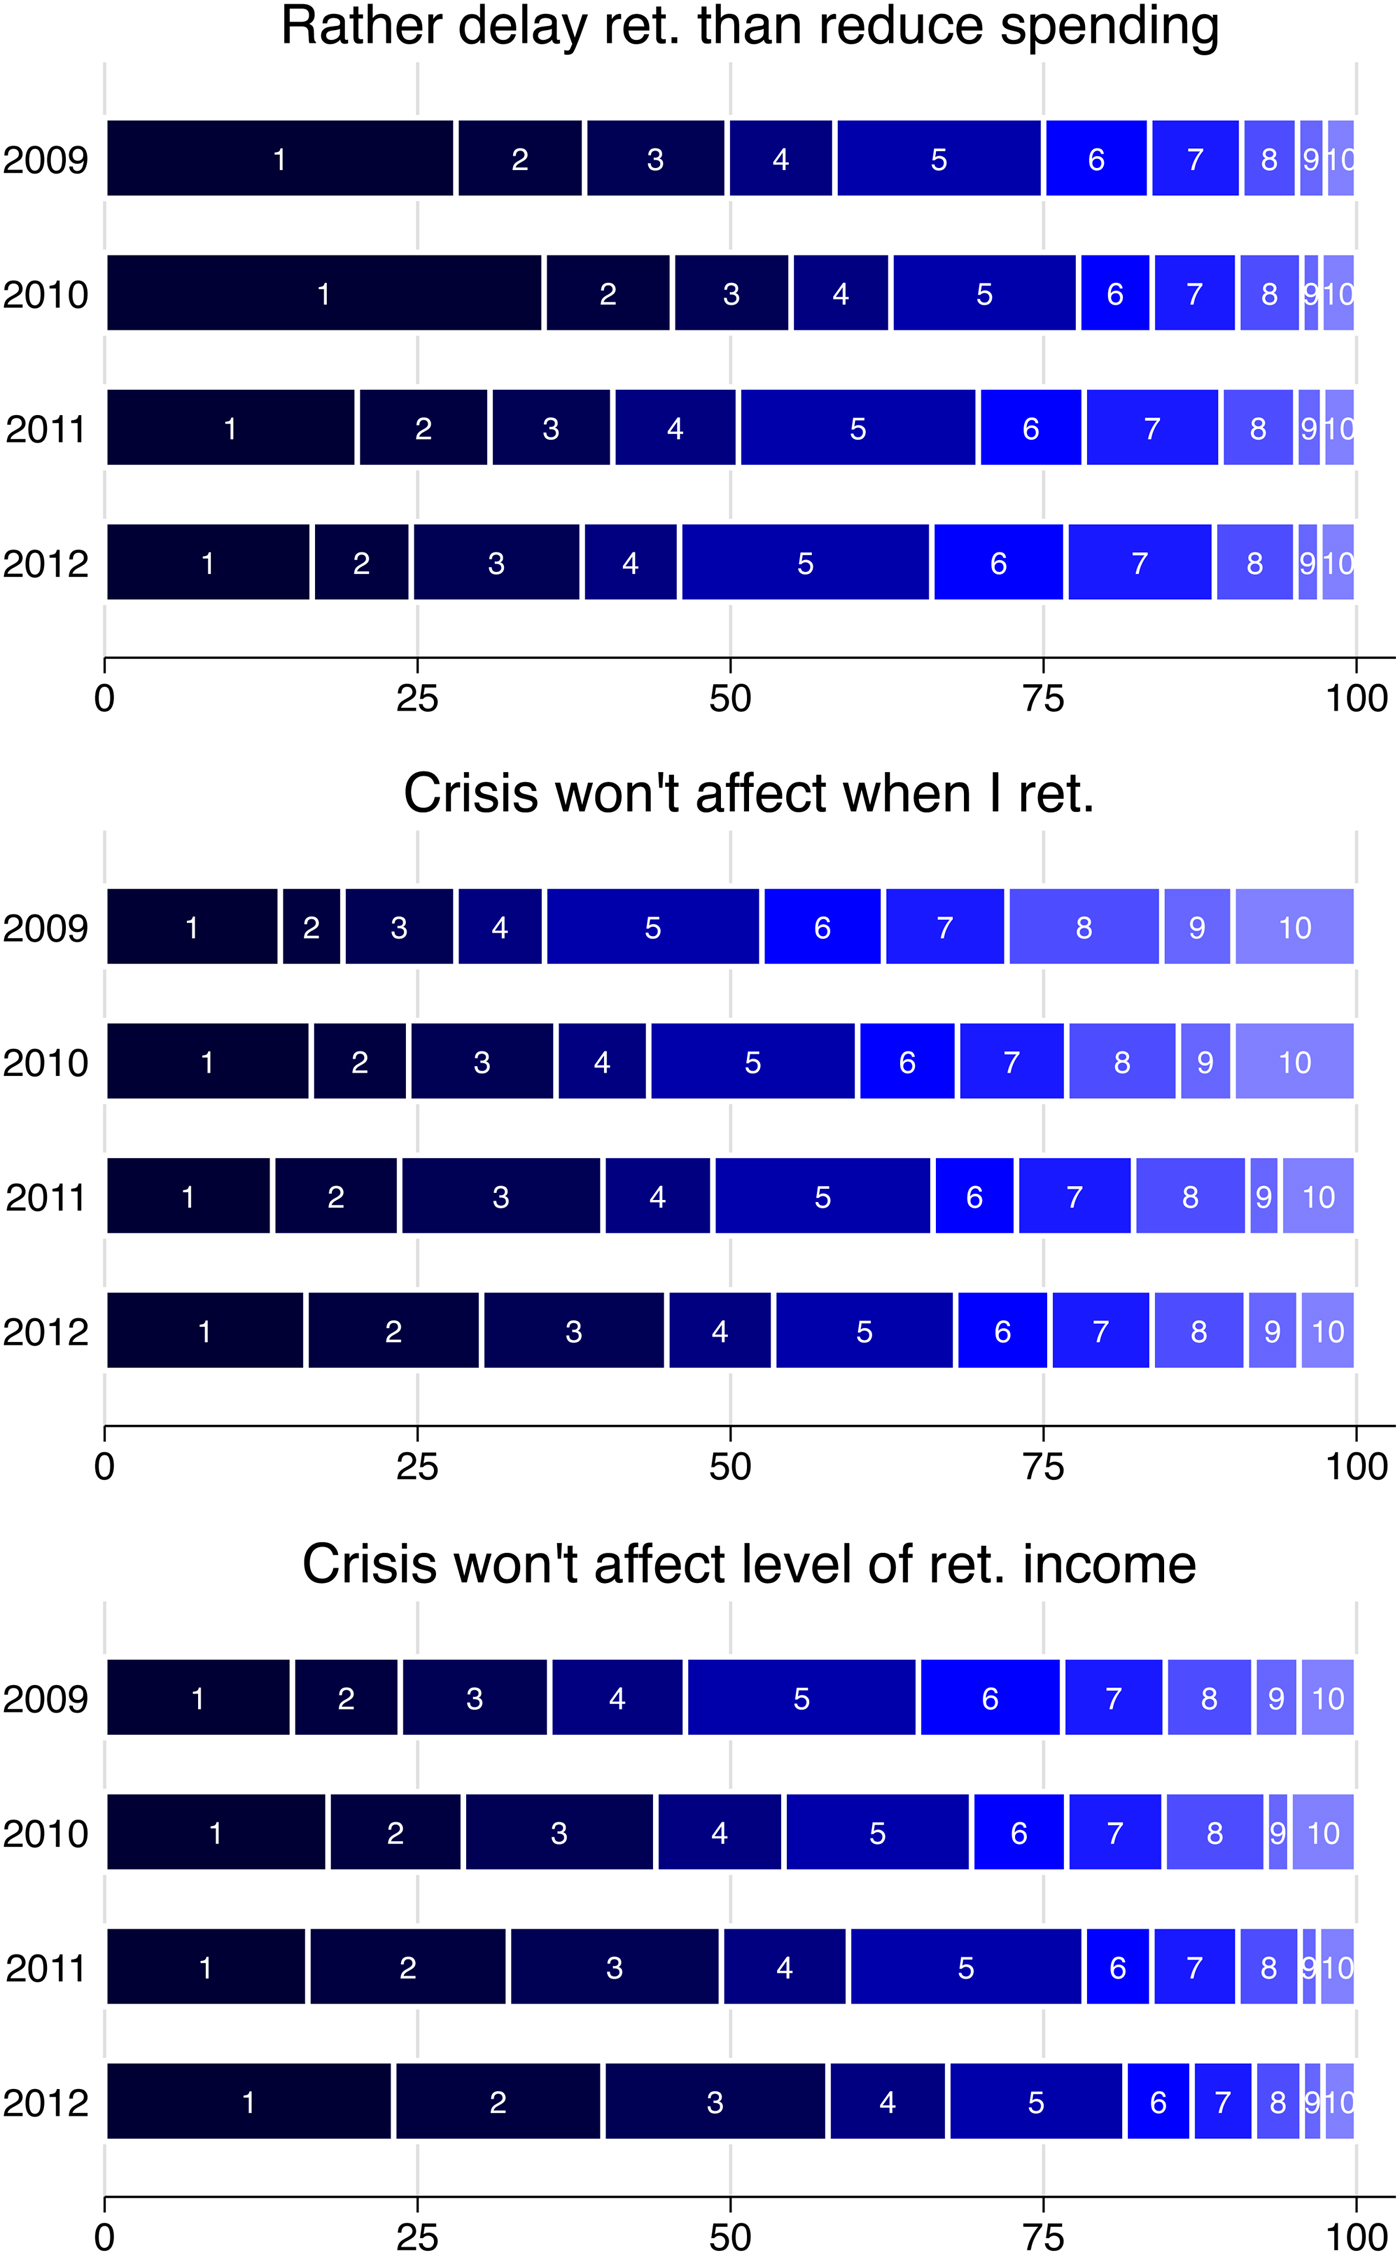
Note that most of the questions are framed in a positive manner, such that higher values for the answers given by the respondent indicate more optimism. The exception is the effect of the crisis on the respondent's family. Figures 1 and 2 show how the frequency distributions of the answers to the five questions developed over time. The way these figures are organized is based upon Schwabish (Reference Schwabish2014). Each bar shows the relative frequencies as well as the cumulative distribution of the variable in a given year, making it easy to compare the distributions over the years. The first panel in Figure 1 shows that many respondents think the crisis will affect their family in the next 12 months. This is particularly so in 2012 and 2009, when high scores are more common than in the other years. The boundary between, for example, 7 and 8 is further to the left in 2012 and 2009, implying that the proportion of respondents answering 8 or more is higher in these 2 years. The large degree of pessimism in 2012 is in line with the 2012 drop of consumer confidence and the perception of the economic climate in Table 1.
(colour online) Frequency distribution of answers to the questions concerning the effect of the crisis on family and possibility of job loss by survey year. Scale: 1 (do not agree at all) to 10 (fully agree).

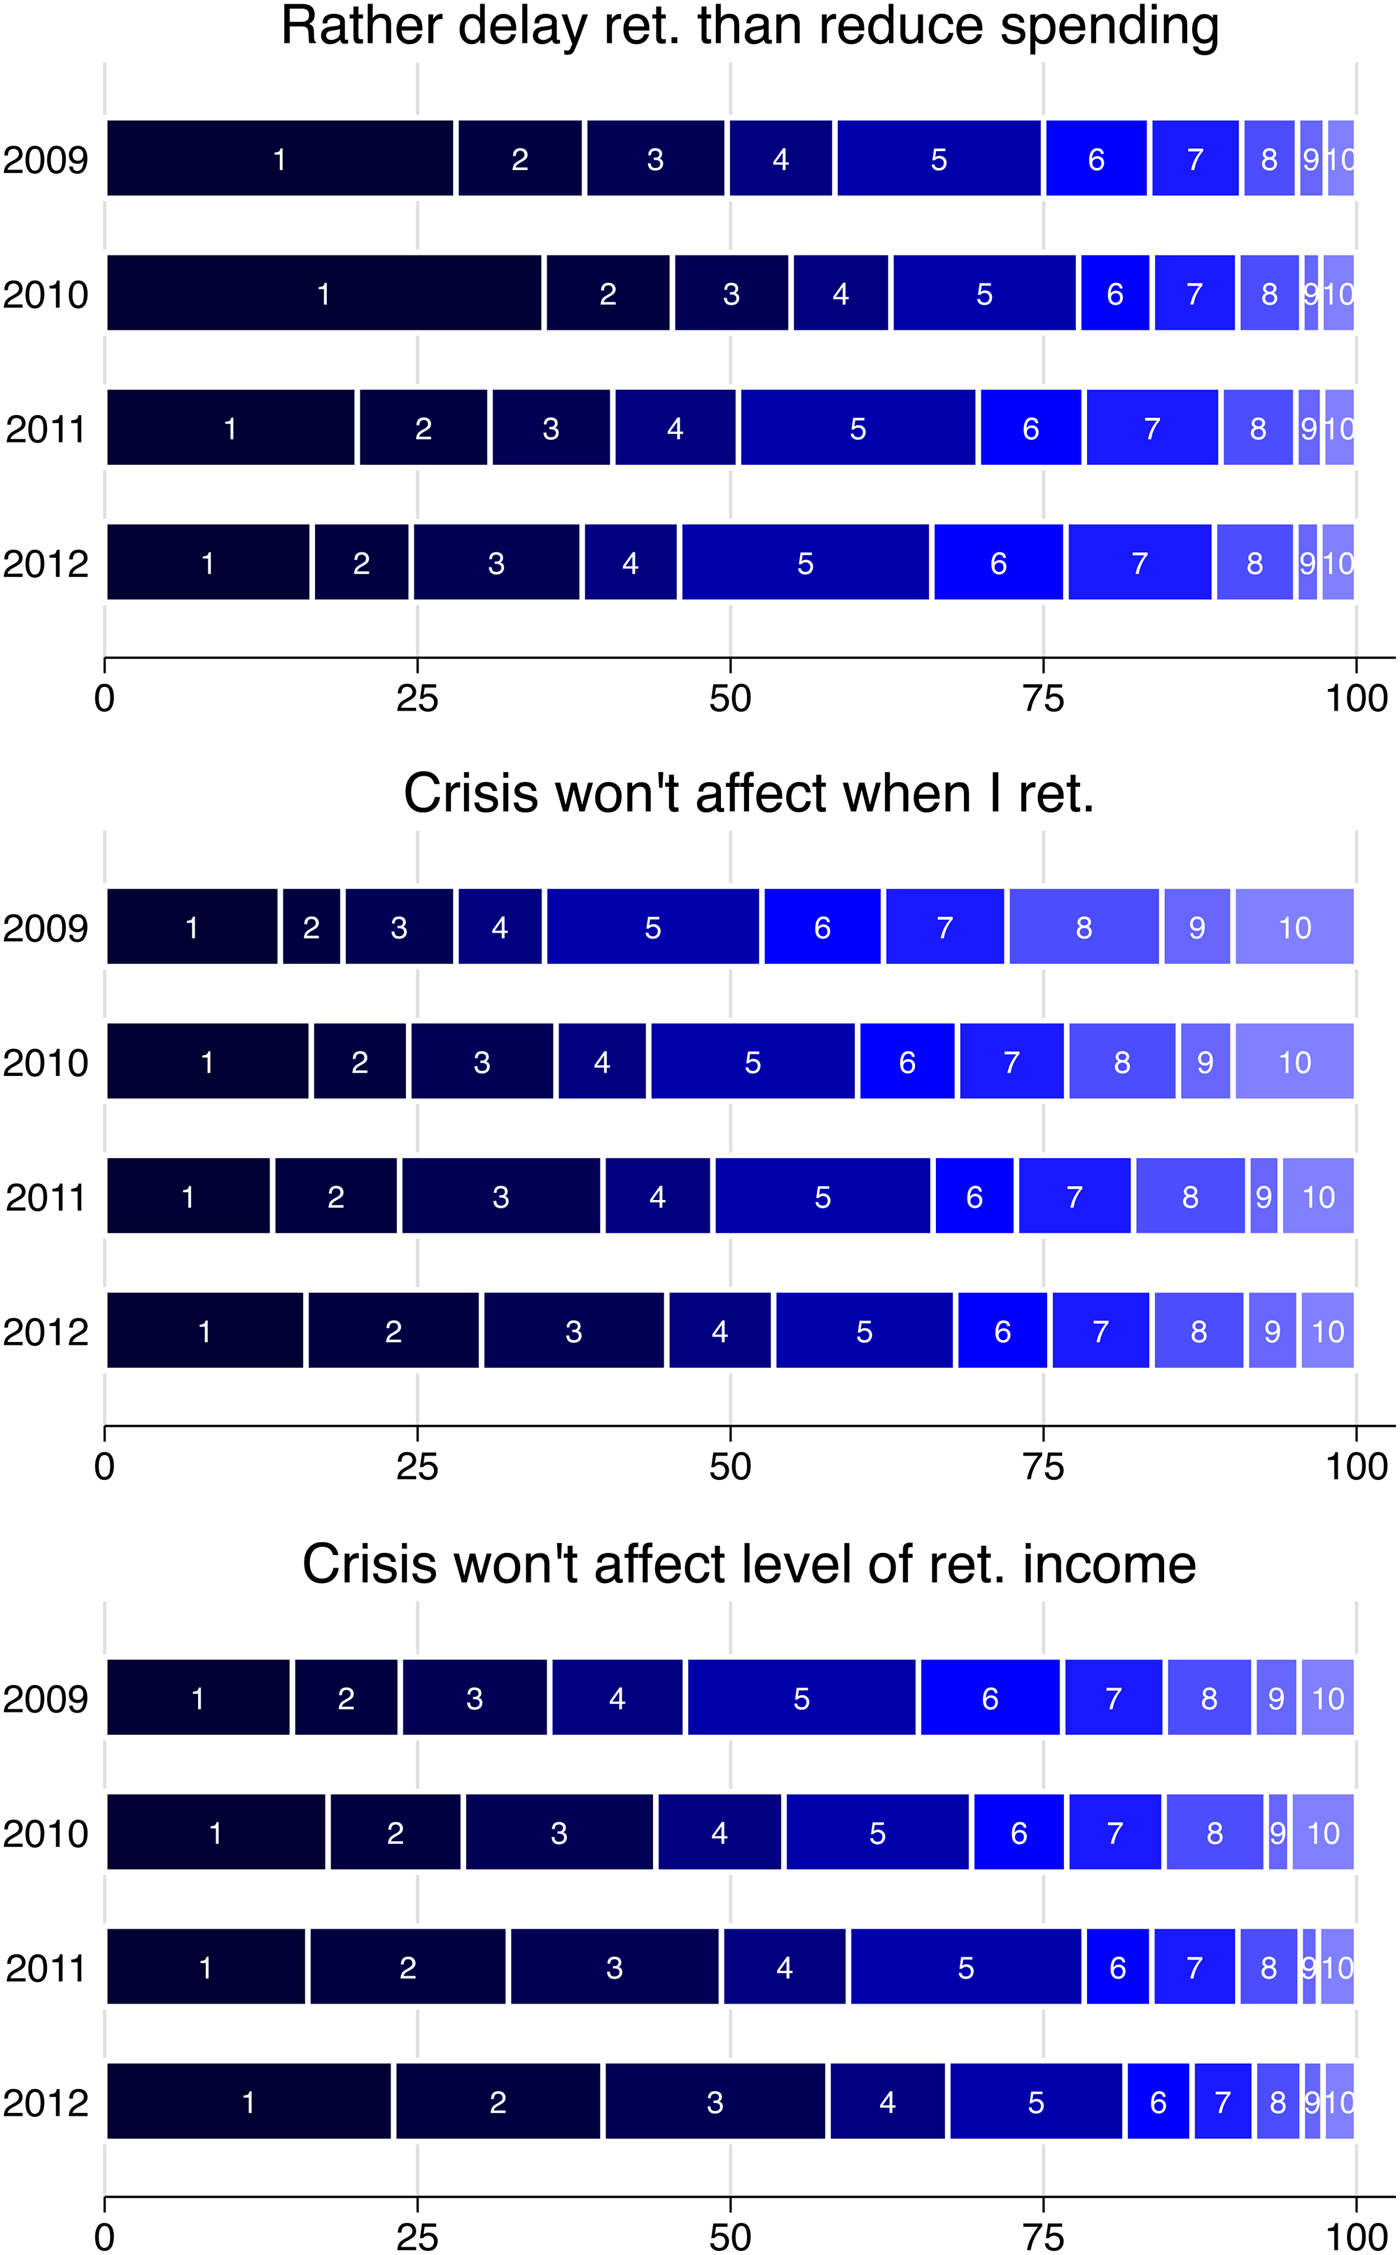
(colour online) Frequency distribution of answers to the questions concerning potential effect of the crisis on retirement planning by survey year. Scale: 1 (do not agree at all) to 10 (fully agree).
The respondents are generally much less concerned about losing their current job in the next 12 months (second panel of Figure 1). This makes sense, since losing the job due to the crisis is only one way in which the crisis can affect the household, but certainly not the only way. Earnings could fall even though the job is not lost, other household members could lose their job, etc. The respondents are somewhat more pessimistic about keeping their job in 2012 than in 2011, but differences between 2012 and 2009 or 2010 are very small.
The first panel of Figure 2 shows that the willingness to delay retirement instead of increasing savings for retirement has increased in 2011 and 2012. This may relate to the policy reforms, which at that time involved the decision to raise the future eligibility age for state pensions, with the idea that this also will lead to a substantial increase of the average retirement age. The clearest time trends are found in the two bottom panels: more and more respondents are convinced that the crisis will affect their retirement age and their retirement income. This is probably not only because the crisis in general appeared to be more serious than it seemed initially, but also because of the reforms of the state pension already mentioned above and the ongoing negative publicity on the financial problems of occupational pension funds. These financial problems implied that occupational pension funds could not compensate future and current pensioners for inflation and thus led to cuts in real pensions (though nominal pension cuts only came in the next year; see Section 2).
3.2 Income adequacy expectations and realizations
The question on the realized change in income adequacy is the following:
-
• Compared to 1 year ago, has the purchasing power of your household increased or decreased? (increased/decreased/stayed the same) NB: with the purchasing power of an income we mean how much can be bought for this income.
Two subjective probability questions on the expected adequacy of income change immediately follow after the question on the realized change.
-
• What is the probability that 1 year from now, the purchasing power of your total household income will be larger than it is now? The probability that next year we can buy more for our household income is …. percent.
-
• What is the probability that 1 year from now, the purchasing power of your total household income will be smaller than it is now? The probability that next year we can buy less for our household income is …. percent.
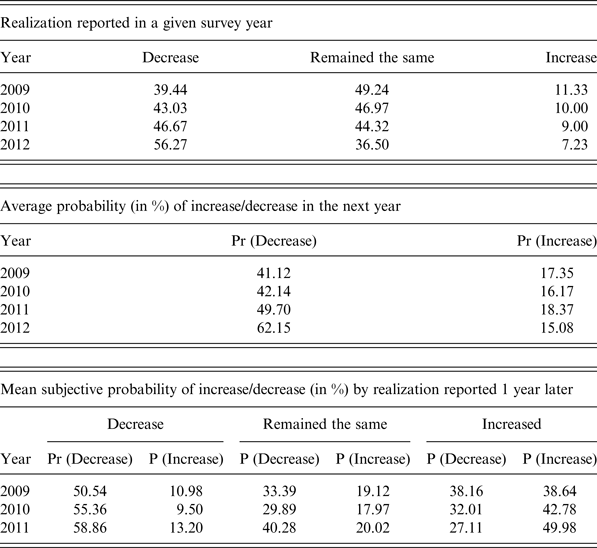
The first panel of Table 2 shows how realized purchasing power changes have developed over time. The negative effect of the crisis is clear and increases over time: The percentage of households reporting a fall in purchasing power increases over the years to more than 56% in 2012, and is always much larger than the percentage reporting an increase.
Mean probabilities of decrease and increase in purchasing power over the next year and realizations 1 year later

Note: This panel gives the average subjective probabilities for three groups of respondents: those who 12 months later reported that their income adequacy increased, fell, or remained the same.
The second panel shows the expectations for the next 12 months. The average probabilities of an increase in purchasing power are rather small and do not change much over the 4 years. On the other hand, the probabilities of a reduction are much larger and increase substantially, particularly from 2011 to 2012. This is all in line with the notion that people perceived the crisis as more and more severe over time. Most people attach a low probability to a purchasing power increase, and this does not change much over time. The percentage of respondents who reported that the purchasing power of their household income would fall with 100% certainty, rose from almost 11% in 2009 to almost 26% in 2012.
If all shocks are idiosyncratic and average out, if respondents have rational expectations, and if they use the same distinction between an increase, a decrease, and no change of purchasing power in the expectations and realizations questions, then we would expect the average subjective probabilities in the second panel to be similar to the realized percentages in the first panel concerning the same time period. In fact, there are some deviations, but they are not very large. They suggest that respondents ex post were not pessimistic enough – income changes turned out worse than expected. For example, the realized percentages with an increase and decrease from 2011 to 2012 are 7.2 and 56.3, while the average probabilities reported in 2011 were 18.4 and 49.7. Compared to their expectations, fewer people than expected actually experienced an increase, and more people than expected actually experienced a fall. We cannot say here whether this is due to an unanticipated common shock or non-rational expectations.
The bottom panel of the table compares expectations and realizations for the same 12 months periods. It shows a clear but imperfect positive relation between expectations and realizations, as expected. For example, those who reported their purchasing power had fallen in the 12 months between Summer 2011 and Summer 2012 had given an average reported probability of a decrease of 59% 12 months earlier (last row, first column), while for those who reported an increase from Summer 2011 until Summer 2012, the average probability of a decrease was much smaller (27%; last row, fifth column). In other words, the predicted probabilities of a reduction in purchasing power of their household income were much larger among those who ex post indeed experienced such a reduction than among those who experienced an increase in their purchasing power. The results for the predicted probability of an increase in purchasing power also point in this direction: among those who experienced an increase from 2011 until 2012, the average reported probability of an increase was almost 50% (last row, last column), while among those who experienced a reduction in purchasing power it was only 13% (last row, second column). All these results suggest that most respondents were able to predict whether their household's purchasing power would increase, fall, or remain the same in the next 12 months.
3.3 Retirement expectations
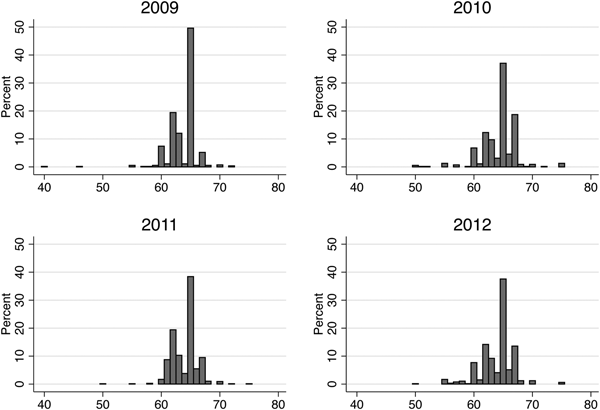
The expected (earliest) retirement age is the answer to the question: ‘What is the earliest age at which you think you can retire?’ The answer has to be between ages 50 and 75.Footnote 4 The distributions of the answers are given in Figure 3. The mode is age 65 in all years, although the size of the peak at 65 decreases somewhat from 2009 till 2010. Still, the distribution is surprisingly stable over time, with sample means equal to 63.9 in 2009, 64.3 in 2010, and 64.0 in 2011 and 2012. It seems that the tendency toward later retirement is compensated by a tendency toward more flexibility, so that the average earliest retirement age hardly changes.Footnote 5
Frequency distribution of the earliest age at which respondents report they can retire by survey year.

Retirement replacement rate expectations are measured using a set of subjective probability questions. Since this has been described extensively in Van Santen et al. (Reference Van Santen, Alessie and Kalwij2012) and De Bresser and van Soest (Reference De Bresser and van Soest2013, Reference De Bresser and van Soest2015), we explain it only briefly here. Six survey questions on the retirement income replacement rates (RIRRs) were asked to all respondents who worked as employees. These questions were phrased as follows (where the part in brackets is the reported earliest retirement age discussed above):
If you would retire at (earliest retirement age), please consider your net total pension income including public pension, relative to your present net wage or salary. What would you think is the probability that your net total pension income in the year after retirement will be worth in terms of purchasing power … Less than 100% of your present net wage? … Less than 90% of your present net wage? … … Less than 50% of your present net wage?
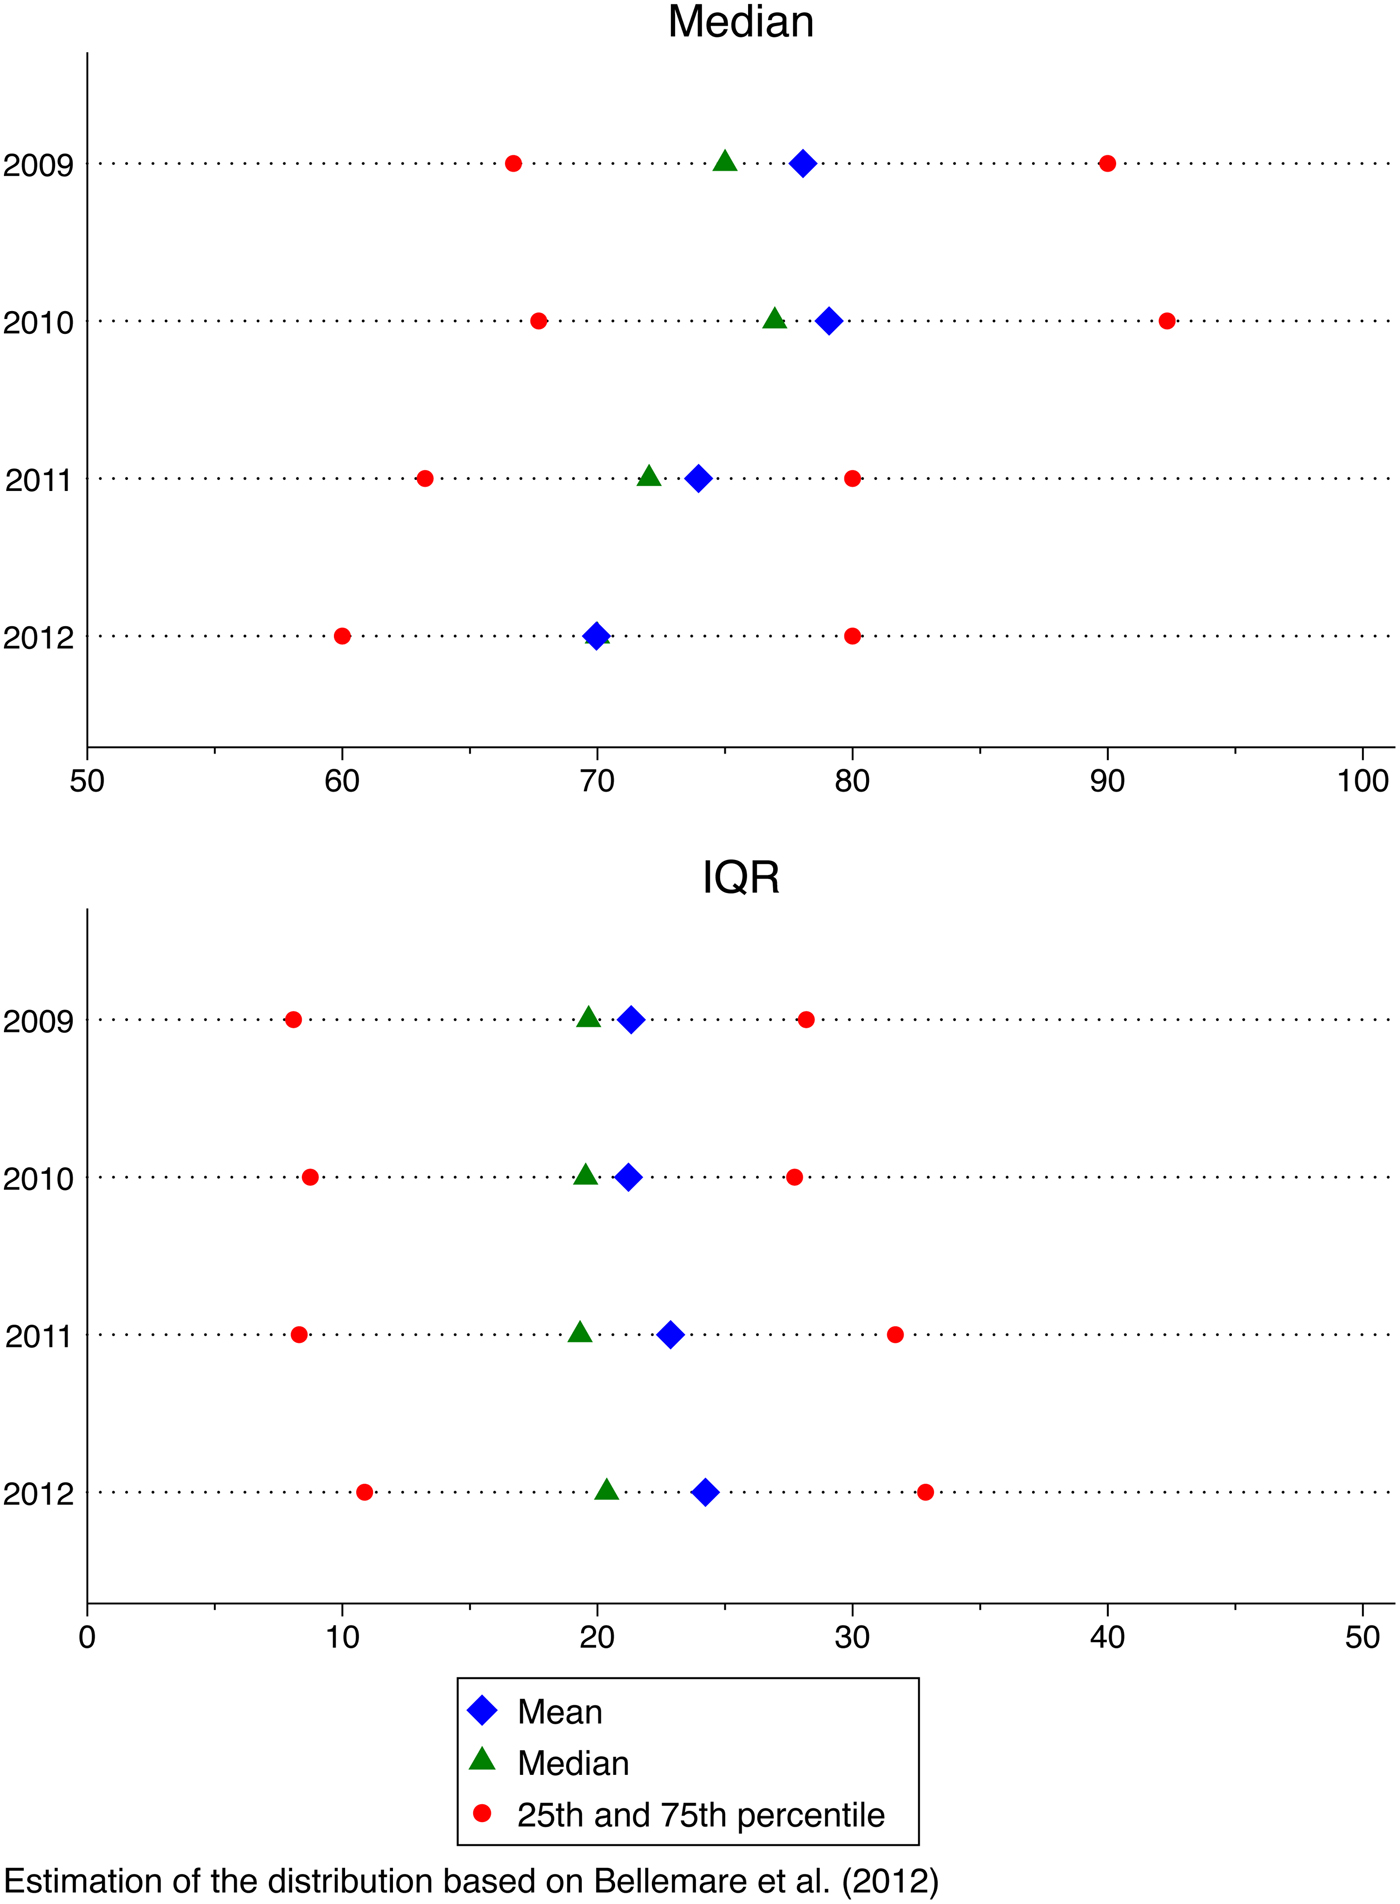
The answers to these six questions for a given respondent in a given year provide six points on the graph of the respondent's subjective cumulative distribution function of their RIRR. Following Bellemare et al. (Reference Bellemare, Bissonnette and Kröger2012) and De Bresser and van Soest (Reference De Bresser and van Soest2015), these six points are used to nonparametrically estimate the complete subjective distribution of the future RIRR for each observation. The distribution function is obtained by linking the six points corresponding to the reported probabilities using splines, imposing monotonicity. The variables used for further analysis are the medians and the interquartile ranges (IQR, the difference between the 75th and 25th percentile) of these subjective distributions. How their distributions develop over time is illustrated in Figure 4.
(colour online) Mean and quantiles of median and IQR of subjective replacement rate distributions
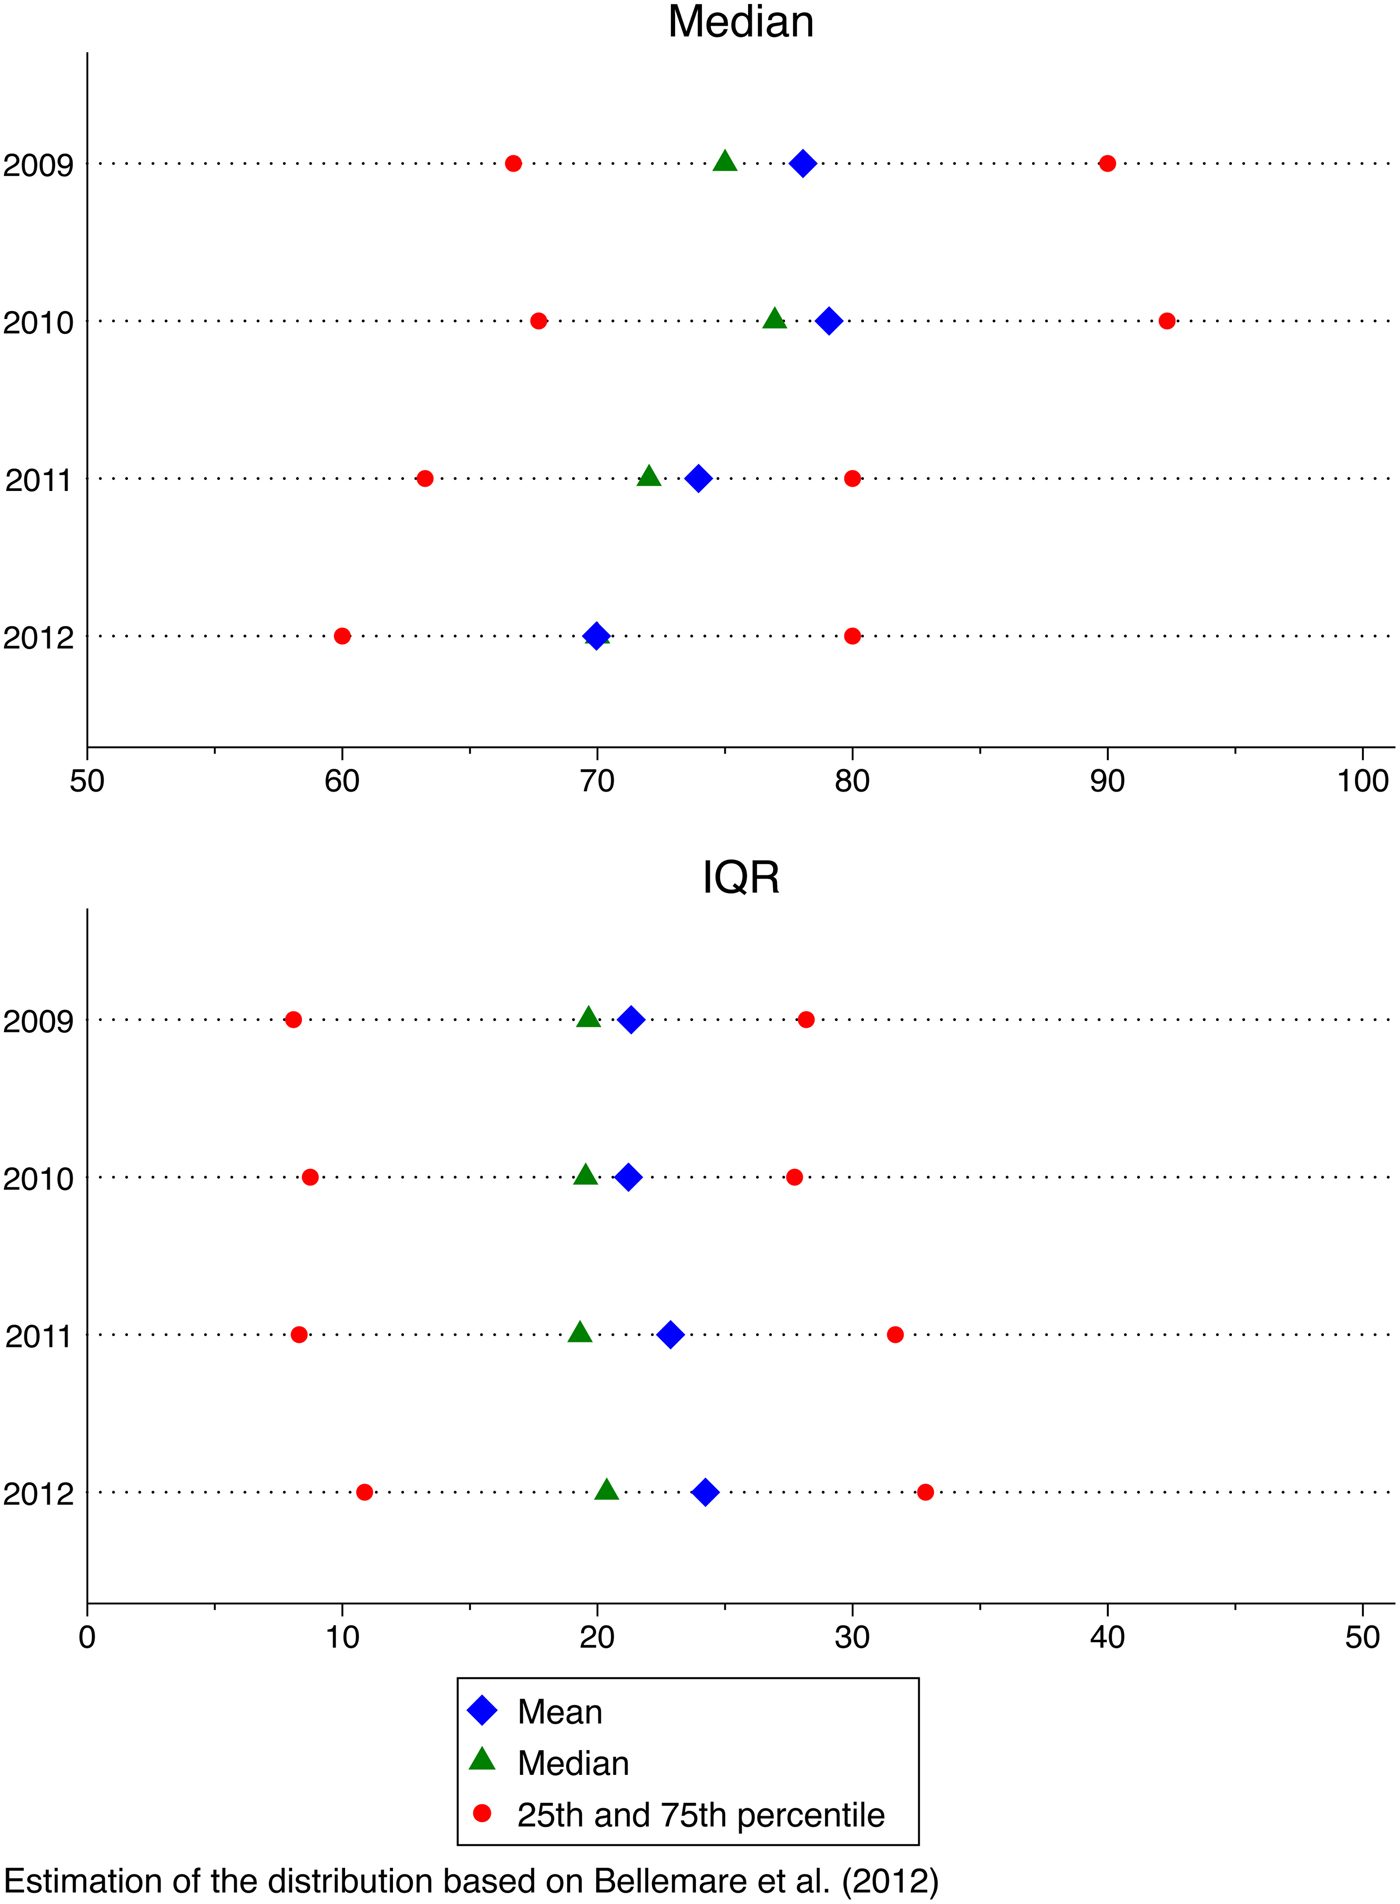
The top panel of this figure shows that over the 4-year time period, the distribution of the median expected replacement rate shifts to the left: the respondents become less optimistic over time, in particular after 2010. The average of the median replacement rate falls from almost 80% in 2009 and 2010 to 70% in 2012. In particular, it seems that the group with a very high median has shrunk substantially, and the distribution of the medians has become much less skewed. The bottom panel shows that at the same time, uncertainty has increased. In particular, the size of the group with very high uncertainty has become larger.
4 Perceptions of the crisis
In this section, we analyze which factors are the best predictors of how respondents perceive the economic crisis and how this affects their pension planning. To do so, we estimate ordered response models explaining the questions presented in Section 3.1. As all other econometric models used in this paper, the basis of the model will be an unobserved linear index of the following form:
 $$y_{it}^{\ast} = {\bi x}^{\bi \prime}_{\bi it} {\bi \beta} + {\alpha _{hh}} + {\alpha _{ind}} + {\varepsilon _{it}}\comma $$
where
x
it
is a set of regressors for individual i in year t, α
hh
and α
ind
are household-specific and individual-specific effects, respectively, and ε
it
is an idiosyncratic error term. We treat the individual and household specific effects as random effects, independent of each other, regressors
x
it
and error terms ε
it
, and following normal distributions with mean zero and variances
 $\sigma _{hh}^2 $
and
 $\sigma _{ind}^2 $
, respectively. The error terms are also assumed to be independent of each other and normally distributed, with mean zero and variance
 $\sigma _\varepsilon ^2 $
.Footnote
6
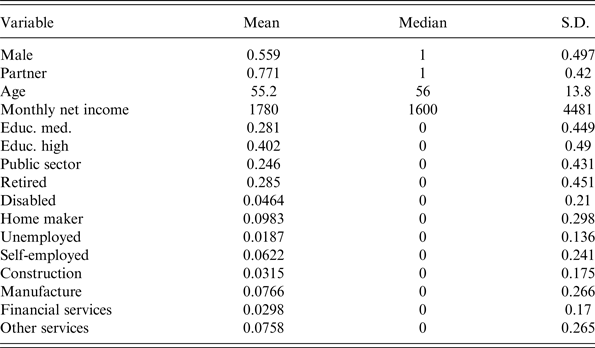
The independent variables in x it are standard socioeconomic and demographic characteristics (gender, living with partner or not, age and age squared, educational dummies), log of net income (set to 0 whenever income was missing or 0), dummies for occupational status (taking paid work as an employee as the reference category, with dummies for being self-employed (or working in a family business), retired, on disability benefits, homemaker, and unemployed), dummies controlling for the sector where someone works or worked (public sector, the construction sector, financial services, other services, ‘other’ sectors being the reference group). Descriptive statistics of these variables are presented in Table A1 in the Appendix. Yearly dummies were also included (using 2009 as the reference year).
Depending on the nature of the dependent variable of interest, we will use standard econometric models based upon this index. For the categorical answers on the 1-to-10 scale concerning perception of the crisis, the ordered probit seems a natural choice, assuming that the observed dependent variable y it is given by
 $${y_{it}} = j\;{\rm if}\;{\gamma _{\,j - 1}} \lt y_{it}^{\ast} \le {\gamma _j}\comma $$
where γ0 = −∞, γ1 = 0, and γ10 = ∞, leaving nine cutoff parameters to be estimated. The location of
 $y_{it}^{\ast} $
is fixed by setting the constant term in the equation for
 $y_{it}^{\ast} $
to zero. Moreover, we fix the scale by normalizing the parameters σ
ε
to 1.
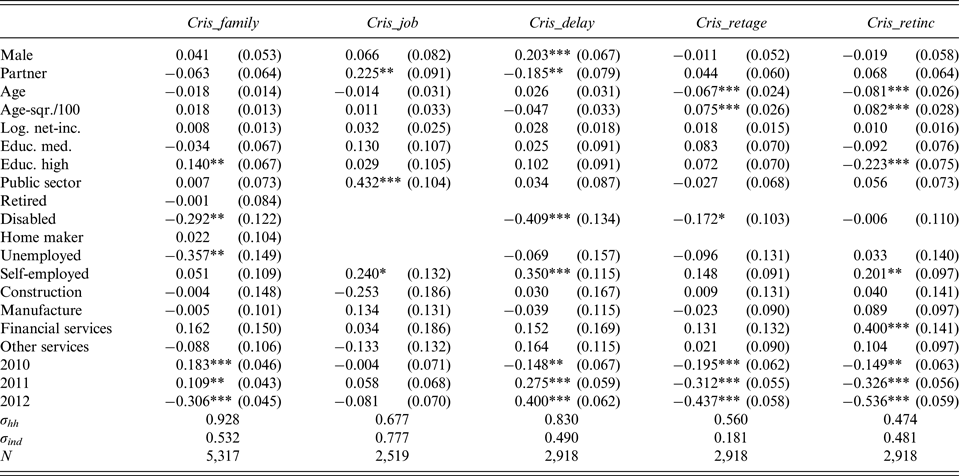
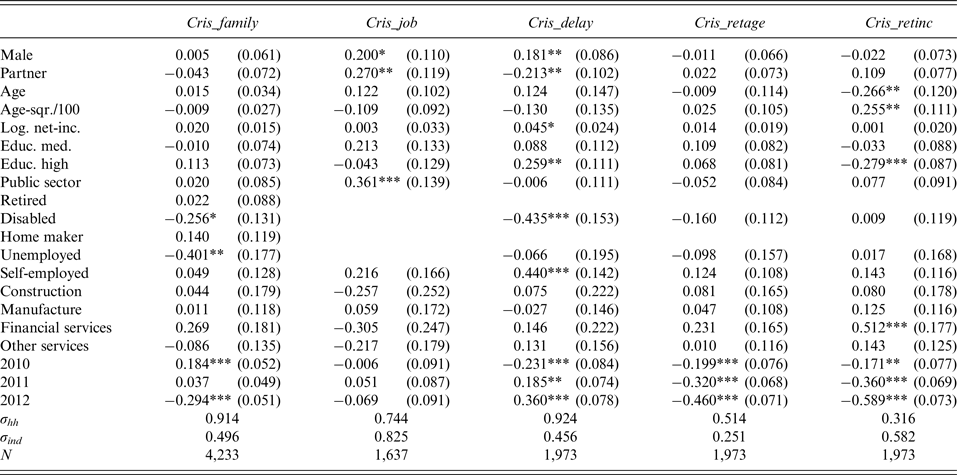
The first column of Table 3 presents the estimation results for the question whether the crisis will affect the family in the next 12 months (Cris_family). To simplify interpretation, we recoded this variable by adding a minus sign so that higher values indicate optimism, as the other variables. This does not change the magnitude of the estimated coefficients.
Estimation results: perception of the crisis and effect of the crisis on retirement planning

Notes: Cris_family recoded by adding minus sign so that higher value always indicates a more positive view. Standard errors in parentheses; *, ** and *** denote significance at the 1, 5 and 10% level, respectively.
Few variables are significant. Keeping other characteristics constant, respondents with high education level are less concerned that the crisis will affect them than those with lower levels of education. This corresponds to the notion that the income of the higher educated is less sensitive to the business cycle than that of the lower educated (Cocco et al., Reference Cocco, Gomes and Maenhout2005). The strongest effects are found for some of the labor force status dummies: respondents on disability or unemployment benefits are particularly concerned that they will be affected. This could be because in the policy debate on required budget cuts, lowering unemployment and disability benefits played an important role. Moreover, these respondents may be most concerned about not being able to find or keep a job due to the crisis. The other significant variables are the year dummies, revealing a pattern that is similar to that in Figure 1. Both household and respondent specific effects are significantly present, but the former are much more sizeable than the latter. The two unobserved heterogeneity terms together capture 52.4% of the total unsystematic variation in the answers, somewhat more than the error terms.
The second column analyzes how confident respondents are about keeping their job in the next 12 months (Cris_job). It shows that respondents with a partner are more confident than singles, perhaps because they have selected into more stable jobs. The most salient finding here is the strong positive coefficient on the dummy for working in the public sector – public sector jobs are considered to be much less at risk than private sector jobs. Even though government budget cuts have led to a large loss of public sector jobs in recent years, most of this was achieved by not filling vacancies when people retired or found another job. Compared to the jobs lost in the private sector due to bankruptcies and reorganizations, only few public sector workers were fired, most of them on temporary contracts. Workers in the construction sector, which suffered most from the crisis, are less optimistic than workers in other sectors, but this difference is not significant. Again, the two heterogeneity terms capture just more than half of the total unsystematic variation. Unlike in the first equation, individual heterogeneity is slightly more important than heterogeneity at the household level. This makes sense because employment is an individual issue.
The third column shows who is willing to delay retirement rather than save more in response to less generous pension benefits (Cris_delay). The self-employed are more often willing to delay retirement than others. This makes sense since they will typically have more flexibility in determining their own retirement age (and more opportunities to work beyond the standard retirement age) than employees, particularly if they want to work beyond the standard retirement age. Respondents on disability benefits are least inclined to delay retirement, probably because they expect that health problems will limit their ability to work at an older age. Males and single respondents are more inclined to adjust the timing of their retirement than females and respondents with a partner. Perhaps this relates to joint retirement planning: married women may adjust their retirement plans to when their partners retire rather than independently adjusting their retirement age if their pension turns out to be lower than expected. The fact that in this equation household specific effects play a much larger role than individual specific effects is also suggestive of joint retirement planning.
Column 4 explains how much respondents agree with the statement that the crisis will not affect when they retire (Cris_retage). Note that the question explicitly refers to the crisis and not to pension reforms, but respondents who think that pension reforms are also shaped by the crisis may well incorporate the effects of pension reforms. This question is the first question where we find a significant age pattern, implying a minimum at about 45 years of age. This suggests that the younger age groups and the age groups approaching retirement age more often tend to think that their retirement age will not be affected than the age group 40–50. Policy reforms are indeed accompanied by transition measures that imply that the standard retirement age does not change as much for those who already approach the retirement age. For the younger age groups, it may be reasonable to argue that the effects of the current crisis will be dominated by new developments after this crisis and before their retirement. Unobserved heterogeneity in Cris_retage is less important than in the other questions, capturing only 35% of the total unsystematic variance. Since the systematic variance is also quite limited, with few significant regressors, this means that much of the variation in the answers is idiosyncratic.
The final column presents the results for the equation explaining whether respondents agree that their pension income will not be affected by the crisis (Cris_retinc). The age pattern is similar as in the previous question, with a minimum at 49.4 years, suggesting that those around age 50 are most concerned about the effect of the crisis on their pension income. Respondents with high education are more concerned than others, even though they are less concerned that the crisis will affect their family (first column). Probably this is because their pension income will largely be determined by an occupational pension, and they realize that occupational pensions will be affected by the crisis, in spite of the current nominal guarantees (see Section 2). On the other hand, the self-employed and respondents working in the financial services sector are more confident than other groups that their pension income is not affected by the crisis. The latter result seems surprising since one would expect that those who work in the financial services sector should be most exposed to the information on the risk induced by incomplete indexation, and nominal pension cuts.
All in all, background characteristics only explain a small part in the variation of these crisis perception variables. In four of the five cases, year dummies are significant and explain more than the respondent characteristics, with patterns in the year dummies similar to the patterns in Figure 1.Footnote 7
Finally, since many of the questions refer to pensions, there is a concern that younger respondents are not involved with the topic and do not answer the questions seriously. We therefore also ran the same regression for the age group 45+ only. The results are presented in Table A2 in the Appendix. They are qualitatively similar to those in Table 3, though the standard errors are somewhat larger, as expected.
5 Income adequacy
In this section, we analyze how crisis perceptions and socioeconomic characteristics relate to the realized and expected changes in income (see Section 3.2). We use similar models as in the previous section – an ordered response model with three outcomes (decreased, remained the same, increased) for the realized income change, and two-limit tobit models for the subjective probabilities of an increase or decrease in the next 12 months, accounting for censoring at the minimum and maximum probabilities of 0 and 100.Footnote 8
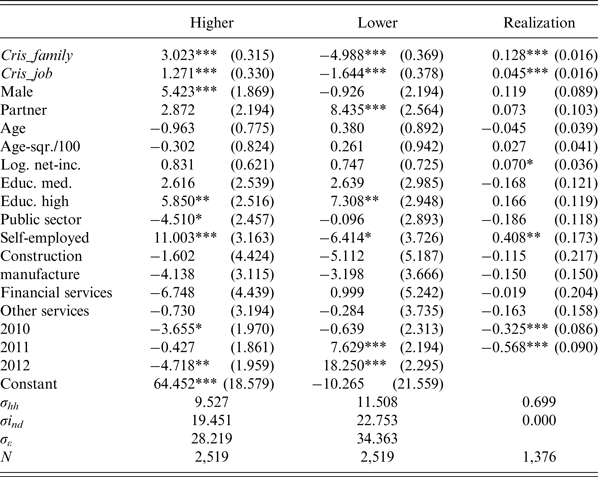
The results are presented in Table 4. As expected, the respondents who think their family will be affected by the crisis are also more likely to expect a fall in household income and less likely to expect an increase. This may seem tautological, but the question on whether the crisis affects the household does not specifically mention income, and there may be many other reasons than the crisis why people expect a rise or fall in real income.
Estimation results: expectations and realizations concerning income adequacy in 12 months time

Notes: Cris_family recoded by adding minus sign so that higher value always indicates a more positive view. Standard errors in parentheses; *, ** and *** denote significance at the 1, 5 and 10% level, respectively.
More interestingly, the respondents who expect the crisis to affect their household are also more likely to actually experience an income fall in the next 12 months. Similarly, the respondents who are confident that they will keep their job in spite of the crisis less often expect and experience an income fall and more often expect and experience an income rise. Whereas the plausible associations with the subjective probabilities of an increase and a decrease could be due to the fact that a common tendency to be optimistic or pessimistic affects crisis perceptions and income expectations in the same way, the associations with realizations make this explanation unlikely; they show that the crisis perceptions are meaningful and have predictive value for what happens to income in the next 12 months.Footnote 9
The effects of socioeconomic variables are often insignificant, and the significant variables show little consistency across the three questions. Keeping other variables (including crisis perceptions) constant, men more often expect an income increase than women, in line with the literature saying that men are more optimistic in general, but there is no significant gender difference in the subjective probability of an income fall, or in the realized income change. Similarly, the difference between partnered and single respondents is significant in only one case: those with a partner report a higher probability of an income reduction.
Respondents with high education give a particularly high probability of an income fall, but also of an income rise, suggesting that their subjective income uncertainty is higher. This could be reconciled with the earlier finding that the incomes of the higher educated are less sensitive to the business cycle (Cocco et al., Reference Cocco, Gomes and Maenhout2005) if the idiosyncratic component of household income is more important for higher than for lower educated people, independent of the state of the business cycle.Footnote 10
A consistent finding across columns is the difference between self-employed and employees (the benchmark): self-employed have more optimistic expectations, and this appears to be justified according to the reported realizations 1 year later.
The time dummies confirm what we already saw in the figures: pessimism increases over time, and the realizations show that this was justified ex post. Unfortunately data collection stopped in 2012 so that we cannot see whether the particularly pessimistic expectations in 2012 were justified. Finally, the estimates of the standard deviations of the unobserved heterogeneity terms suggest that unobserved heterogeneity is more important at the household level than at the individual level, which seems plausible given that the dependent variables refer to household income.
6 Retirement replacement rate expectations
In Section 3 we explained how the survey answers to subjective probability questions on the level of the RIRR were used to derive, for each wage earner or self-employed worker in the sample in each wave, a subjective distribution of the individual's future RIRR. In this section we analyze how the median and the interquartile range of these subjective distributions vary with individual characteristics and with crisis perceptions. We use linear models with household specific and individual specific random effects, assumed to be independent of the explanatory variables. (In other words, the observed outcome y
it
is modelled as
 $y_{it}^{\ast} $
in Section 3.2.) We also estimate a similar linear model for the expected age at which someone can retire.
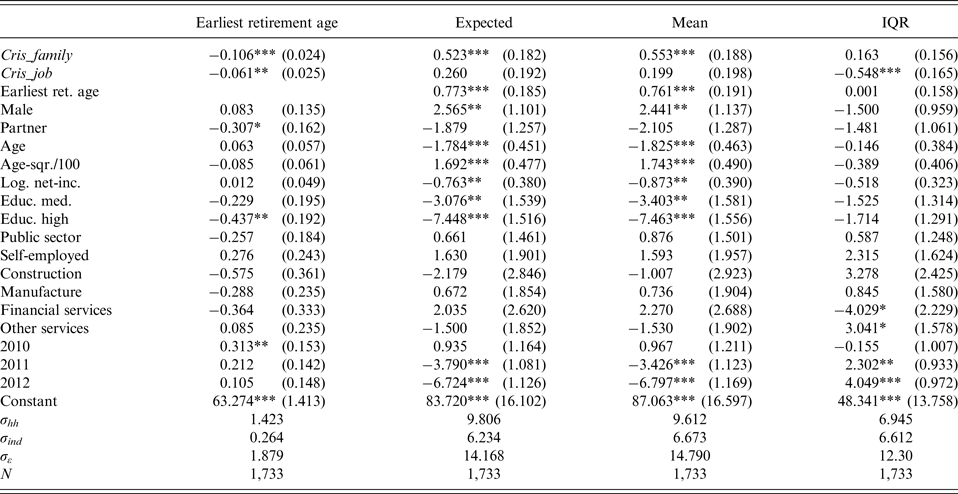
The results are presented in Table 5. The first column refers to the expected retirement age. We find a significant relation with the crisis perceptions: those who think their household will be affected by the crisis expect to be able to retire later, and those who are more confident that they will not lose their job in spite of the crisis expect to retire earlier than others. The largest effect, however, is that of education: Respondents with high education level expect to be able to retire about 5 months earlier than otherwise similar low educated respondents. Other socioeconomic characteristics are not significant at the 5% level.
Estimation results: expected earliest retirement age and mean, median and IQR of the subjective distributions of RIRR

Notes: Cris_family recoded by adding minus sign so that higher value always indicates a more positive view. Standard errors in parentheses; *, ** and *** denote significance at the 1, 5 and 10% level, respectively.
The fact that age hardly plays a role may seem surprising, since the pension reforms imply that on average, younger cohorts will work longer and retire later. On the other hand, however, pension arrangements tend to become more flexible in terms of full (or gradual) retirement with an actuarially fair change in pension level, so that the minimum retirement age may rise much less than the average retirement age.
The only significant time dummy is for 2010 – for the later years, the upward trend in the expected retirement age is apparently explained by the changes over time in the other regression, such as the more pessimistic perception of the crisis.
The second and third columns concern the models explaining the mean and median of the subjective distributions of the RIRR. The main finding is that, keeping everything else constant including the expected retirement age and the time dummies that reflect the actual status of the crisis, there is a negative association between the expected or median RIRR and the perceived effect of the crisis on the respondent's household (Cris_family). Respondents who think the crisis will affect their family are also more pessimistic about their retirement income. This may be a causal effect if respondents think the crisis will affect the accumulation of their second pillar pensions, by reducing earnings or the financial position of their occupational pension fund. On the other hand, we cannot exclude the possibility that it might also simply mean that people who are pessimistic in general are more pessimistic about the crisis as well as about their own future income.Footnote 11
On the other hand, the final column shows that being pessimistic about the effect of the crisis has no effect on the subjective uncertainty (IQR) of the RIRR. Here what matters is confidence in keeping the job, in spite of the crisis (Cris_job): Respondents perceiving a larger risk that they will lose their job due to the crisis are significantly more uncertain about their retirement income. To interpret the magnitude of the estimate, note that a change in (Cris_job): from 6 to 10 (the 25th and 75th percentiles of the distribution on the 10 point scale) increases the IQR by about 2.2% points, which is about 10% of the average IQR (22.6, see Figure 4). So the effect is substantial but not huge.
The effects of the other variables are largely in line with the results of Van Santen et al. (Reference Van Santen, Alessie and Kalwij2012) and De Bresser and van Soest (Reference De Bresser and van Soest2013) who estimated similar models using the earlier waves of the same data. The earlier respondents expect to be able to retire, the lower the mean or median RIRR, but the expected retirement age is not related to RIRR uncertainty. As always, males are more optimistic than females. They are also less uncertain, but this difference is not significant.
The higher income groups and those with higher education level are substantially more pessimistic concerning their RIRR level than lower income and lower education groups. As discussed in Section 4, a possible explanation is that respondents with low earnings rely to a larger extent on the flat rate state pension, which is expected to be more stable than the supplementary occupational pension (because the state pension is aimed at providing a subsistence income and this is not expected to change). The final column shows that the higher socioeconomic status groups are also less uncertain about their RIRR, possibly because they are more knowledgeable about financial matters in general and pensions in particular (see, e.g., Lusardi and Mitchell, Reference Lusardi and Mitchell2014).
There is surprisingly little variation across sectors, particularly concerning the level of RIRR (mean and median). There are more differences in the IQR, significant at the 10% level, suggesting that self-employed workers and workers in the sector other (than financial) services are more uncertain than employees in the manufacturing sector, while employees in the financial services sector are less uncertain about their retirement income than those in manufacturing. The latter may well be due to the fact that employees in the financial services sector are more knowledgeable about their pensions than others. In spite of adding all these controls, the time dummies are all very significant, and in line with the time patterns that we discussed in Section 3: the retirement income expectations become more pessimistic and more uncertain over the 4 years period.
Most of the variation in median replacement rates or in the interquartile ranges is not explained by the regressors. The unsystematic variance is captured by individual effects, household specific effects, and idiosyncratic errors. Household specific effects are slightly more important than individual effects, and together these two unobserved heterogeneity terms capture more than half of the total unsystematic variance. The importance of the household specific effects may seem surprising, since the replacement rates concern personal pension income. One explanation is that optimistic people typically find an optimistic spouse; another would be that common omitted variables affect both partners in the same way. (e.g., both partners may work in the same industry or firm and therefore have similar supplementary pensions, often organized at the industry level).
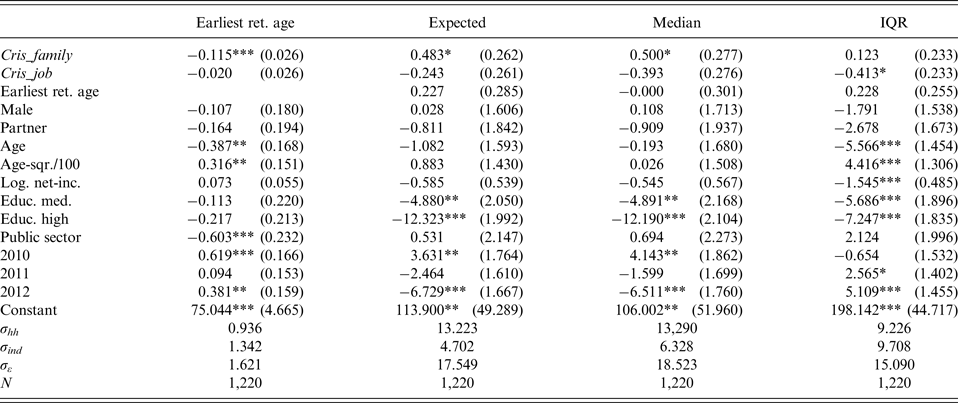
The same regressions were also run for the age group 45+ only, because of the concern that younger respondents may not be interested in their pension replacement rates so that their answers are very noisy. The results in Table A3 do not support this concern: the estimates remain very similar, although their precision is somewhat reduced because fewer observations are used.
7 Conclusion
We have analyzed longitudinal data on crisis perceptions, income expectations and realizations, retirement planning, and expected income during retirement for a representative sample of the Dutch population, interviewed in the summers of 2009–12. Our first main finding is that the perceptions of the crisis become more pessimistic over the years, in line with subjective indexes of the state of the Dutch economy such as the consumer confidence index. We also find substantial heterogeneity in crisis perceptions at a given point of time, with, for example, more pessimism among the high educated and fewer concerns about losing their job among public sector employees than in the private sector.
In line with the perceptions of the crisis as well as the ongoing debate about pension reforms, the number of people expecting an increase in the retirement age or a fall in the value of their pensions also increases over time. We cannot disentangle the extent to which this is due to the crisis and to which it is due to the pension reforms, since both are generic and took place during the same time period.
The higher educated are particularly concerned about a fall of their pension income, which is plausible since their income will largely depend on second pillar occupational pensions whose purchasing power is more under pressure than the purchasing power of the basic first pillar pension. The self-employed, who do not participate in the occupational pension system, are less concerned than employees about a possible reduction in their pension income and more willing to work longer.
Crisis perceptions are associated with expected income changes for the next 12 months in a plausible way. They also help to predict actual changes in income reported 12 months later. The latter strongly suggests that the relation between crisis perceptions and income expectations is not merely due to the fact that general optimism or pessimism affects crisis perceptions and income expectations in a similar way – crisis perceptions contain private information that reflects genuine heterogeneity in how the crisis affects different families in different ways.
RIRR expectations have dropped substantially from 2010 to 2012, from an average median of almost 80% in 2010 to 70% in 2012. In particular, the group with very optimistic replacement rate expectations has shrunk substantially. Respondents who are convinced that the crisis will affect their family report later expected retirement ages as well as lower expected replacement rates. Respondents who are more concerned about losing their job are also more uncertain about their retirement income. Higher income and higher education groups have lower expected replacement rates than the lower socioeconomic groups. This may be realistic since the low income groups depend on a larger extent on the state pension, which can be expected to be more stable (at the minimum subsistence level) than supplementary pensions. On the other hand, Bissonnette and van Soest (Reference Bissonnette and van Soest2012) found that the higher socioeconomic status groups are also more pessimistic concerning the Dutch pension system in general rather than their own provisions, which suggests that their larger pessimism may also reflect a more realistic view on the future development of pensions, due to better financial literacy and pension knowledge (Lusardi and Mitchell, Reference Lusardi and Mitchell2014).
A series of pension reforms is reducing the income replacement that most employees will get if their pension savings are limited to the pay as you go state pensions and the mandatory supplementary occupational pensions. Voluntary additional pension savings will play a larger role, implying an increasing responsibility for the employees themselves. A necessary condition for optimal pension planning and decision making is that consumers have unbiased expectations of the pensions what pension they are accumulating. The results in this paper suggest that these expectations have become more pessimistic over the years of the crisis and associate in plausible ways with individual perceptions of the expected crisis impact. At least on average, consumers’ expectations adjust to the new reality.
Overall, much of the heterogeneity that we find in expectations of future income, pension levels, and the retirement age across the Dutch population that we find is plausible, given that different workers face different circumstances. Most relationships between individual characteristics and expectations are consistent with financial theory. Our results on expectations are therefore in line with recent studies showing that investors follow the precepts of financial theory. For example, Calvet et al. (Reference Calvet, Campbell and Sodini2007) find that only few (Swedish) households are very poorly diversified, whereas a majority of Swedish households participating in stocks are sufficiently diversified to outperform the Sharpe ratio of their domestic stock market. Betermier et al. (Reference Betermier, Calvet and Sodini2014) find that the trading behavior of the majority of investors (particularly those with high financial wealth) corrects for passive shocks and is in line with financial theory.
On the other hand, the expectations of some groups of people may be unrealistically positive. Particularly for the lower income groups, this may be a source of concern for policy makers. These groups not only are more optimistic on their pension income replacement rate, but are also likely to have fewer possibilities to adjust their life style or rely on other resources when their pension appears to be less.
Appendix A: Descriptive statistics for background variables
Table A1 presents descriptive statistics of the background characteristics. The sample selected consists of those included in the regression for the variable Cris_family, the largest among our estimation samples. The statistics are based on the first occurrence of the respondent in the panel.
Descriptive statistics (N = 5,317)

Appendix B: Results for respondents aged 45 and older
Tables A2 and A3 present the results for the same models as Tables 3 and 5, but keeping only respondents aged 45 and over.
Estimation results: perception of the crisis and effect of the crisis on retirement planning

Estimation results: expected earliest retirement age and mean, median and IQR of the subjective distributions of RIRR