INTRODUCTION
It has been clearly established that oil spills represent a major threat to the marine environment, and may result in severe impacts on both nearshore biota and benthic subtidal habitats (Dauvin, Reference Dauvin1982; Danovaro et al., Reference Danovaro, Fabiano and Vincx1995; Jewett et al., Reference Jewett, Dean, Smith and Blanchard1999). In marine systems, the major sources of hydrocarbon contamination are crude oil spills, refined fuel discharge and offshore production activities (Kennish, Reference Kennish1992). Accidental oil spills are disasters that tend to have a major impact on marine ecosystems.
Intertidal and shallow water communities inhabiting soft sediments tend to be the most seriously affected part of the ecosystem following an oil spill (Christie & Berge, Reference Christie and Berge1995). Oil causes environmental damage through several mechanisms, including: (1) toxicity associated with ingestion or absorption through the respiratory structures or skin of biota; (2) coating or smothering biota, which affects gas exchange, temperature regulation and other life-supporting processes; and (3) oxygen depletion by microbial processes associated with oil degradation (Mendelssohn et al., Reference Mendelssohn, Andersen, Baltz, Caffey, Carman, Fleeger, Joye, Lin, Maltby, Overton and Rozas2012). Yet, most research concerning the effects of oil spill pollution on marine benthos focuses on benthic macrofauna. However, in recent years, a greater research emphasis has been placed on assessing the impact of oil spills on meiofaunal communities.
Existing studies have produced varying results about the impact of oil spills on marine meiofaunal communities. In general, reports indicate that marine benthic animals are severely affected by oil spills; however, some opportunistic species recover rapidly, such as nematodes (Danovaro et al., Reference Danovaro, Fabiano and Vincx1995). Studies on the effect of the M/V ‘Sea Transporter’ oil spill on 5 June 1994 recorded a notable decline in the abundance of dominant taxa (such as nematodes and harpacticoid copepods) in the intertidal zone (Ansari & Ingole, Reference Ansari and Ingole2002). In another study, Danovaro et al. (Reference Danovaro, Fabiano and Vincx1995) recorded a decline in meiofaunal density following the release of crude oil from the ‘Agip Abruzzo’ oil tanker, compared to the pre-pollution conditions. Copepods have been reported to be severely impacted by some spills (Boucher, Reference Boucher1980; Bonsdorf, Reference Bonsdorf1981) and to recover more slowly than nematodes (Wormald, Reference Wormald1976). However, Naidu et al. (Reference Naidu, Feder and Norrell1978) reported an increase in copepod density at experimentally oiled sites of an Alaskan mudflat. In fact, the types and amount of oil released, local environmental conditions, the weathering of oil, the specific dynamics of each accident and the type of clean-up techniques employed, may generate a variety of different ecological effects and toxicological impacts (Jewett et al., Reference Jewett, Dean, Smith and Blanchard1999; Edgar & Barrett, Reference Edgar and Barrett2000).
Research about the effects of environmental pollution on marine benthos is frequently viewed as time consuming and expensive (Hargrave & Thiel, Reference Hargrave and Thiel1983). However, to elucidate the biological effects of pollution at the community level, it is important to assimilate information about important community responses to environmental disturbances (Schwinghamer, Reference Schwinghamer1988). Therefore, it is necessary to investigate community level phenomena, which are both sensitive to the effects of pollution and easily studied under normal circumstances. Meiofauna have been frequently suggested as being useful pollution indicators for environmental biological monitoring because of their high abundance, short generation time and entire life-cycle being spent within the sediment. Moreover, meiofauna are more rapidly affected by changes in abiotic and biotic environmental parameters compared to macrofauna, because of their small size and close association with the sediments (Higgins & Thiel, Reference Higgins and Thiel1988).
This study aimed to determine the potential impact of an oil spill on intertidal meiofauna at a clean, sandy beach in Korea. This objective was accomplished by examining changes in the structure of meiofaunal assemblages after a controlled oil spill (i.e. by experimentally oiling sediment blocks) of different concentrations at different locations on the beach.
MATERIALS AND METHODS
Experimental site
The study site was an intertidal sandy beach located on the Taean coast (36°50′40″N 126°09′34″E) of the Yellow Sea in Korea (Figure 1). Historical records indicated that this site had not been previously disturbed by petroleum-related activity. The sediments had a mean grain size of 0.99–1.09 φ, organic carbon content of 0.064%, and were primarily composed of sands (98.5–99.1%), silts (0.26–0.46%) and clays (0.19–0.35%). The sediment temperature in the experimental site ranged from 13 to 19°C.
Study area location on the intertidal sediment (enlarged image on the left; general location in the Yellow Sea on the right).

Experimental design
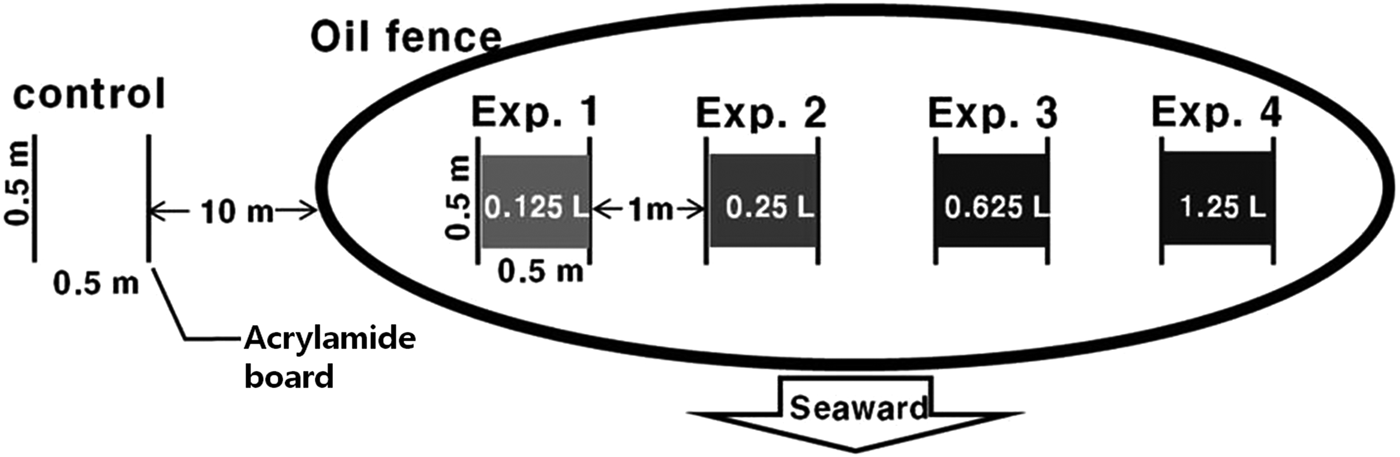
One control plot and four experiment plots surrounded by an oil fence for the release of an experimental oil spill were established. The experiment plots were about 1 m apart. The control plots were designated as ‘unoiled control’ plots, and were separated by about 10 m from the experimental plots. Five plots (0.5 m × 0.5 m) were located in the intertidal zone, and were blocked on two sides (leaving the landward and seaward sides open; Figure 2) with acrylamide boards measuring 0.5 m × 0.5 m. During low tide, four different volumes of crude oil were sprayed onto the surface of the experimental plots with a garden sprayer; specifically: Exp. 1, 0.125 l; Exp. 2, 0.25 l; Exp. 3, 0.625 l; Exp. 4, 1.25 l. The crude oil was Iranian Heavy, and the specific gravity was 0.87. The oil mostly contained hydrocarbons and some trace metals. Between 30 and 50% of total crude oil mass, mostly volatile organic carbon, was estimated to evaporate at the initial stage of spill. The oil was not mixed with the sediment. The two acrylamide boards were removed 1 d after oil application, to allow free tidal flow through the plots.
Experiment design diagram for this study.
Sampling in this short-term study was undertaken from 28 September to 28 October 2010. Meiofaunal samples were collected from all plots at 0 h prior to oil addition, and then at six different time points following oil application; specifically: 12 h, 1 d, 2 d, 4 d, 8 d and 1 month. To study the meiofaunal community, four samples were collected from each of the five plots using an acrylamide corer (3.4 cm internal diameter) to a sediment depth of 5 cm. Sampling was performed randomly within the limit of the experimental and control zones. To analyse the meiofaunal community, the three 5 cm deep cores were divided into 1 cm samples (i.e. 0–1 cm, 1–2 cm, 2–3 cm, 3–4 cm, 4–5 cm) and preserved in 5% formalin solution in the field. The sediment of one additional core was frozen to determine the level of total petroleum hydrocarbon (TPH) through the use of a fluorometer (Turner Model 10AU). All samples were collected during the ebb tide stage, and sampling was only initiated after the plots were drained of tidal water. Each plot was sampled at the same relative tidal stage, in an attempt to control for the effects of this variable.
Sample processing
For meiofaunal analysis, samples that passed through sieves with a 1 mm mesh but were retained on a 38 μm mesh were washed with tap water in the laboratory. Organisms were extracted by flotation using a colloidal silica Ludox HS40 (du Pont), with a specific gravity of 1.18. After the sand particles had settled, the floating material was decanted and rinsed with tap water (Burgess, Reference Burgess2001). The extraction process was repeated twice. The meiofaunal organisms remaining in the supernatant were manually sorted using a dissecting microscope (Leica MZ16). The number of individual organisms was counted, with all nematodes being transferred to 3% glycerin, and stored. All nematodes were mounted on microscope slides for identification, and were classified to the genus level (Platt & Warwick, Reference Platt and Warwick1983) using an Olympus BX51 microscope. Nematodes were classified according to trophic group based on Wieser's original groupings (Wieser, Reference Wieser1953); specifically: 1A—selective deposit feeders; 1B—non-selective deposit feeders; 2A—epistrate feeders; and 2B—predators/omnivores.
Data processing
One-way ANOVA was used to test for differences in TPH between the control plot and the experimental plots using SPSS v.19. Statistical significance testing a significant difference was assumed when P < 0.05.
The program CLUSTER and non-metric multi-dimensional scaling (MDS) analysis were carried out using the Bray–Curtis similarity measure. The average abundance data of all taxa and nematode species found in each plot and at each period was fourth root transformed and used in this analysis. CLUSTER and MDS were applied to determine whether the meiofauna and nematode assemblages responded to different levels of oil contamination with respect to time elapsed after oil application. Tests for community differences were conducted both spatially (control plot and experimental plots) and temporally (sampling intervals) using the ANOSIM test. The similarity percentage (SIMPER) was used to determine the contribution of nematode species grouped in the SIMPROF test to the average dissimilarity between groups.
Non-metric multi dimensional scaling, ANOSIM and SIMPER analyses were performed on fourth root transformed data using the software package PRIMER version 6.1.12 (Clarke & Gorley, Reference Clarke and Gorley2001).
The Spearman correlation coefficient was carried out using SPSS v.19 to test whether the oil concentration of sediments was correlated with meiofaunal community parameters and dominant nematode species. Statistical significance testing a significant difference was assumed when P < 0.05.
RESULTS
Change in oil concentration with sediment
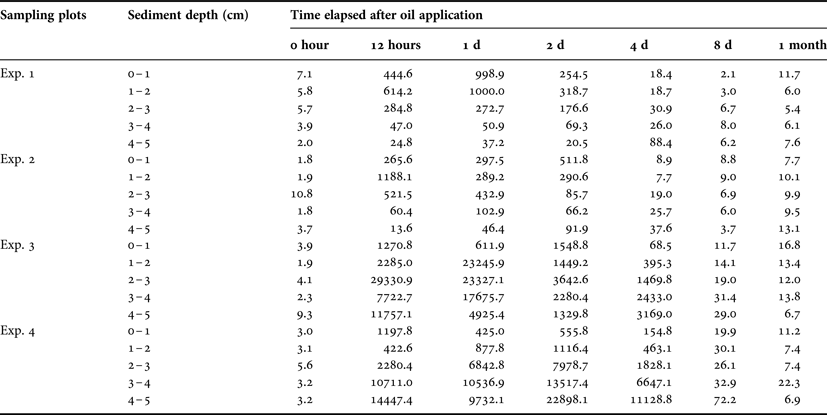
Significance testing using the 1-way ANOVA for differences in TPH between the control plot and the experimental plots indicated that the control and plots with small amounts of oil (Exp. 1 and Exp. 2 plots, with 0.125 and 0.25 l, respectively) were significantly different to the plots that contained larger quantities of oil (Exp. 3 and Exp. 4 plots, with 0.625 and 1.25 l, respectively) (P < 0.05).
After oil application, a high concentration of TPH was observed in all experimental plots from 12 h to 8 d, which significantly decreased after 8 d. The concentration of TPH at 0 h ranged from 1.8 to 26.6 ppm, with a mean 5.1 ppm in the control and experimental plots. The TPH in the sediment of the control plot ranged from 3.0 to 8.8 ppm, with a mean 5.4 ppm, during the study period. The TPH in Exp. 1 and Exp. 2 plots had high oil concentrations for the first 2 d, which then began to decline after 4 d. In contrast, Exp. 3 and Exp. 4 plots continued to contain high levels of TPH after 4 d, and only started to decline after 8 d. The total mean TPH of the experimental plots was 4.2 ppm before oil application and 10.3 ppm at 1 month after oil application (Table 1).
Total petroleum hydrocarbon concentration (μg/g, ppm) according to the sediment depth at each plot and for each time period in the study area.
Effect of oil on the meiofaunal community
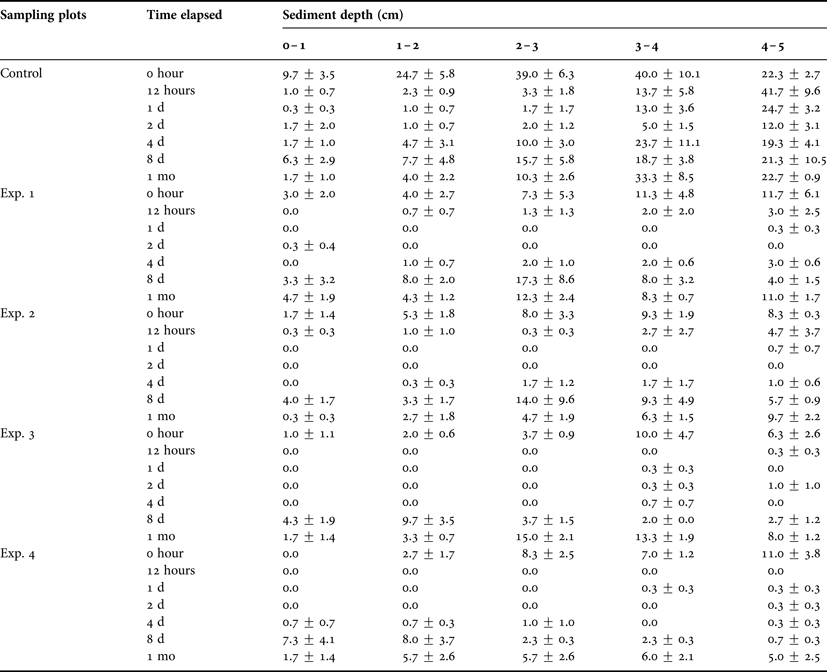
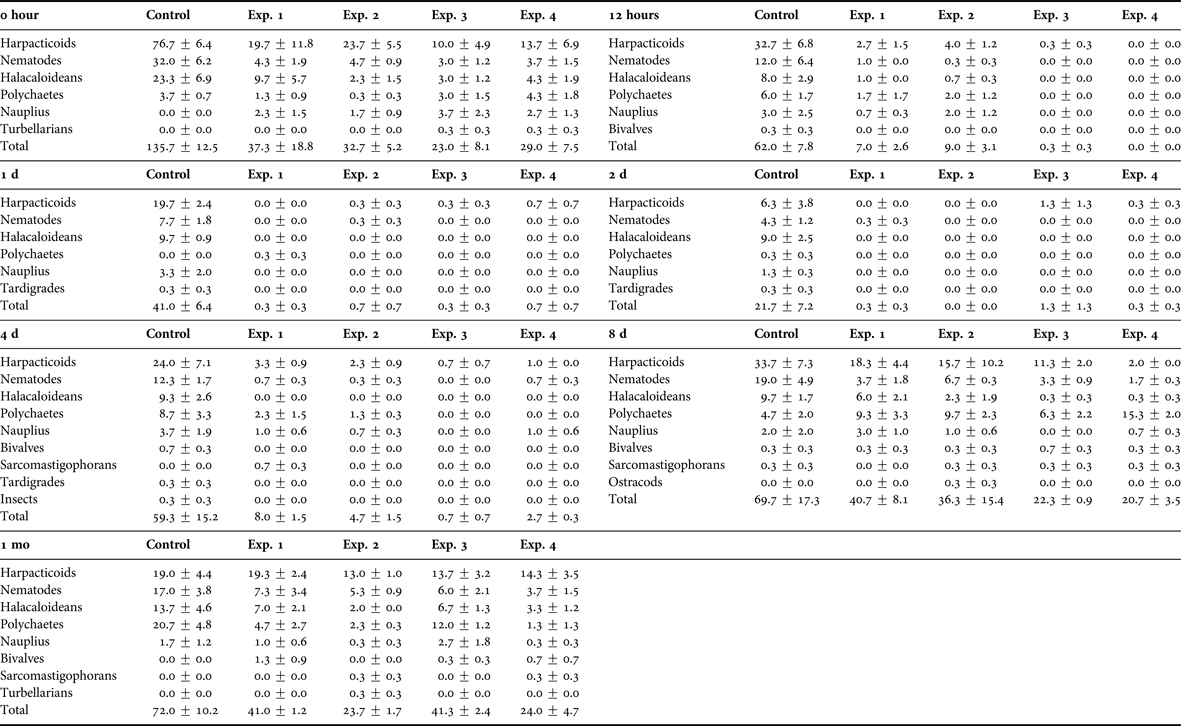
The average meiofaunal density during the experimental period is presented in Table 2. The mean density of meiofauna was lower in the experimental plots than in the control plot. The meiofaunal composition at the study site was dominated by harpacticoids, which represented 46.5% of all fauna. Following harpacticoids, nematodes were the second-most dominant taxon, representing 18.6% of all fauna. Other observed groups appeared in small numbers, and included halacaloideans, polychaetes, nauplius, bivalves, sarcomastigophorans, tardigrades, turbellarians, ostracods and insects (Table 3).
Mean meiofaunal density (inds./10 cm2) according to the sediment depth at each plot and for each time period in the study area.
Mean meiofaunal density (inds./10 cm2) according to the taxonomic group at each plot and for each time period in the study area.
The density of meiofauna in all of the experimental plots significantly decreased after oil application. After 12 h, the density of meiofauna in all experimental plots declined by 88%, whereas the density of meiofauna in the control plot declined by 54%. The density of meiofauna in Exp.1 and Exp. 2 began to increase after 4 d. After 8 d, the density of meiofauna in Exp. 1 and Exp. 2 was similar to that before oil application. The density of meiofauna was lower in Exp. 3 and 4 compared to Exp. 1 and Exp. 2 during the first 8 d after oil application. After 1 month the density of meiofauna in all experimental plots was similar to that before oil application (Figure 3).
Mean meiofaunal density (:nds./10 cm2) according to the sediment depth at each plot and for each time period in the study area.
The density of harpacticoids and nematodes showed a similar decline to that of the total meiofauna. After 12 h, there was a major decline in harpacticoid and nematode total density in all experimental plots compared to the control plot. Only small numbers of these animals, if any, were observed in several plots at 12 h, 1 d, 2 d and 4 d after the experiment was initiated. In Exp. 1 and Exp. 2 plots, the density of harpacticoids slowly increased after 4 d, with a mean of 15 inds/10 cm2 after 8 d. After 8 d, harpacticoid density was similar to that before oil application in all plots, except Exp. 4. In Exp. 4, harpacticoid density was similar to that before oil application at 1 month after oil application. Nematode density slowly increased after 8 d, at which point the density was similar to that recorded before oil application in all experimental plots (Table 3).
Four groups were delineated by a CLUSTER analysis of the Bray–Curtis similarity matrix based on the density of the meiofauna in this experiment (SIMPROF test, P < 0.05; Figure 4). Group 1 included samples collected from the control and from the experimental plots during the period before oil application or from plots with low TPH levels (at 0 h, 8 d and 1 month). Group 2 included samples with low TPH levels (Exp. 1, 2 and 4 after 4 d and Exp. 1 and 2 after 12 h). Group 3 included samples collected during the initial experimental periods from plots with high oil application (12 h, 1 d, 2 d and 4 d in Exp. 3 and 1 d and 2 d in Exp. 4). Group 4 included samples collected during the initial experimental periods from plots with low oil application (Exp. 1 after 2 d and Exp. 2 after 1 d).
CLUSTER analysis in Bray–Curtis similarities among the meiofaunal assemblages. Broken lines indicate the same group by SIMPROF analysis.
The ANOSIM results showed that TPH contamination had a significant effect on the meiofauna community. The control plot was significantly different to experimental plots (R = 0.395, P < 0.001). Furthermore, sampling period had a significant effect on the meiofaunal community(R = 0.422, P < 0.001). A significant difference between samples collected at 0 h and 1 month vs samples collected at 1 d, 2 d, 4 d and 8 d with high TPH concentrations was also detected. However, there was no significant difference in the meiofaunal communities when samples collected before oil application (0 h) and 1 month after oil application were compared.
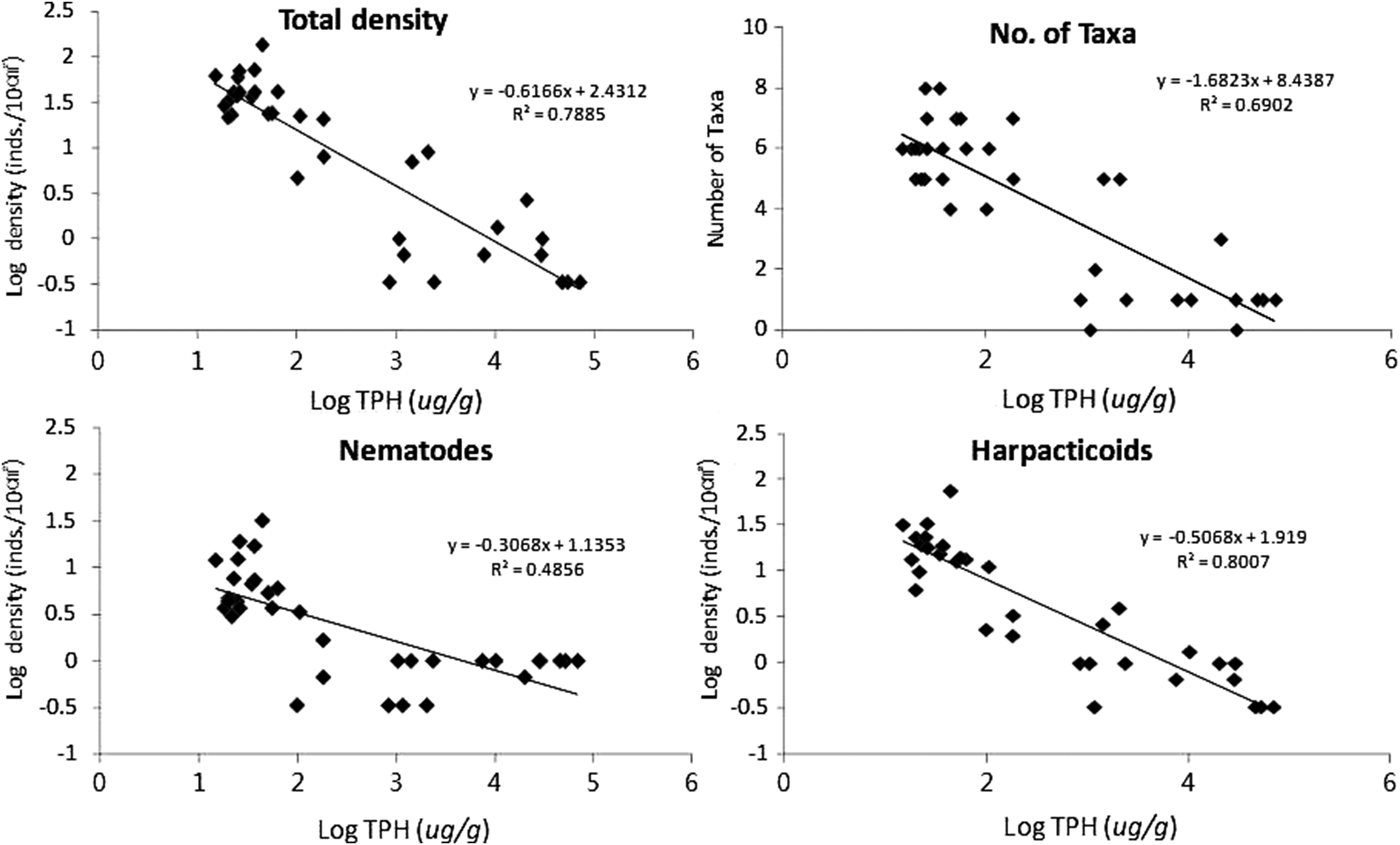
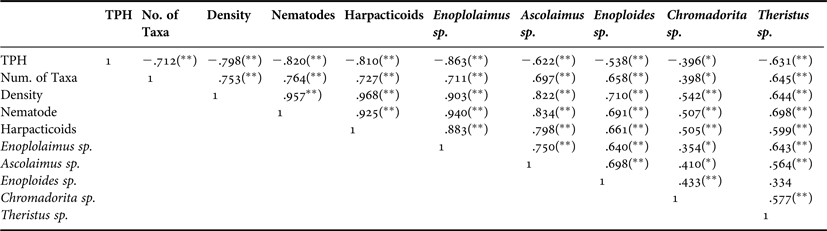
The Spearman correlation coefficient for the different TPH and meiofaunal data is presented in Table 4. The number of taxa, total meiofaunal density, nematode density, harpacticoid density and the five dominant nematode species in the sediment had statistically negative significant relationships with TPH concentration in the sediment (P < 0.001). In particular, the regression analysis between TPH and major meiofaunal parameter (total meiofaunal density, number of taxa, nematodes and harpacticoids) showed a high negative factorial relationship (Figure 5).
Regression analysis between total petroleum hydrocorbon (TPH) and major meiofaunal data (total density, number of taxa, nematodes and harpacticoids).
Spearman correlation coefficient among the total petroleum hydrocarbon (TPH) of the sediment and major meiobenthic data in the experimental plots.
**, significant relationships (P < 0.001); *, significant relationships (P < 0.05).
Nematode community structure
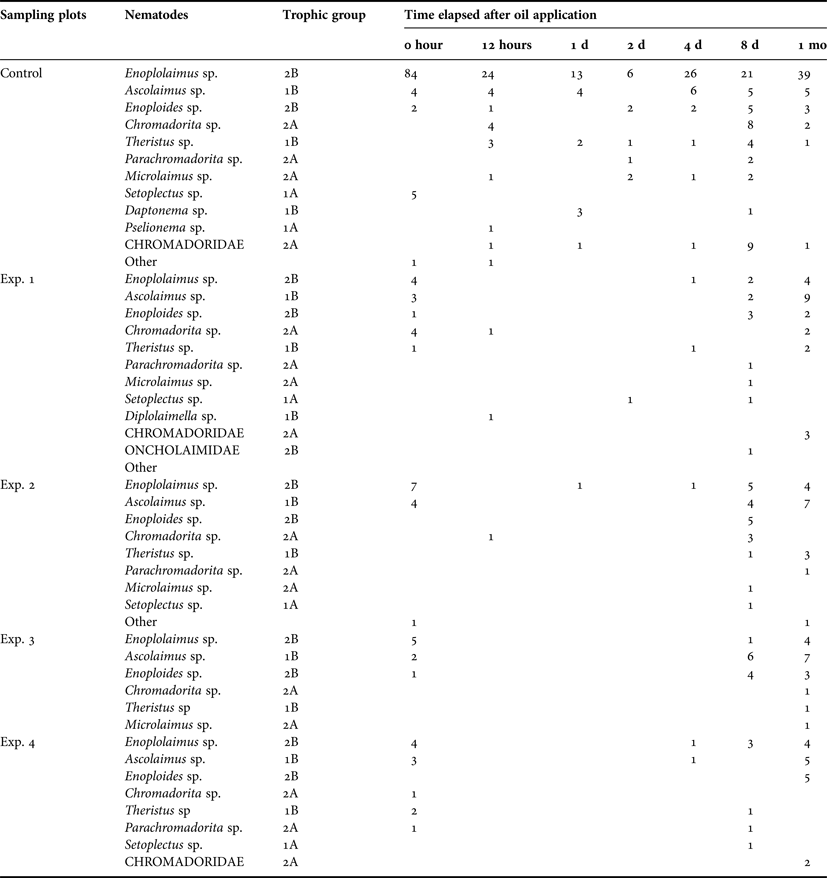
A total of 489 nematodes individuals were recorded over the study period. The dominant nematode species was Enoplolaimus spp., which accounted for 54% of all nematodes. The second dominant nematode species was Ascolaimus spp., which accounted for 16.6% of all total nematodes, followed by Enoploides spp., Chromadorita spp., Theristus spp., Parachromadorita spp., Microlaimus spp. and Setoplectus spp. Low numbers of a few other nematode species were also recorded. All feeding types of nematodes were recorded before oil application (i.e. types 1A, 1B, 2A and 2B). After oil application to the experimental plots, few nematodes were documented until 4 d after oil application, with all feeding types appearing from 8 d after oil application (Table 5).
Total density (inds./30 cm2) and trophic group of nematode species in the total samples for the study periods (1A, selective deposit feeders; 1B, non-selective deposit feeders; 2A, epistrate feeders; 2B, predators/omnivores).
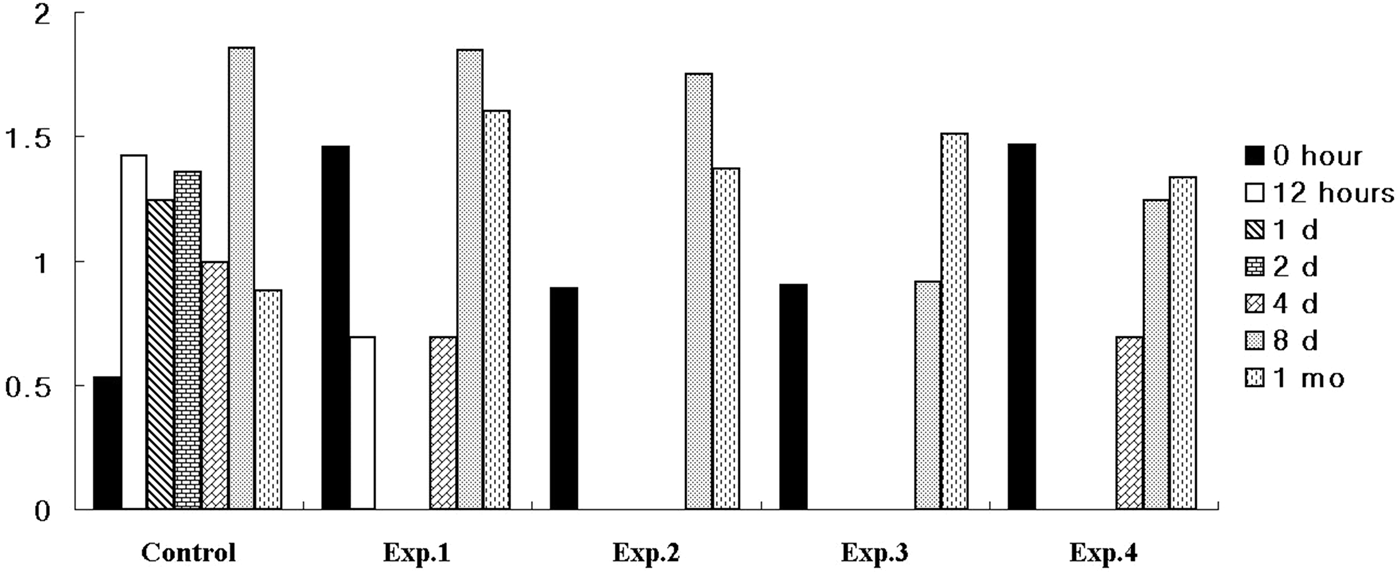
The Shannon's diversity index for nematode assemblages from each sample illustrates the change in nematode species diversity according to sediment TPH concentrations (Figure 6). The indices of nematode species diversity in the experimental plots, except Exp. 4 plot, increased after 8 d more than that of samples before oil application.
Nematode species diversity based on Shannon's diversity index at each plot and for each time period.
Non-metric multi dimensional scaling and CLUSTER analysis results indicate a clear effect of oil contamination on nematode assemblages between samples with high oil concentration and low oil concentration. The samples were grouped according to TPH sediment concentrations. The samples collected from the control plot were clustered together with the samples collected from the experimental plots at 0 h, 8 d, and 1 month after oil application. The samples with high TPH concentration (12 h, 1 d, 2 d and 4 d in the experimental plots, zero abundance) were separated from samples with low TPH concentration (Figure 7). The SIMPROF test divided all of the collected samples into four major groups (SIMPROF test, P < 0.05; Figure 6). Group 1 included samples from the control plot and from the experimental plots during period before oil application or with low TPH levels (8 d and 1 month in the experiment plots). Group 2 included samples from experimental plots with low oil application (Exp. 1 and 2 after 4 d and Exp. 2 after 1 d). Group 3 included samples from plots with low oil application during the initial experimental periods (12 h in Exp. 1 and 2). Group 4 included samples with no abundance or that were not grouped (Exp. 1 after 2 d).
Multidimensional scaling and CLUSTER analysis based in Bray–Curtis similarities among the nematode species assemblages. Broken lines indicate the same group by SIMPROF analysis.
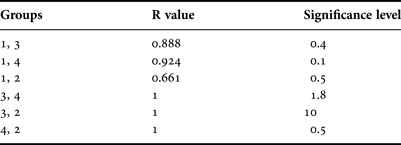
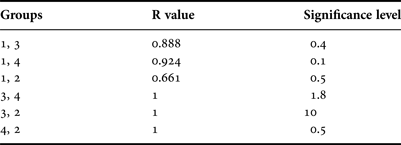
The ANOSIM results showed that TPH contamination had a significant effect on nematode assemblages (R = 0.873, P < 0.001). Group 1 was significantly different to groups 2, 3 and 4 (Table 6).
ANOSIM results (R statistic and significance level) of pairwise tests for pairwise differences between groups using fourth root transformed nematode abundance data.
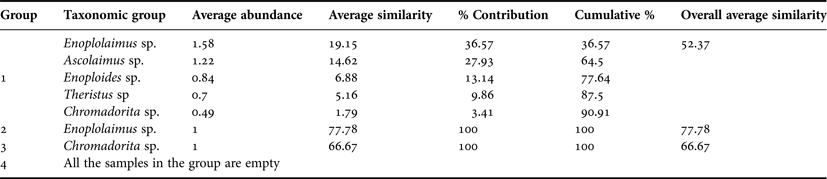
The SIMPER results showed that the group 1 was mainly dominated by Enoplolaimus spp. (36.57%), Ascolaimus spp. (27.93%), Enoploides spp. (13.14%), Theristus spp. (9.86%) and Chromadorita spp. (3.41%). Group 2 was only dominated by Enoplolaimus spp. Group 3 was only dominated by Chromadorita spp. There were no organisms in group 4 (Table 7). Average dissimilarity (69.20%) between groups 1 and 2 was mainly caused by Ascolaimus spp. (23.38%), Enoploides spp. (14.64%), Enoplolaimus spp. (13.57%), Theristus spp. (11.65%) and Chromadorita spp. (7.22%). Average dissimilarity (92.11%) between groups 1 and 3 was mainly due to Enoplolaimus spp. (21.69%), Ascolaimus spp. (17.16%), Chromadorita spp. (12.87%), Enoploides spp. (10.77%) and Theristus spp. (8.54%). Average dissimilarity (100%) between groups 2 and 3 was mainly due to Enoplolaimus spp. (37.50%), Chromadorita spp. (37.50%) and Diplolaimella spp. (15.28%).
SIMPER analysis of nematode species, listing the main characterizing species at each group. Average abundance, and the % contribution to the similarity made by each characterizing species are shown. Also listed is the cumulative percentage and the overall average similarity.
DISCUSSION
When designing experiments on sandy beaches, there is the complication of sand transport due to tidal action, wind action, bioturbation and storms. Any movement of sand might result in oiled sediment leaving plots and fresh sand entering the plots (Wrenn et al., Reference Wrenn, Venosa and Suidan1999). If the entire beach was contaminated, sand movement would not cause major experimental problems, since both the sediment entering and leaving the study area would be contaminated (Schratzberger et al., Reference Schratzberger, Danie, Wall, Kilbride, Macnaughton, Boyd, Rees and Swannell2003). In this study, we used an oil fence, acrylamide boards, and sufficient distance between the oil fence and control plot, to prevent oil mixing across plots. The TPH results showed that the oil sprayed in the experimental plots appeared to have minimal impact on the control plot.
It is difficult to design experiments that detect specific changes in meiobenthic assemblages, because of high variance among datasets and the characteristics of meiofauna. Such field experiments could be improved by: (1) increasing spatial replication (i.e. increased sampling effort within experimental and control plots or through the set-up of an additional block); or (2) increasing temporal replication (i.e. more frequent sampling over the experimental period). However, the restricted spatial extent of the study site precluded such increases in sampling intensity and frequency.
The present study showed that an oil spill would only have a short-term effect on the meiofaunal community, and that the structural characteristics of the community returned to normal when TPH concentrations returned to normal levels (i.e. at 1 month after oil application). The TPH concentrations of the control, Exp. 1 and Exp. 2 plots (which contained a small amount of oil) were significantly different to Exp. 3 and Exp. 4 plots (which contained larger quantities of oil). As expected, the concentration of TPH in the experimental plots after oil application was higher during the first 4 d after oil application compared to before oil application. TPH concentrations decreased at a faster rate during the first 4 d after application, and then subsequently decreased at a progressively slower rate. It appears that the residence time of the applied oil was relatively short. Possible reasons for this phenomenon might be evaporation, or dynamic processes acting on the beach during tidal action. The oil deposited on the sediment surface of intertidal sand or mudflats tends to be washed off by the tide, whereas oil that penetrates the sediment persists, with the residence time being dependent on the rate of biodegradation (Little, Reference Little1987; Hayes et al., Reference Hayes, Michel, Montello, Al-Mansi, Jensen, Narumalani, Aurand, Al-Momen and Thayer1993). Crude oil contains a greater amount of alkylated PAHs, rather than the 16 EPA priority PAHs. PAHs are one of the most toxic groups of contaminants, and derive from a wide range of sources. PAHs are released into all parts of the environment, either through natural or anthropogenic activities, and are known to be toxic, carcinogenic and mutagenic (Blumer, Reference Blumer1976; Harvey, Reference Harvey1997). The highest PAH levels generally occur below the sediment surface, where there is limited oxygen and a concomitant shift from aerobic to anaerobic bacterial taxa. PAH concentrations increase with increasing substrate depth and decreasing oxygen content (Li et al., Reference Li, Zhou, Wong and Tam2009). PAHs are persistent in the environment and tend to adsorb readily onto organic matter, particularly sediments because of their low water solubility and hydrophobicity (Johnson & Larsen, 1985).
The sharp decline in meiofaunal density in the experimental plots during the first 4 d after the spill might be attributed to the short-term toxic effects of the oil. In contrast, the temporal change in community structure at the control plot might be due to natural variation in the meiofaunal community. The TPH concentrations of control plot remained relatively stable. Therefore, it is unlikely that the control plot was affected by the experimental plots. This suggestion is supported by the significant negative effect of TPH on meiofaunal density across the study period. The period of low meiofaunal density also coincided with the maximum concentration of TPH in the sediment. In aquatic environments, pollutants are able to have a direct (toxic) effect on aquatic biota. The direct effects of toxicants typically reduce organism abundance (by increased mortality or reducing fecundity). Direct effects vary with the intensity and duration of exposure to a given toxicant. Studies frequently focus on the intensity and duration of exposure because predictive criteria to estimate risk and establish permissible levels of contamination are based on species responses to contaminants (Long et al., Reference Long, Macdonald, Smith and Calder1995). Several studies have also demonstrated the decline in meiofaunal density after oil contamination (Friethsen et al., Reference Friethsen, Elmgren and Rudnick1985; Heip et al., Reference Heip, Vincx and Vranken1985; Sandulli & de Nicola-Gludiei, Reference Sandulli and Nicola-Gludiei1990; Danovaro et al., Reference Danovaro, Fabiano and Vincx1995). In one study, a natural subtidal meiofaunal assemblage affected by an oil spill was reported to recover after just 2 wk (Danovaro et al., Reference Danovaro, Fabiano and Vincx1995). Meiofauna are generally expected to exhibit rapid decline and recovery in the presence of oil pollution, because of their dependence on the sediment and short generation time (Fleeger & Chandler, Reference Fleeger and Chandler1983).
However, several reports have produced contradictory results. For instance, some studies recorded an increase in meiobenthic copepods and macrobenthic polychetes after oil spillage (Fleeger & Chandler, Reference Fleeger and Chandler1983; Jewett et al., Reference Jewett, Dean, Smith and Blanchard1999). This phenomenon may be explained by some meiofaunal communities being very tolerant to toxicants, while others are much more sensitive (Austen & McEvoy, Reference Austen and McEvoy1997; Carman et al., Reference Carman, Bianchi and Kloep2000a), perhaps because tolerance patterns vary among species and community. Similarly, large variations in species tolerance under natural conditions have been documented in response to disasters, such as oil spills (Danovaro, Reference Danovaro2000). However, pollutants may indirectly affect tolerant species through a number of ecological mechanisms, termed indirect contaminant effects. It is not possible to detect indirect contaminant effects through laboratory based toxicity tests of single species. Instead, studies at the population, community or ecosystem level (most commonly conducted in field or microcosm experiments) are required (Cairns, Reference Cairns1983; Clements & Kiffney, Reference Clements and Kiffney1994). However, it is very difficult to conduct studies on indirect contamination effects. The duration, concentration, and frequency of toxicant exposure are potentially important factors; yet, studies explicitly examining the effect of exposure regime on indirect contaminant effects remain limited. If contaminant exposure is so strong that all but the most tolerant species are impacted, the opportunity for indirect effects is undoubtedly reduced (Fleeger et al., Reference Fleeger, Carman and Nisbet2003).
Despite the clear decline in density, meiofauna at the level of the major taxa was not sufficient to show any clear oil-induced disturbance in the current study. Conversely, the CLUSTER and ANOSIM proved to be highly efficient, showing that samples contaminated with oil had high TPH concentrations, with meiofaunal community samples collected before oil application or those with low TPH concentrations being partially separated from all other samples. The Spearman correlation coefficient showed that TPH concentration in the sediment had a negative and statistically significant relationship with meiofaunal parameters. These results indicated that meiofaunal communities had a negative response to increased TPH concentrations in this study.
The negative response of nematode species to experimental oil contamination was very clear. Shannon's diversity index showed that all experimental plots appeared to show a major effect on the free-living nematode community. Shannon's diversity index decreased with increasing TPH contamination after oil application. Hydrocarbon contamination was responsible for the observed decrease in nematode density and diversity, by causing the mortality of the most sensitive species to increase (Carman et al., Reference Carman, Fleeger and Pomarico2000b). However, the nematode community was not affected in plots with low TPH concentrations (below 100 ppm). This result indicates that the nematode assemblages in plots with low TPH concentrations retained a similar structure to those in the control. In the MDS and CLUSTER analysis for the nematode assemblages, the samples with high oil concentrations were separated from the samples with low oil concentrations, indicating a gradual change in community composition with decreasing TPH concentration over time. All nematode species were eliminated in all experimental plots after oil application, regardless of concentration. In particular, major dominant species seemed to be intolerant to oil contamination, including Enoplolaimus spp., Ascolaimus spp., Enoploides spp., Chromadorita spp. and Theristus spp.
The meiofaunal community structure in the experimental plots was similar before and 1 month after oil application. Experimental oil application in the intertidal sandy sediments did not generate any observable decline in meiofaunal density at 1 month after oil application for any taxonomic group investigated in this experiment. The only noticeable observation was that meiofaunal density sharply declined immediately after oil application in the experiment plots. Furthermore, meiofaunal density progressively recovered as time passed. Alongi et al. (Reference Alongi, Boesch and Diaz1983) and Decker & Fleeger (Reference Decker and Fleeger1984) described the fast colonization rates of meiofauna by conducting in situ manipulative experiments to examine the rate at which meiobenthos colonizes oiled and untreated azoic sediments. Fast recovery rates of meiofaunal assemblages were also reported by Bodin (Reference Bodin1988), Moore and Stevenson (Reference Moore and Stevenson1997), and Danovaro (Reference Danovaro2000), who conducted experiments on real oil spills over timeframes of 9 months and 3 yr. Giere (Reference Giere1979) and Boucher (Reference Boucher1980) found that meiofauna in the field appear to recover within 1 yr after an oil spill. The rapid dispersal of meiofauna may be described primarily in transport via resuspended sediment in conjunction with active migration and habitat selection (Palmer, Reference Palmer1988; Commito & Tita, Reference Commito and Tita2002). In several studies, the structural characteristics of meiobenthic community recovered after a few weeks, and were practically indistinguishable from pre-pollution conditions after a few months, indicating the high resilience of this group (Danovaro, Reference Danovaro2000).
ACKNOWLEDGEMENTS
We are very grateful to Yim UH and staff of KIOST, who helped with THP analysis. We wish to thank all our colleagues who were directly and indirectly involved in the sample collection and analysis.
FINANCIAL SUPPORT
This research was partially supported by the research program of KIOST with Contract No. PM57432 and PE 98928.