I. INTRODUCTION
For many years, the only way to synthesize cathode materials has been by thermal treatment at high temperatures from mixtures of reactants. Due to diffusional limitations and low reactivity of starting materials, this solid-state method implied long reaction times, high temperatures, and regrinding processes between subsequent firings. Due to the above mentioned drawbacks, the solid-state reaction method is considered to be a low-efficiency, energy- and time-consuming technology that, in addition, produces a wide range of particle size distribution (PSD), which could prevent the preparation of high-performance powder materials. Reference Nazri and Pistoia1
Many electrical ceramic materials are metastable phases, and therefore, nontraditional synthesis methods must be devised to allow kinetics to override thermodynamics. Consequently, several soft chemistry techniques have been strongly studied, such as hydrothermal, Reference Meligrana, Gerbaldi, Tuel, Bodoardo and Penazzi2,Reference Chen, Vacchio, Wang, Chernova and Zavalij3 sol–gel, Reference Lin, Pan, Gao and Liu4,Reference Hu, Zhang, Cao, Zhang and Li5 coprecipitation, Reference Jugović, Mitrić, Kuzmanović, Cvjetićanin, Škapin, Cekić, Ivanovski and Uskoković6 combustion synthesis, Reference Liu, Hu, Wen, Lei and An7 spray pyrolysis, Reference Gomez, de Meatza, Martin, Bengoechea and Cantero8 molten salt synthesis, Reference Zhang and Urquidi-Macdonald9 complex formation methods, Reference Lu, Chen, Robert and Deng10 classical precipitation, Reference Arnold, Garche, Hemmer, Ströbele, Vogler and Wohlfahrt-Mehrens11 solvothermal, Reference Wang, Zhang, Yang, Weng and Jin12 microwave-assisted solvothermal, Reference Tarascon, Recham, Armand, Chotard, Barpanda and Walker13 Pechini process, Reference Liu, Farrington, Chaput and Dunn14 and ionothermal Reference Recham, Chotard, Jumas, Laffont, Armand and Tarascon15 syntheses. Despite the fact that these synthetic processes have yielded very interesting advantages when produced in the research laboratory, some of them cannot be used for mass production because they require complicated preparation steps to obtain the correct stoichiometric compound and need further calcination and grinding of powders to obtain high crystallinity. Furthermore, these techniques use very low concentrations of starting materials, which leads to a very low-production rate. Therefore, it is crucial to develop a simple, scalable, high-yield, cost-effective technique to be suitable for industrial processing.
A versatile technique called the polymeric steric entrapment precursor route has been developed to produce multicomponent ceramic powders. Reference Gülgün, Nguyen and Kriven16–Reference Gülgün, Kriven and Nguyen20 The chemistry of the precursor solution differs from other solution–polymerization techniques. The stabilization of the cations in the precursor is established not only through the chemical (hydrogen) binding of cations with the functional groups but also, in major part, through the physical entrapment of the metal ions in the network of the dried polymer carrier. It has been also documented for this method that the decomposition of the polymer is similar to that of a fuel-oxidizer system. The fuel can be any polymer in which oxidation occurs easily. The oxidizer is usually an acid or, in the specific case of this method, nitrate source. It has been proposed that the ratio of oxidizer to fuel should be close to unity to release the maximum energy to induce ceramic conversion. Unless the chemistry behind this method is more elaborate, the factors, which must be considered to produce particles with the desirable crystal structure, microstructure, particle size/size distribution, particle morphology, and high purity, are: (i) the size and valence of the cations, (ii) the degree of polymerization, (iii) the oxidizer/fuel ratio, (iv) type of solvent, (v) calcination, and (vi) crystallization temperature and time.
The polymeric steric entrapment precursor route has been successfully used to synthesize various monophase, fine (micro and nano), and pure mixed-oxide powders with high-technological importance. Reference Gülgün, Nguyen and Kriven16–Reference Gülgün, Kriven and Nguyen20 So far, the polymerized organic–inorganic entrapment route leads the synthesis reaction toward the maximum oxidation state, and it is considerable challenge to find a way to control the different oxidation states through this synthesis route, which can be useful to produce a wide range of technologically important compounds.
The aim of this work is to use the polymeric steric entrapment precursor synthesis route to produce a phosphate cathode material (LiFePO4) based on 3d intermetallic elements. This material is a member of complex compounds that contain cations capable of adopting various oxidation states (zwitterions), which enable them to be used for electronic applications. LiFePO4 was selected as a model compound to understand how variables, such as the amount of water, pH of the solution, drying procedure, HNO3 addition, amount of polymer, calcination/crystallization atmosphere, and temperature, affect the synthesis. The physical characteristics of the powders produced would be compared to commercial powders produced by the MTI Corp., Richmond, CA.
II. EXPERIMENTAL PROCEDURES
A. Powder synthesis
The cation sources for LiFePO4 preparation were lithium nitrate (LiNO3, Reagent Plus®, from Sigma Aldrich Co, St Louis, MO), iron(III) nitrate nonahydrate [Fe(NO3)3·9H2O, ACS Reagent ≥98%, Sigma Aldrich Co, St Louis, MO], and ammonium phosphate dibasic [(NH4)2HPO4, Reagent Grade, ≥98.0%, Sigma Aldrich Co, St Louis, MO].
Polyvinyl alcohol (PVA, [CH2CH(OH)] n ) was selected as a polymer to perform the steric entrapment because all of the cations and PVA are soluble in water. Due to the fact that the amount of water in the system affects some synthesis variables, such as pH and some processing variables such as drying time, a 20 wt% solution of PVA in deionized (DI) water was prepared using an 80% hydrolyzed PVA (M.W. 9000–10,000, Sigma Aldrich Corporation). The polymer was dissolved by adding small quantities to DI water (to reduce mixing time) and stirring on a hot plate at room temperature overnight.
 $${\rm{LiN}}{{\rm{O}}_3} + {\rm{Fe}}{\left( {{\rm{N}}{{\rm{O}}_3}} \right)_3} \cdot 9{{\rm{H}}_2}{\rm{O}} + {\left( {{\rm{N}}{{\rm{H}}_4}} \right)_2}{\rm{HP}}{{\rm{O}}_4} <$$><$$>+ {\left[ {{\rm{C}}{{\rm{H}}_2}{\rm{CH}}\left( {{\rm{OH}}} \right)} \right]_n} + {\rm{HN}}{{\rm{O}}_3} \to {\rm{LiFeP}}{{\rm{O}}_4} + W{\rm{N}}{{\rm{O}}_X} \uparrow <$$><$$>+ X{\rm{C}}{{\rm{O}}_X} \uparrow + Y{\rm{N}}{{\rm{H}}_3} \uparrow + Z{{\rm{H}}_2}{\rm{O}} \uparrow \quad {\rm{.}}$$
Stoichiometric amounts of the Li, Fe, and P sources, according to Eq. (1), were dissolved independently in 40 mL of DI water and stirred for 1 h to ensure complete dissolution and homogeneity. Then the cation solutions were mixed in specific order to avoid agglomeration or gelation. First, Li and Fe nitrate solutions (pH = 8.69 and pH ≈ 0, respectively) were mixed, and then the P source (pH = 7.88) was added dropwise. Table SI shows the pH of each cation solution, each mixing step, and the final solution pH. It was noticed that when the P source was added to the Li and Fe mixture, the pH started to rise and the solution formed agglomerates, which could be redissolved as soon as the pH solution was reduced below 0.5. For this matter, addition of HNO3 was necessary to form a clear solution.
The amount of PVA solution added to the system was calculated based on the ratio of total (+) valences of the cations to the (−) valences of the OH- functional groups in the PVA. For the model system, different ratios were evaluated, 2:1, 4:1, and 6:1. The final solution (cation + PVA) was allowed to mix overnight to ensure a thorough mixing of all components.
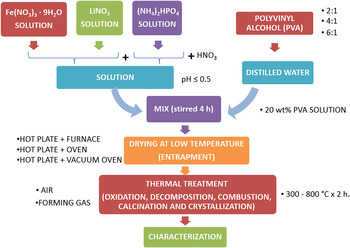
Three different ways to dry the solution were tested and are shown in Table I. Samples of Type (I) and (II) were dried on a hot plate in air, and reddish dried powders were obtained. Samples, Type (III), were dried in an oven (Blue M - OV18-A, Electrical Company, Blue Island, IL) in air, where pale yellowish dried powders were produced. Also, a smell of nitrate decomposition was noticed. Samples of Type (IV) were dried in a vacuum oven (Fisher Scientific, Model 282 A, Pittsburgh, PA), where a pale yellowish dried gel was obtained. In fact, dried gels were more or less sticky, depending on the amount of PVA used. All dried samples were ground with a mortar and pestle, and then thermally treated as shown in Table I, either using a calcining furnace (Carbolite CWF 12/13, Carbolite Inc. Hope Valley, UK), when air atmosphere was required or, a controlled atmosphere alumina tube furnace (Lindberg, Asheville, NC), when a reducing atmosphere (forming gas, 95% N2 and 5% H2) was necessary. A flowchart of the polymeric steric entrapment method and the variables tested to produce LiFePO4 is shown in the Fig. 1.
Drying, calcination, and crystallization conditions to produce LiFePO4.

Flowchart of the polymeric steric entrapment method and the variables tested to produce LiFePO4.

B. Powder characterization
Simultaneous differential scanning calorimetry and thermogravimetric analysis (DSC/TGA) (Model STA 409, Netzsch GmbH, Selb, Germany) were used to evaluate endothermic and exothermic processes, such as pyrolysis, decomposition, and crystallization of precursors in the model system. The samples used for this analysis were the LiFePO4 precursors with different amounts of polymer dried under conditions (I) and (IV). The analyses were performed at a heating rate of 5 °C/min in the temperature range of 25–850 °C under N2 atmosphere.
The evolution of crystalline phases as a function of heating temperature was studied using an x-ray diffractometer (Seimens-Bruker D5000, Bruker AXS Inc., Madison, WI), with Cu Kα radiation (λ = 1.540598 Å). The operating conditions of the diffractometer were 40 kV, 30 mA, 10°–70° 2θ, at a step size of 0.02° 2θ, and a measurement time of 0.5 s per step. The X'pert HighScore Plus software (PANalytical, version: 3.0.5.) was used to identify the phases in the samples.
The morphologies and crystallite sizes of all samples were examined by scanning electron microscopy (SEM; JSM-6060LV, JEOL USA, Inc., Peabody, MA). Prior to imaging, the samples were Au–Pd sputter-coated to avoid surface charging. To confirm the production of nanoparticles, transmission electron microscopy (TEM) was performed on the best sample in this study using a JEOL-2010 (LaB6 thermionic emission source; JEOL USA, Inc., Peabody, MA) electron microscope at an acceleration voltage of 200 keV. For TEM sample preparation, a planetary mill (Planetary Micro Mill PULVERISETTE 7 classic line, Fritsch, Idar-Oberstein, Germany) was used to break up the soft agglomerates produced in the calcination/crystallization process. The wet grinding process was performed in water at 350 rpm for 10 min. Drops of the slurry were placed on top of carbon-coated 200 mesh copper grids.
A Perkin Elmer 2400 Series II CHNS/O elemental analyzer (2400 Series II, PerkinElmer Inc., Waltham, MA) was used to determine the residual carbon, hydrogen, and nitrogen contents in the final powders. The chemical composition was analyzed using inductively coupled plasma (ICP) emission spectroscopy (PerkinElmer 2000DV ICP-OES, Norwalk, CT). All work was done at the School of Chemical Sciences at the University of Illinois at Urbana-Champaign.
The particle size and PSDs of calcined powders were evaluated using a laser scattering, particle size analyzer (Partica LA-950V2, Horiba, Kyoto, Japan) with water as a dispersion medium. The specific surface area (SSA) was measured using seven-point BET analyses by nitrogen gas adsorption (Model ASAP 2020, Micromeritics, Norcross, GA). To perform PSD and SSA, the samples were ground in the same way as for TEM sample preparation.
III. RESULTS AND DISCUSSION
A. Calcination/crystallization atmosphere effect
Samples were prepared using drying condition (A) summarized in Table I, which is the standard procedure for the production of ceramic powders by the organic steric entrapment method. Reference Gülgün, Nguyen and Kriven16–Reference Gülgün, Kriven and Nguyen20 The effect of atmosphere was tested for samples with two different cation/organic ratios of 4:1 and 2:1.
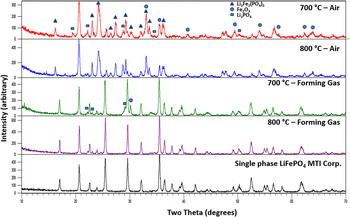
Figure 2 and Fig. S1 are x-ray diffractograms for the samples made in air and forming gas at 700 and 800 °C using cation/organic ratios of 4:1 and 2:1, respectively. The black spectrum in both figures is the LiFePO4 commercial powder from MTI Corp., used as a reference. These figures clearly show that by working in air it is not possible to obtain a single phase; rather a powder with more than five phases, including binary and ternary compounds [Li3Fe2(PO4)3, Fe2O3, Li3PO4], were obtained. However, by working in forming gas, powders with less than three phases mostly consisting of LiFePO4 could be obtained. These results demonstrate that a more reduced atmosphere is required to avoid formation of oxidized secondary and ternary phases. If oxidized binary or ternary species are formed during any step of the synthesis process, it is difficult and requires further consumption of energy to remove them in subsequent stages of the synthesis, because usually they are thermodynamically stable. It would take high energy (time, temperature, and multiple grinding steps) to transform all of those phases to the desired LiFePO4 single phase. Based on these results, forming gas (95% N2 and 5% H2) was selected as a calcination/crystallization atmosphere and as a standard condition to evaluate the other variables in the model system.
XRD patterns for samples made with a cation/organic ratio 4:1 in air and forming gas at 700 and 800 °C.

B. Solution pH effect
The advantage of producing materials using a wet chemical process is the ability to form a solution that has all the components very well dissolved and homogeneously distributed in the entire volume. In other words, it is to have an ionic mixing between all of the components. When all elements in the mixture dissolve, it is a solution and it is transparent; however, when the elements do not dissolve, the mixture is a dispersion and it is cloudy or milky. The best scenario is when a clear solution is formed because an ionic mixing of elements and homogeneity in the entire volume can be reached. When agglomerates, flocculates, or precipitates are formed, segregation of the components, heterogeneities, and multiphases in the final product can be expected. The ionic characteristics of each component and the pH of the solution can cause gelation, agglomeration, flocculation, or precipitation. As it was shown in the Table SI, the pH of the Fe source is strongly acidic (Fe nitrate, pH ≈ 0) and for the P source is approximately neutral (pH = 7.88); this wide pH difference can cause coagulation.
When solutions containing Fe and Li sources were mixed, a clear solution could be formed. However, when the solution containing the P source was added to the former solution, an agglomeration of components was observed [Fig. S2(a)]. It was noticed that by keeping the pH of the solution below 0.5, the agglomerates could be dissolved, and a clear solution formed [Fig. S2(b)], while by having the pH above 0.5, the agglomeration was irreversible, and a cloudy dispersion formed [Fig. S2(c)]. If agglomeration occurred, additional stirring homogenized the solution, but a clear solution was never reached. Instead, a cloudy and milky dispersion was formed. As was mentioned before, a transparent solution, where an ionic mixing is guaranteed, is crucial for single-phase formation. Therefore, nitric acid (HNO3) was added dropwise, while the solution containing P source was added to the solution containing Li and Fe sources. HNO3 was selected because it would not affect the stoichiometry of the system and would burn out during the calcination process. Based on these results, mixing the reagents at pH below 0.5 was established as a standard condition to produce a clear solution that guaranteed the ionic mixing of all components in the system.
C. Solution drying effect
Samples dried using conditions (I) and (IV), shown in Table I, were examined in a simultaneous DSC/TGA apparatus to evaluate endothermic and exothermic processes, such as pyrolysis, decomposition, and crystallization of precursors. These two extreme conditions were selected because in (I) the organics and nitrates released during drying were abundant, and this procedure has been the standard procedure used thus far in the production of ceramic powders by the organic steric entrapment method. Reference Gülgün, Nguyen and Kriven16–Reference Gülgün, Kriven and Nguyen20 Moreover, in samples dried using condition (IV), the release of organics or nitrates was barely detected, which allowed the full availability of these two components (fuel and oxidizer) for the next steps (calcination/crystallization).
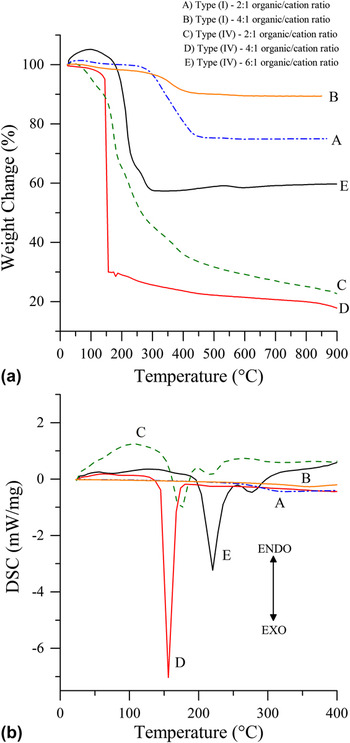
Figure 3 shows TGA and DSC curves of the dried samples Type (I) and Type (IV). Curves A and B correspond to Type (I) dried samples made with the cation/organic ratios 4:1 and 2:1, while curves C, D, and E correspond to Type (IV) dried samples made with the cation/organic ratios 2:1, 4:1, and 6:1. For dried samples of Type (I), thermal analyses indicated that there was an exothermic peak at a temperature around 350 °C. This peak could be associated with the initiation of the crystallization process. The total weight percent loss was about 11 and 26% for the 4:1 and 2:1 samples, respectively. These values agreed with differences in the initial amount of organics in both samples. It is also important to remember that these samples were dried on a hot plate at ≈ 350 °C and then calcined in air for 2 h at 250 °C (10 °C/min) before performing DSC/TGA analyses. Orange and white gases were observed during drying, and a reddish dried powder was obtained. For dried samples Type (IV), the total weight percent lost was about 78, 83, and 40% for 2:1, 4:1, and 6:1 samples, respectively. These total weight-loss percentages were larger [compared with those of samples Type (I)] because the samples were dried at a low temperature to remove only the water content. All the organics and nitrates remained in the sample and could be used in subsequent steps in the synthesis. In addition, the maximum weight loss could be observed at the same temperature where the large exothermic peak in the DSC curve was seen. These large weight losses can be attributed not only to the release of gases of organics and nitrates but also, to some sample losses from the sample container, due to the highly exothermic reaction taking place during the analysis. These intense exothermic reactions were observed not only during the thermal analysis but also during the powder production in the laboratory. In addition, the TGA curves indicated that full calcination occurred at low temperature, especially for sample 4:1 at 150 °C. The precise nature of the decomposition mechanism and released gases is beyond the scope of this paper.
(a) TGA and (b) DSC analysis of dried samples Type (I) made with 2:1 and 4:1 organic cation ratio (curves A and B, respectively) and dried samples Type (IV) made with the cation/organic ratios 2:1, 4:1, and 6:1 (curves C, D, and E, respectively).

Differential scanning calorimetric curves revealed two different exothermic peaks for samples made using ratios 2:1 and 6:1. These two peaks could be attributed to organics and nitrates decomposing at different temperatures. For the sample with ratio 2:1 (curve C), the decompositions were observed at 175 and 225 °C, whereas for the 6:1 sample (curve E), the decomposition reactions took place at 220 and 275 °C. In the tube furnace (for sample 2:1), a strong and long decomposition reaction was also observed, where yellow/white gases were released. Moreover, for sample 6:1, the decomposition reaction was short and not strong as the previous reactions, and the released gases were mostly white in color.
In the case of the sample with ratio 4:1 (curve D), a single large exothermic peak was sensed in the DSC analysis at 150 °C, which meant that not only did the organics and nitrates decompose at the same time but also the crystallization started at a very low temperature. All the energy available from these decomposition reactions was released at the same time and could be used to induce crystallization. This exothermic peak perfectly matched the large weight loss observed in the TGA curve. This decomposition reaction was also observed in the tube furnace; it was very violent and long, and the released gases were red/yellow in color. From the DSC analysis, it can be seen that there was an optimum ratio between organics and nitrates to produce a strong and single exothermic decomposition reaction. For this model system, the optimum ratio was 4:1. This was the best scenario to generate the maximum amount of energy in the system, which could be used to induce crystallization. Movements to a higher or lower ratio from this optimum shifted the decomposition reaction as well as the crystallization onset toward higher temperatures.
D. Crystallization
Figure 2 shows that at 700 °C, small amounts of secondary phases were still present in the sample made using drying and calcination/crystallization conditions (II) listed in Table I. However, upon increasing the temperature to 800 °C, those secondary phases recombined through a solid-state reaction to form a single phase. It is important to mention here that unless an ionic mixing was guaranteed and sufficient amount of polymer was added to the system to ensure steric entrapment and avoid segregation, formation of single phase at low temperature was unsuccessful. High temperature (800 °C) and solid-state diffusion would be required to form pure LiFePO4 phase.
In contrast, by taking advantage of the strong, energetic, and highly exothermic decomposition reactions observed in the dried samples of Type (IV), crystallization at lower temperatures was possible. As it was seen in the thermal analysis (Fig. 3), the temperature, magnitude, and characteristics of the decomposition reaction were dependent on the ratio of organics/nitrates (i.e., fuel/oxidizer). Figures S3 and S4 and Fig. 4 show the phase evolution when temperature was increased (300–800 °C) for the dried samples Type (IV) with different cation/organic ratios of 2:1, 4:1, and 6:1. All samples were compared not only with the ICDD-PDF cards but also with commercial LiFePO4 from MTI Corporation.
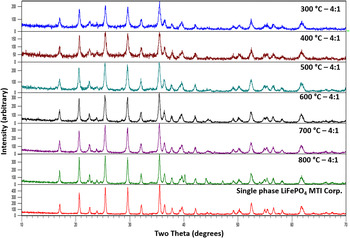
X-ray diffractograms of dried samples Type (IV) with 4:1 cation/organic ratio in the range 300–800 °C. Single-phase LiFePO4 was obtained under all conditions.

Formation of a single-phase LiFePO4 was possible at 500 °C using a 2:1 cation/organic ratio. Samples below 500 °C indicated formation of small amounts of crystalline phases, but an amorphous phase was still present. No secondary phases were detected in samples treated above 500 °C, which meant that ionic mixing and steric entrapment were successful. Here in this group of samples, the effect of the exothermic decomposition reaction on the crystallization process was evident. The energy released during the decomposition of organics and nitrates helped to induce crystallization of the single-phase LiFePO4 at lower temperatures, as compared to other synthesis methods as well as to the methodology implemented for dried samples of Type (II).
For samples containing a 4:1 cation/organic ratio, the results were even more interesting. As can be seen in Fig. 4, the formation of a pure crystalline LiFePO4 phase at 300 °C was successful. At 300 °C, peak broadening and less intense peaks than the reference sample suggested the formation of nanoparticles. At 800 °C, some extra peaks were detected, which corresponded to Fe2P. These results agreed with the information obtained from the thermal analysis where a single strong exothermic peak was detected at 150 °C. Moreover, in the tube furnace, the decomposition reaction was detected at around 240 °C, and it seems that the energy released was enough to induce crystallization of the single phase. As no secondary phases were detected in the samples below 800 °C, it suggests that the ionic mixing and the amount of organics and nitrates were in the right proportion to produce the steric entrapment. Thereby, we avoided segregation and generated a single exothermic decomposition reaction that was strong enough to crystallize olivine-type LiFePO4 at low temperatures.
Samples containing a 6:1 cation/organic ratio (Fig. S4) only produced amorphous powder below 500 °C; however, the onset of crystallization was noticed at around 500 °C. Secondary phases, especially binaries and oxidized species, such as Fe2O3, were detected. With increasing temperature and under reducing atmospheres, those secondary phases recombined through solid-state reaction to form a more pure powder. These results confirmed the information obtained in the thermal analysis where the exothermic peaks were detected at higher temperatures of 220 and 275 °C. This was observed in the tube furnace at around 290 °C. The fact that the decomposition of organics and nitrates took place at different temperatures led to the exothermic reaction being less strong (Fig. 3). This means that the energy released was insufficient to induce crystallization at a low temperature. The finding of secondary phases suggested that unless there was ionic mixing, the amount of organics was not sufficiently sterically entrapping the cations so as to avoid segregation. These results demonstrated that there is an optimum ratio (4:1) of organics/nitrates not only to affect the polymeric steric entrapment but also to generate a single strong exothermic decomposition reaction, which provides enough energy to induce crystallization of the desired phase at temperatures lower than those involved in conventional methods. Shifts from the optimum ratio provoked delays in the starting of the decomposition reaction because extra energy was required to decompose the extra amount of organics, and also because the amount of nitrates was not enough to react with the total amount of organics. This was the case for 2:1 ratios. For 6:1 ratios, there is also an imbalance of fuel/oxidizer, which made the exothermic reaction of organics and nitrates to occur at different temperatures and also produces a less energetic reaction. Furthermore and more importantly, the amount of organics was not enough to make an optimum steric entrapment that produced segregation of the components in the system and allowed formation of multiphase materials.
E. Microstructure characterization
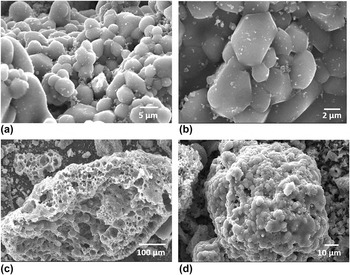
The microstructure of LiFePO4 produced from the dried sample type (II) at 800 °C is shown in the Figs. 5(a) and 5(b). Platelet-like crystals in the range between 0.5 to 10 μm were found in the samples. Evidence of crystal growth and necking (sintering) was found in this sample, which means that high temperature promoted mass diffusion toward the particle interfaces. This also proved that solid-state diffusion took place, and so that secondary phases recombined and disappeared at higher temperatures. Unless this sample was pure LiFePO4 and the microstructure resembled the microstructure reported in the literature for triphylite, 800 °C was a high processing temperature, which was not only uneconomical for an industrial process but also produced large crystals and sintered powders, which affected the surface area.
SEM micrographs of pure LiFePO4 formed using drying and calcination/crystallization (a) and (b) Type (II) and (c) and (d) Type (IV). (a) and (b): Platelet-like crystals in the range between 0.5 and 10 μm. (c) and (d) Porous secondary particles (soft agglomerates) formed from primary particles in the range of 20 nm–10 μm.

Moreover, the morphology of the powders produced by the polymeric steric entrapment method, and specially using dried sample Type (IV), was porous secondary particles (soft agglomerates) formed from primary particles in the range of 20 nm–10 μm [Figs. 5(c) and 5(d)]. These secondary particles or soft agglomerates resulted in this particular microstructure due to the intense exothermic decomposition reaction of organics and nitrates. These porous structures had a high SSA, which may be helpful for ion and electron diffusion in lithium ion batteries, specifically for LiFePO4.
In general, for samples made at temperatures between 300 and 400 °C using optimized conditions and cation/organic ratios of 2:1 and 6:1 (Fig. S5), particles without any particular shape were found because of the lack of crystallization. Nanocrystals with platelet-like shapes and with a narrow distribution of sizes, in the range of 50–150 nm, could be observed in samples made at temperatures between 500 and 600 °C using a cation/organic ratio of 2:1. At higher temperatures (700–800 °C), crystals about 1 μm in size with platelet-like shapes and a narrow size distribution were produced for both conditions 2:1 and 6:1 cation/organic ratios. Additionally, crystal growth and necking between particles were noticed, which meant that solid-state diffusion started and presintering took place.
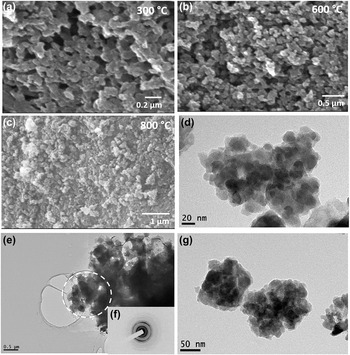
Figure 6 exhibits a pure crystalline LiFePO4 powder obtained using optimized conditions and a cation/organic ratio of 4:1 at temperatures in the range 300–800 °C. At 300 °C [Fig. 6(a)], nanoparticles of roughly less than 100 nm were formed. These nanoparticle sizes were narrowly distributed and had a platelet-like shape. It can be seen that at 600 °C [Fig. 6(b)] and 800 °C [Fig. 6(c)], crystals still had sizes in the nanoscale range of about 100 nm. These results were very interesting because after increasing the furnace temperature up to 800 °C, there was not too much crystal growth or presintering. This effect was very important because it meant that small particle size and high-surface area can be kept even while working at high temperatures. It is believed that this behavior occurred because of the organic steric entrapment. The remnant carbon covered and coated the nanoparticles, thereby avoiding solid-state diffusion and hence crystal growth and sintering. It is important to mention that pure LiFePO4 produced at low temperatures (300 °C) by the polymeric steric entrapment method was comparable with the LiFePO4 produced by other wet chemical synthesis methods, such as the sol–gel and hydrothermal methods. Reference Meligrana, Gerbaldi, Tuel, Bodoardo and Penazzi2,Reference Lin, Pan, Gao and Liu4 In contrast to these methods, however, expensive reagents (alkoxides), high-pressure or special-sealed containers, and large amounts of polymers were not used. That is why the most interesting sample in this study was the powder obtained using the optimized conditions and a cation/organic ratio of 4:1 at 300 °C: because it was pure crystalline LiFePO4 produced at really low temperature, with particle sizes less than about 100 nm. The production conditions and the characteristics described suggested a material with high-surface area, carbon coating, and small diffusion paths for ions and electrons, which makes this a promising material for energy storage applications. TEM characterization [Fig. 6(d)] clearly shows agglomerates of about 1 μm formed by platelet-like nanoparticles of 20 nm. A diffraction pattern of the selected region in the micrograph (e) is shown in the micrograph (f), where clear periodic rings which correspond to a polycrystalline sample can be seen. The nanoparticle microstructures revealed in Fig. 6 were consistent with the peak broadening evident in the x-ray diffraction (XRD) analysis.
SEM and TEM micrographs of LiFePO4 powder produced under optimized conditions and cation/organic ratio 4:1 at (a) 300 °C, (b) 600 °C, (c) 800 °C, (d) 20 nm length scale, (e) 0.5 μm length scale, (f) diffraction pattern of selected region, and (g) 50 nm length scale.

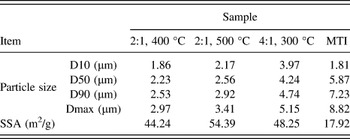
To conclude the characterization of LiFePO4 and comparison with the reference, a particle size analysis, SSA, and chemical analysis were carried out under the same conditions. Table II summarizes the physical properties of the best samples of pure LiFePO4 obtained in this work. Samples made at cation/organic ratio 2:1 at 400 °C are included because it was an amorphous precursor to produce pure LiFePO4 using the polymeric steric entrapment method.
Physical properties of the best samples of pure LiFePO4 produced by the polymeric steric entrapment method.

It can be noticed that the values of the particle size analysis were very far away from the crystal sizes observed in the SEM and TEM micrographs. These results indicated that the particle size measured by a laser scattering particle size analyzer (Partica LA-950V2, Horiba, Kyoto, Japan), really measured the agglomerates, which were also observed in the low magnification SEM and TEM micrographs. What is important, however, is the fact that in comparing our results with the commercial references, both the crystal sizes and the agglomerated particles produced in this work were smaller than the reference powders. The SSA values (Table II) indicated that all powder produced in this study had twice the SSA of the MTI reference powder. These results were expected because of both the crystallite sizes (nanocrystals) and the sponge-like microstructure of the agglomerates observed in the SEM and TEM micrographs. Having powders with high surface area may be advantageous for electronic applications because it can improve the ionic and electronic conduction.
Chemical compositions of selected samples are shown in Table SII. These samples were chosen to see how the carbon content changed with temperature and cation/organic ratio. It was important to take into account that the nature of the exothermic reaction also affected the carbon and nitrogen content because both fuel and oxidizer were consumed during the reaction. The ICP chemical analysis had the disadvantage that the values were expressed in terms of weight percent (wt%), which takes into account the whole mass of the powder. Large variation could be expected in all elements measured because they were relative to the amount of other elements, such as C, N, H, and O, which were consumed or added during the synthesis process. For instance, multiphase samples containing oxidized phases had more oxygen in the whole mass, which affected the relative amount of other cations in the system.
Nevertheless, there was a tendency to retain about 10 and 1.5–2 wt% of carbon and nitrogen, respectively, in samples calcined/crystallized at low temperatures using cation/organic ratios of 2:1 and 4:1. Furthermore, the amounts of carbon and nitrogen decreased with increasing temperature. For Li ion battery applications, it has been demonstrated that carbon coating improves the electrical conductivity of the active particles, improving electrochemical performance. Therefore, the fact that, in this work, LiFePO4/C composites have been produced in situ generates hopeful expectations for energy storage applications. Samples calcined/crystallized using cation/organic ratio 6:1 showed low contents of C and N. These results agreed with the low amount of organic (PVA) added during the synthesis.
IV. CONCLUSIONS
In this work, we have shown how to synthesize pure crystalline LiFePO4 powder using the polymeric steric entrapment precursor route. Nanoparticles of about 20 nm in size were crystallized at 300 °C. This material is a ternary compound based on 3d metal redox elements that contains cations capable of adopting various oxidation states (zwitterions), which enable them to be used for electronic applications. We shed light on how variables, such as the amount of water, pH of the solution, drying procedures, HNO3 addition, amount of polymer, calcination/crystallization atmosphere, and temperature, affect the synthesis process. When drying the solution at a low temperature of 70 °C using a vacuum oven, the release of organic or nitrates was barely detected, which meant full availability of these two components (fuel and oxidizer) for the next steps (calcination/crystallization). Fuel and oxidizer generated a strong exothermic reaction, which could be used in situ for crystallization. The temperature, magnitude, and characteristics of the decomposition reaction were dependent on the ratio of organics/nitrates (i.e., fuel/oxidizer). It has been proven that there was an optimum ratio of 4:1 for LiFePO4 of organics/nitrates not only to allow the polymeric steric entrapment but also to generate a single strong exothermic decomposition reaction, which provided enough energy to induce crystallization of the desired phase at lower temperatures than in conventional methods.
Supplementary Material
To view supplementary material for this article, please visit http://dx.doi.org/jmr.2015.181.
ACKNOWLEDGMENTS
This work was supported by a Colombian Company, Sumicol-Corona S.A. and Daniel Ribero also received partial support from to SENA (The National Learning Service of Colombia). Use of the facilities in the Center for Microanalysis of Materials in the Frederick Seitz Materials Research Laboratory at the University of Illinois at Urbana-Champaign (which are partially supported by the US Department of Energy under grants DE-FG02-07-ER46453 and DE-FG02-07-ER46471) is gratefully acknowledged. The authors would like to acknowledge Max McKittrick for his contributions during the synthesis of materials for this work and Steven Letourneau for his assistance in transmission electron microscopy.